Private Equity and Venture Capital in Brazil - BVCA admin
Private Equity and Venture Capital in Brazil - BVCA admin
Private Equity and Venture Capital in Brazil - BVCA admin

Create successful ePaper yourself
Turn your PDF publications into a flip-book with our unique Google optimized e-Paper software.
In partnership with<br />
<strong>Private</strong> <strong>Equity</strong> <strong>and</strong><br />
<strong>Venture</strong> <strong>Capital</strong> <strong>in</strong> <strong>Brazil</strong><br />
In partnership with<br />
In association with Offshore jurisdiction<br />
sponsor<br />
Support<strong>in</strong>g sponsor
International<br />
Series <strong>Brazil</strong><br />
Open<strong>in</strong>g Remarks<br />
Mark Florman<br />
Chief Executive, <strong>BVCA</strong> <strong>and</strong> Chairman of the Forum<br />
In partnership with
In partnership with<br />
In association with Offshore jurisdiction sponsor<br />
Support<strong>in</strong>g sponsor<br />
In partnership with
International<br />
Series <strong>Brazil</strong><br />
Welcome Remarks<br />
Sidney Chameh<br />
President, <strong>Brazil</strong>ian <strong>Private</strong> <strong>Equity</strong> <strong>and</strong> <strong>Venture</strong><br />
<strong>Capital</strong> Association<br />
In partnership with
Sidney Chameh, Chairman, A<strong>BVCA</strong>P<br />
presidente@abvcap.com.br<br />
November 2011<br />
London & Madrid<br />
5
Agenda<br />
• <strong>Brazil</strong>: A Macro Overview<br />
• <strong>Private</strong> <strong>Equity</strong> <strong>and</strong> <strong>Venture</strong> <strong>Capital</strong> <strong>in</strong> <strong>Brazil</strong><br />
• A<strong>BVCA</strong>P<br />
Source: IBGE, IPEA.<br />
6
A Brief Macro Overview<br />
30.0%<br />
25.0%<br />
20.0%<br />
15.0%<br />
10.0%<br />
5.0%<br />
0.0%<br />
15.0%<br />
13.0%<br />
11.0%<br />
9.0%<br />
7.0%<br />
5.0%<br />
3.0%<br />
1.0%<br />
-1.0%<br />
-3.0%<br />
-5.0%<br />
16.4%<br />
13.0%<br />
1948<br />
15.3%<br />
1950<br />
1952<br />
Post-war<br />
1954<br />
1956<br />
1958<br />
1960<br />
1962<br />
1964<br />
1966<br />
Total Investments <strong>in</strong> <strong>Brazil</strong> as a % of GDP<br />
<strong>Private</strong><br />
16.1% 15.9% 16.4%<br />
12.6% 13.5% 13.2%<br />
13.4%<br />
17.4%<br />
14.5%<br />
Public<br />
19.1%<br />
15.5%<br />
3.4% 2.7% 2.6% 2.7% 3.0% 2.9% 3.6% 4.3%<br />
<strong>Brazil</strong> GDP Evolution (YoY Change %)<br />
Economic miracle<br />
2002 2003 2004 2005 2006 2007 2008 2009 2010 2011E 2012E 2013E 2014E<br />
12.6%<br />
1968<br />
1970<br />
Sources (top left to bottom right): Instituto Brasileiro de Geografia e Estatística (IBGE) – 2010; M<strong>in</strong>istério da Fazenda; Fundação Getulio Vargas (FGV).<br />
1972<br />
1974<br />
1976<br />
1978<br />
1980<br />
1982<br />
Lost decade<br />
“Chicken hops”<br />
1984<br />
1986<br />
1988<br />
1990<br />
1992<br />
1994<br />
Middle & Lower Income Class as a % of Population <strong>in</strong> <strong>Brazil</strong><br />
1996<br />
1998<br />
Real Plan<br />
Total Middle Class (C Class) Lower Income Level (E Class)<br />
16.9%<br />
18.4%<br />
20.4%<br />
21.6%<br />
23.0%<br />
24.1%<br />
2000<br />
29% 30% 28% 24% 23% 21%<br />
2002<br />
2004<br />
2006<br />
18% 18%<br />
42% 42% 44% 46% 48% 50% 52% 53%<br />
2002 2003 2004 2005 2006 2007 2008 2009<br />
2008<br />
2010
Challenges<br />
Infrastructure<br />
Education<br />
Fiscal deficit<br />
Social security<br />
Labour laws<br />
Tax system<br />
Red tape<br />
In spite of <strong>Brazil</strong> s favourable<br />
position <strong>in</strong> the global scenario, there<br />
are still several deficiencies that<br />
prevent the economy from<br />
exp<strong>and</strong><strong>in</strong>g at a faster pace.<br />
8
Opportunities<br />
Growth: <strong>Brazil</strong> is now the 7 th largest<br />
economy <strong>in</strong> the world, 2014/5 to become<br />
the fifth <strong>in</strong> the global rank<strong>in</strong>g;<br />
Consolidated Democracy: political<br />
stability with +15 years of low <strong>in</strong>flation<br />
<strong>and</strong> economic growth.<br />
Emerg<strong>in</strong>g middle class: Over the past<br />
decade, +35 million <strong>Brazil</strong>ians have<br />
entered the middle class.<br />
Matur<strong>in</strong>g capital markets: BMF&Bovespa<br />
is now the 4th largest listed exchange <strong>in</strong><br />
the world. Exit opportunities for PE.<br />
Infrastructure: Great dem<strong>and</strong> for<br />
<strong>in</strong>frastructure will pull <strong>in</strong> new <strong>in</strong>vestments<br />
to almost all sectors. Estimates show that<br />
<strong>in</strong>vestments <strong>in</strong> <strong>in</strong>frastructure will jump<br />
from US$ 216 bi to US$ 1 tri by 2020.<br />
9
PE/VC <strong>in</strong> <strong>Brazil</strong> Timel<strong>in</strong>e<br />
1994-1998<br />
Real Plan<br />
CVM 209<br />
First cycle of<br />
PE/VC funds<br />
beg<strong>in</strong>s<br />
PE/VC fund<br />
<strong>in</strong>vestments<br />
dur<strong>in</strong>g the<br />
privatization<br />
period<br />
1999-2002<br />
Investments<br />
reduced<br />
due to currency<br />
devaluation,<br />
energy crises <strong>and</strong><br />
pre-electoral<br />
<strong>in</strong>security.<br />
A<strong>BVCA</strong>P is founded<br />
<strong>in</strong> 2000<br />
2003-08<br />
CVM 391<br />
New Bovespa<br />
Market<br />
BRIC thesis<br />
Acceleration of<br />
IPO process<br />
First PE/VC<br />
fund cycle<br />
ends<br />
2009-Today<br />
New PE/VC funds<br />
cycle beg<strong>in</strong>s<br />
More global GP<br />
players<br />
Consolidation of<br />
LP s participation<br />
Increas<strong>in</strong>g fund<br />
commitment<br />
through FINEP s<br />
Inovar Program<br />
10
<strong>Brazil</strong> PE/VC <strong>in</strong> Numbers<br />
Fundrais<strong>in</strong>g <strong>and</strong> Investment (US$m)<br />
6000<br />
5000<br />
4000<br />
3000<br />
2000<br />
1000<br />
270 321 480 474<br />
261 230<br />
120 158<br />
0<br />
Source: EMPEA.<br />
2098<br />
1342<br />
5285<br />
2510<br />
3589<br />
3020<br />
989 1078<br />
401<br />
4604<br />
3000<br />
977<br />
2002 2003 2004 2005 2006 2007 2008 2009 2010 1H<br />
2011<br />
Fundrais<strong>in</strong>g<br />
Investment<br />
INDUSTRY SNAPSHOT<br />
+ 90 <strong>Private</strong> <strong>Equity</strong> / <strong>Venture</strong><br />
<strong>Capital</strong> firms<br />
Diversified base of <strong>in</strong>vestors with<br />
top 20 pension funds,<br />
<strong>Brazil</strong>ian Development Bank,<br />
Innovation agency, HNW<br />
+500 portfolio companies<br />
currently managed <strong>and</strong> from 2005<br />
to 2009: 490 new / follow-on<br />
<strong>in</strong>vestments<br />
41 backed IPO’s (approx R$<br />
25.5 Billion) from 2004-2010<br />
11
Bus<strong>in</strong>ess Environment<br />
Source: LAVCA.<br />
12
<strong>Private</strong> <strong>Equity</strong> Funds (FIPs)<br />
Most usual <strong>in</strong>vestment vehicle <strong>in</strong><br />
<strong>Brazil</strong>.<br />
Closed-end <strong>in</strong>vestment funds<br />
(condom<strong>in</strong>ium) with the purpose of<br />
<strong>in</strong>vest<strong>in</strong>g <strong>in</strong> <strong>Brazil</strong>ian listed or non listed<br />
companies or even <strong>in</strong> other funds regulated<br />
by CVM (<strong>Brazil</strong>ian Security Commission);<br />
Key driver: Beneficial tax treatment <strong>in</strong><br />
<strong>Brazil</strong><br />
Requirements for tax exemption:<br />
• Comply with all CVM rules:<br />
• Ownership – Investors (along with related<br />
parties) must own less than 40% of FIP quotas.<br />
• Tax Haven – None of the <strong>in</strong>vestors should be <strong>in</strong><br />
a tax haven jurisdiction.<br />
Source: A<strong>BVCA</strong>P.<br />
Seller<br />
Target<br />
LLC 1 LLC 2 LLC 3<br />
<strong>Equity</strong> <strong>Equity</strong><br />
FIP<br />
Hold Co<br />
S/A<br />
<strong>Equity</strong><br />
Debt<br />
<strong>Equity</strong><br />
<strong>Brazil</strong><br />
13<br />
US
A<strong>BVCA</strong>P<br />
The <strong>Brazil</strong>ian PE&VC Association was founded <strong>in</strong> 2000 to promote <strong>and</strong><br />
develop long-term <strong>in</strong>vestments <strong>in</strong> <strong>Brazil</strong>.<br />
More than 170 members, (90 <strong>Private</strong> <strong>Equity</strong> / <strong>Venture</strong> <strong>Capital</strong> firms<br />
<strong>in</strong>clud<strong>in</strong>g local <strong>and</strong> <strong>in</strong>ternational managers), major <strong>in</strong>stitutional LP <strong>and</strong><br />
service providers.<br />
Mutual Cooperation Agreements: A<strong>BVCA</strong>P has strong partnerships with<br />
sister-associations, exp<strong>and</strong><strong>in</strong>g.<br />
Partnerships with Key Stakeholders: A<strong>BVCA</strong>P works closely with important<br />
global, regional <strong>and</strong> local entities to promote long-term <strong>in</strong>vestments <strong>in</strong> the<br />
<strong>Brazil</strong> Some of these partnerships <strong>in</strong>clude:<br />
• ApexBrasil, IDB (MIF), ABDI, F<strong>in</strong>ep <strong>and</strong> BMF&Bovespa.<br />
14
Priorities<br />
Advocacy &<br />
Institutional<br />
Position<strong>in</strong>g<br />
Regulation &<br />
Development<br />
Pillars for Development<br />
Data Base &<br />
Knowledgement<br />
Compliance<br />
<strong>and</strong> Best<br />
Practices<br />
Resources Coordenation<br />
<strong>Brazil</strong>ian PE <strong>in</strong>dustry strengthen<strong>in</strong>g<br />
A<strong>BVCA</strong>P<br />
Integration<br />
<strong>and</strong><br />
Sustentability<br />
15
A<strong>BVCA</strong>P s Executive Committees<br />
Institutional Investors Committee: The IIC aims to underst<strong>and</strong> <strong>and</strong> br<strong>in</strong>g<br />
the needs of these <strong>in</strong>vestors <strong>and</strong> those of other private equity <strong>and</strong> venture<br />
capital <strong>in</strong>dustry players.<br />
Regulatory Committee: Review <strong>and</strong> improve the <strong>in</strong>dustry regulation. •<br />
Implement the auto-regulation code of conduct for the private equity <strong>and</strong><br />
venture capital <strong>in</strong>dustry; Reduce adm<strong>in</strong>istrative costs <strong>and</strong> <strong>in</strong>crease the<br />
efficiency for fund formation.<br />
Entrepreneurship, Innovation <strong>and</strong> Seed <strong>Capital</strong> Committee: Foment the<br />
capitalization of entrepreneurial <strong>in</strong>itiatives that are aligned with corporate<br />
governance practices <strong>and</strong> promote synergy with the venture capital<br />
segment of the <strong>in</strong>dustry.<br />
Governance <strong>and</strong> F<strong>in</strong>ance Committee: The Governance <strong>and</strong> F<strong>in</strong>ance<br />
Committee aims to assist <strong>and</strong> guide the Board of Directors <strong>in</strong> their<br />
statutory responsibilities regard<strong>in</strong>g A<strong>BVCA</strong>P’s best corporate governance<br />
practices <strong>and</strong> adm<strong>in</strong>istrative <strong>and</strong> f<strong>in</strong>ancial procedures.<br />
Infrastructure Committee: Increase <strong>in</strong>vestment to the <strong>in</strong>frastructure<br />
sector.<br />
16
A<strong>BVCA</strong>P Data<br />
Benefits:<br />
Data accuracy<br />
Transparency<br />
Enable quantification <strong>and</strong> monitor<strong>in</strong>g<br />
with<strong>in</strong> the <strong>in</strong>dustry<br />
Promote credibility <strong>and</strong> st<strong>and</strong>ardization<br />
of practices <strong>and</strong> processes<br />
Activity <strong>and</strong> performance to be measured<br />
Better “sell” of the <strong>in</strong>dustry <strong>in</strong> terms of<br />
job creation, taxes <strong>and</strong> wealth<br />
17
A<strong>BVCA</strong>P: New Onl<strong>in</strong>e Directory<br />
In 2010, we published the first guide to the lead<strong>in</strong>g players <strong>in</strong> <strong>Brazil</strong> s<br />
PE/VC. In 2011, we will enhance this service <strong>and</strong> launch the first ever,<br />
<strong>in</strong>teractive, onl<strong>in</strong>e platform to provide users with <strong>in</strong>-depth details about<br />
the <strong>Brazil</strong>ian <strong>in</strong>dustry.<br />
Pr<strong>in</strong>t version<br />
New Onl<strong>in</strong>e Version<br />
18
Thank you!<br />
Sidney Chameh<br />
Chairman, A<strong>BVCA</strong>P<br />
presidente@abvcap.com.br<br />
www.abvcap.com.br<br />
19
In partnership with<br />
<strong>Private</strong> <strong>Equity</strong> <strong>and</strong><br />
<strong>Venture</strong> <strong>Capital</strong> <strong>in</strong> <strong>Brazil</strong><br />
In partnership with<br />
In association with Offshore jurisdiction<br />
sponsor<br />
Support<strong>in</strong>g sponsor
International<br />
Series <strong>Brazil</strong><br />
Secular Trends <strong>and</strong><br />
Foreign Shocks<br />
Assess<strong>in</strong>g their impact on<br />
<strong>in</strong>vestments <strong>in</strong> <strong>Brazil</strong><br />
Luis Fern<strong>and</strong>o Lopes<br />
CEO Patria Investments UK, Patria Investmentos<br />
In partnership with
S T R I C T L Y P R I V A T E A N D C O N F I D E N T I A L<br />
22549-d-092308<br />
“Secular trends <strong>and</strong> foreign shocks: assess<strong>in</strong>g<br />
their impact on <strong>in</strong>vestments <strong>in</strong> <strong>Brazil</strong>”<br />
November 2011
22549-d-092308<br />
Important Notice<br />
Any recipient of this presentation (the “Presentation”) must: (a) Limit the recipients of copies of the presentation or summaries of its content to a limited number of colleagues at<br />
his or her firm solely on a “need to know” basis; (b) Under no circumstances give the Presentation, copies thereof, or summaries of its contents, nor provide any <strong>in</strong>formation<br />
conta<strong>in</strong>ed <strong>in</strong> it, to any person outside one’s firm; (c) Require colleagues who are <strong>in</strong> receipt of the Presentation or summaries thereof to comply with the requests set forth <strong>in</strong> the<br />
preced<strong>in</strong>g clauses (a) <strong>and</strong> (b).<br />
The follow<strong>in</strong>g Presentation is be<strong>in</strong>g provided to certa<strong>in</strong> selected <strong>in</strong>stitutional <strong>and</strong> sophisticated <strong>in</strong>vestors <strong>in</strong> one-on-one presentations on a confidential basis for <strong>in</strong>formational<br />
<strong>and</strong> discussion purposes only <strong>and</strong> does not constitute an offer to sell or a solicitation of an offer to purchase an <strong>in</strong>terest <strong>in</strong> any current or future <strong>in</strong>vestment vehicle sponsored by<br />
Patria Investimentos S.A. or its affiliates, <strong>in</strong>clud<strong>in</strong>g its predecessor Banco Patrimonio de Investimento S.A. <strong>and</strong> its activities, where applicable (“Patria”). Any such offer or<br />
solicitation shall be made only pursuant to a confidential private placement memor<strong>and</strong>um for the relevant fund which supersedes <strong>and</strong> qualifies <strong>in</strong> its entirety all the <strong>in</strong>formation<br />
set forth <strong>in</strong> this Presentation. This Presentation does not constitute a part of the Memor<strong>and</strong>um <strong>and</strong> recipients should not construe the contents of this Presentation as f<strong>in</strong>ancial,<br />
legal, account<strong>in</strong>g, tax or <strong>in</strong>vestment advice.<br />
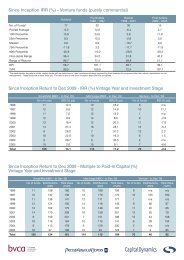
In consider<strong>in</strong>g the performance <strong>in</strong>formation conta<strong>in</strong>ed here<strong>in</strong>, recipients should bear <strong>in</strong> m<strong>in</strong>d that past performance is not necessarily <strong>in</strong>dicative of future results, <strong>and</strong> there can<br />
be no assurance unrealized return projections will be met. Unless otherwise <strong>in</strong>dicated, all <strong>in</strong>ternal rates of return <strong>and</strong> multiples of <strong>in</strong>vested capital are presented on a “gross”<br />
basis (i.e., they do not reflect management fees, “carried <strong>in</strong>terest,” taxes, transactions costs <strong>and</strong> other expenses borne by <strong>in</strong>vestors, which reduce returns <strong>and</strong>, <strong>in</strong> the aggregate,<br />
may be substantial). Any such Gross MOIs used here<strong>in</strong> represent the total value (realized or unrealized) of an <strong>in</strong>vestor’s <strong>in</strong>vestment as a multiple of <strong>in</strong>vested capital prior to the<br />
payment of any expenses. “Gross IRR” <strong>and</strong> “Net IRR” shall mean an aggregate, annual, compound, gross or net, as applicable, <strong>in</strong>ternal rate of return on <strong>in</strong>vestments,<br />
calculated based on daily <strong>in</strong>vestment <strong>in</strong>flows <strong>and</strong> outflows, with the returns reported on an annual basis. Gross leveraged IRRs present the gross annual <strong>in</strong>ternal rate of return<br />
after the effects of debt f<strong>in</strong>anc<strong>in</strong>g (at either the fund or asset level) is taken <strong>in</strong>to consideration. Net IRRs are after all management fees, carried <strong>in</strong>terest, transaction costs <strong>and</strong><br />
other expenses (other than taxes borne or to be borne by <strong>in</strong>vestors, <strong>and</strong> are generally substantially lower. Net leveraged IRRs present the net annual <strong>in</strong>ternal rate of return to<br />
the <strong>in</strong>vestor after the effects of debt f<strong>in</strong>anc<strong>in</strong>g (at either the fund or property level) is taken <strong>in</strong>to consideration. A hypothetical illustration of the effect of carried <strong>in</strong>terest,<br />
transactions costs <strong>and</strong> other expenses on “Gross IRRs” <strong>and</strong> “Gross MOIs” is available upon request. Projections <strong>and</strong>/or future unrealized values of currently unrealized<br />
<strong>in</strong>vestments will depend on, among other factors, future operat<strong>in</strong>g results, the value of the assets <strong>and</strong> market <strong>and</strong> other conditions at the time of disposition, legal <strong>and</strong><br />
contractual restrictions on transfer that may limit liquidity, any related transaction costs <strong>and</strong> the tim<strong>in</strong>g <strong>and</strong> manner of sale, all of which may differ from the assumptions <strong>and</strong><br />
circumstances on which current unrealized valuations are based <strong>and</strong> many of which are difficult to predict <strong>and</strong> are beyond Patria’s control. Furthermore, the global economy,<br />
<strong>in</strong>clud<strong>in</strong>g <strong>in</strong> <strong>Brazil</strong>, has recently experienced periods of significant market volatility. If these unrealized <strong>in</strong>vestments were to be liquidated under current market conditions, the<br />
values obta<strong>in</strong>ed could be, with respect to such <strong>in</strong>vestments, materially lower than those <strong>in</strong>dicated <strong>in</strong> the projected returns shown. Accord<strong>in</strong>gly, the actual realized returns on<br />
unrealized <strong>in</strong>vestments may differ materially from the returns <strong>in</strong>dicated here<strong>in</strong>. Moreover, certa<strong>in</strong> <strong>in</strong>formation here<strong>in</strong> is presented <strong>in</strong> U.S. dollars, however Patria’s <strong>in</strong>vestments<br />
generally are denom<strong>in</strong>ated <strong>in</strong> Reais <strong>and</strong> hence a portion of the value of unrealized <strong>in</strong>vestments will depend on the relative strength or weakness of the U.S. dollar to the Real.<br />
Unrealized returns are not to be relied upon as facts <strong>and</strong> there can be no assurance that such results will be achieved.<br />
Certa<strong>in</strong> of the past performance <strong>in</strong>formation, selected examples <strong>and</strong> case studies presented here<strong>in</strong> may not be representative of all transactions of a given type or of Patria’s<br />
<strong>in</strong>vestments generally. The <strong>in</strong>vestment strategy, size <strong>and</strong> type of <strong>in</strong>vestments with respect to which such past performance <strong>in</strong>formation relates may differ <strong>in</strong> one or more respects<br />
from the <strong>in</strong>vestment strategy generally employed by Patria’s <strong>Private</strong> <strong>Equity</strong> Group <strong>and</strong> the results of certa<strong>in</strong> past performance set forth here<strong>in</strong>, may be attributable to the<br />
activities of <strong>in</strong>vestment professionals that do not participate <strong>in</strong> Patria’s <strong>Private</strong> <strong>Equity</strong> Group.<br />
Certa<strong>in</strong> <strong>in</strong>formation conta<strong>in</strong>ed <strong>in</strong> this Presentation constitutes “forward-look<strong>in</strong>g statements,” which can be identified by the use of forward-look<strong>in</strong>g term<strong>in</strong>ology such as “may,”<br />
“will,” “should,” “expect,” “anticipate,” “target,” “project,” “estimate,” “<strong>in</strong>tend,” “cont<strong>in</strong>ue” or “believe,” or the negatives thereof or other variations thereon or comparable<br />
term<strong>in</strong>ology. Due to various risks <strong>and</strong> uncerta<strong>in</strong>ties, actual events or results or the actual performance of any fund or <strong>in</strong>vestment discussed here<strong>in</strong> may differ materially from<br />
those reflected or contemplated <strong>in</strong> such forward-look<strong>in</strong>g statements. Any projections, market outlooks or estimates <strong>in</strong> this Presentation are forward-look<strong>in</strong>g statements <strong>and</strong> are<br />
based upon certa<strong>in</strong> assumptions. Other events which were not taken <strong>in</strong>to account may occur <strong>and</strong> may significantly affect any fund or <strong>in</strong>vestment discussed here<strong>in</strong>. Any<br />
outlooks <strong>and</strong> assumptions should not be construed to be <strong>in</strong>dicative of the actual events which will occur.<br />
Certa<strong>in</strong> <strong>in</strong>formation conta<strong>in</strong>ed here<strong>in</strong> (<strong>in</strong>clud<strong>in</strong>g targets, forward-look<strong>in</strong>g statements, economic <strong>and</strong> market <strong>in</strong>formation <strong>and</strong> portfolio company data) has been obta<strong>in</strong>ed from<br />
published sources <strong>and</strong>/or prepared by third parties (<strong>in</strong>clud<strong>in</strong>g portfolio companies) <strong>and</strong> <strong>in</strong> certa<strong>in</strong> cases has not been updated through the date hereof. While such sources<br />
are believed to be reliable for the purpose used here<strong>in</strong>, none of Patria or any of its directors, officers, employees, partners, members, shareholders or affiliates, or any other<br />
person assumes any responsibility for the accuracy or completeness of such <strong>in</strong>formation.<br />
Patria does not have any obligation to update the <strong>in</strong>formation conta<strong>in</strong>ed here<strong>in</strong>.<br />
23
22549-d-092308<br />
Three fundamental issues that drive <strong>in</strong>vestment <strong>in</strong> <strong>Brazil</strong><br />
I. The widen<strong>in</strong>g growth gap between emerg<strong>in</strong>g <strong>and</strong> developed economies<br />
II. <strong>Brazil</strong>: domestic market oriented but with an edge on commodities<br />
III. Challenges <strong>and</strong> opportunities:<br />
An underleveraged economy<br />
Subpar <strong>in</strong>vestment spend<strong>in</strong>g<br />
Highly volatile asset prices<br />
IV. Foreign environment: foe or friend?<br />
V. Historical data <strong>and</strong> forecasts<br />
24
I. The widen<strong>in</strong>g growth gap between emerg<strong>in</strong>g <strong>and</strong><br />
developed economies<br />
There was a secular change <strong>in</strong> the world l<strong>and</strong>scape<br />
before the f<strong>in</strong>ancial crash of 2007-08.<br />
The share of emerg<strong>in</strong>g economies <strong>in</strong> global GDP was<br />
ris<strong>in</strong>g steadily ow<strong>in</strong>g to their much higher growth pace.<br />
Recent evidence suggests that growth differential <strong>in</strong><br />
favor of emerg<strong>in</strong>g economies has widened further.<br />
Participation of emerg<strong>in</strong>g markets <strong>in</strong> global <strong>in</strong>vestors’<br />
portfolio is a small fraction of their share <strong>in</strong> global growth.<br />
<strong>Capital</strong> flows <strong>and</strong> f<strong>in</strong>ancial wealth are <strong>in</strong>creas<strong>in</strong>gly<br />
gravitat<strong>in</strong>g around emerg<strong>in</strong>g economies.<br />
22549-d-092308<br />
Emerg<strong>in</strong>g markets: net capital flows <strong>and</strong> reserves<br />
800<br />
600<br />
400<br />
200<br />
0<br />
US$ billion per year US$ billion per year<br />
-200<br />
1980 1984 1988 1992 1996 2000 2004 2008<br />
Net capital flows (left)<br />
Change <strong>in</strong> <strong>in</strong>ternational reserves (right)<br />
Source: International F<strong>in</strong>ancial Statistics (FMI).<br />
1,500<br />
1,200<br />
900<br />
600<br />
300<br />
0<br />
-300<br />
10<br />
8<br />
6<br />
4<br />
2<br />
0<br />
-2<br />
Real GDP growth<br />
Real GDP growth per year; % Forecast<br />
-4<br />
1980 1984 1988 1992 1996 2000 2004 2008 2012 2016<br />
Advanced economies Emerg<strong>in</strong>g markets<br />
Source: International F<strong>in</strong>ancial Statistics (FMI).<br />
Participation <strong>in</strong> global GDP (adjusted for PPP)<br />
Share<br />
Forecast<br />
100%<br />
80%<br />
60%<br />
40%<br />
20%<br />
0%<br />
1980 1984 1988 1992 1996 2000 2004 2008 2012 2016<br />
Advanced economies Emerg<strong>in</strong>g markets<br />
Source: International F<strong>in</strong>ancial Statistics (FMI).<br />
25
II. <strong>Brazil</strong>: domestic market oriented but with an edge on<br />
commodities<br />
22549-d-092308<br />
Cont<strong>in</strong>ental dimensions: 8.5 million km 2 ; GDP of R$3.7<br />
trillion (US$2.1 trillion); 191 million <strong>in</strong>habitants with median<br />
age of 29 years; urbanization rate = 87%.<br />
Pattern of aggregate expenditure reveals an <strong>in</strong>wardoriented<br />
economy (data as of 2010):<br />
Household consumption = 61% of GDP<br />
Government consumption = 21%<br />
Gross fixed capital formation = 19%<br />
<br />
<br />
Exports goods & services = 11%<br />
Imports goods & services = -12%<br />
Net = -1%<br />
Local drivers set the pace of economic activity over the<br />
long haul <strong>and</strong> foreign factors generate fluctuations<br />
around this primary trend.<br />
12<br />
10<br />
8<br />
6<br />
4<br />
2<br />
0<br />
-2<br />
-4<br />
GDP x domestic absorption x foreign dem<strong>and</strong><br />
Accum. 12-m chg. % Accum. 12-m chg. %<br />
Domestic absorption avg. 2000-09: 97% of GDP growth<br />
Foreign dem<strong>and</strong> avg. 2000-09: 3% of GDP growth<br />
2000 2001 2002 2003 2004 2005 2006 2007 2008 2009 2010 2011<br />
Contribution of foreign dem<strong>and</strong> Contribution of domestic absorption GDP<br />
Source: IBGE <strong>and</strong> Pátria Investimentos.<br />
12<br />
10<br />
8<br />
6<br />
4<br />
2<br />
0<br />
-2<br />
-4<br />
Exports goods & services to GDP (2010)<br />
<strong>Brazil</strong><br />
Advanced countries<br />
World<br />
Emerg<strong>in</strong>g<br />
Euro area<br />
New Ind. Asia<br />
Source: International F<strong>in</strong>ancial Statistics (IMF).<br />
90%<br />
70%<br />
50%<br />
30%<br />
0 20 40 60 80 100<br />
% of GDP<br />
GDP breakdown by expenditure up to 2010<br />
Share <strong>in</strong> GDP<br />
3.9% 3.6% 2.9% 1.5% 0.2%<br />
17.1% 16.2% 16.8% 18.3% 20.7% 16.5% 19.2%<br />
19.2% 19.9% 20.0% 20.3% 20.2%<br />
21.8% 21.2%<br />
59.8% 60.3% 60.3% 59.9% 58.9% 61.7% 60.6%<br />
10%<br />
-0.1%<br />
-10% 2004 2005 2006 2007 2008 2009<br />
-1.0%<br />
2010<br />
Household consumption Government consumption<br />
GFKF** Net exports<br />
Note (*): Gross Fixed capital Formation = <strong>in</strong>vestment spend<strong>in</strong>g.<br />
Source: IBGE.<br />
26
II. <strong>Brazil</strong>: domestic market oriented but with an edge on<br />
commodities<br />
<strong>Brazil</strong> is a very diversified economy with prom<strong>in</strong>ence of<br />
activities centered on the domestic market <strong>and</strong> the<br />
edge on commodities is a plus to this dynamic.<br />
Fundamental trend: decrease <strong>in</strong> <strong>in</strong>come <strong>in</strong>equality <strong>and</strong><br />
absolute poverty s<strong>in</strong>ce stabilization <strong>in</strong> the mid-90’s<br />
S<strong>in</strong>ce 1993, 60 million left poverty <strong>and</strong> were <strong>in</strong>corporated<br />
<strong>in</strong>to middle class ranks; 66% of this improvement derives<br />
from market factors.<br />
<strong>Brazil</strong> has become a medium class country, 55% of<br />
population, where households report <strong>in</strong>come up to<br />
US$33,000 per year.<br />
22549-d-092308<br />
Per capita <strong>in</strong>come ga<strong>in</strong> by social bracket 2001-09<br />
80<br />
Accumulated change %<br />
70 69<br />
60<br />
50<br />
40<br />
30<br />
61<br />
56<br />
51<br />
46<br />
43<br />
35<br />
29<br />
20<br />
10<br />
21<br />
13<br />
0<br />
E2 E1 D2 D1 C2 C1 B2 B1 A2 A1<br />
Very poor/poor Middle class Wealthy<br />
Source: Source: Neri, M. (2010) - “The New Middle Class <strong>in</strong> <strong>Brazil</strong> – The<br />
Bright Side of the Poor”, FGV-CPS, Rio de Janeiro.<br />
Smaller x Greater <strong>in</strong>equality<br />
Income <strong>in</strong>equality <strong>and</strong> absolute poverty <strong>in</strong> <strong>Brazil</strong><br />
100<br />
80<br />
60<br />
40<br />
20<br />
0<br />
0.62<br />
0.60<br />
0.58<br />
0.56<br />
0.54<br />
0.52<br />
% of total population<br />
6 8 8 8 9 10 10 11 12 12<br />
31<br />
63<br />
G<strong>in</strong>i <strong>in</strong>dex % of population<br />
0<br />
1995 1997 1999 2002 2004 2006 2008 2010*<br />
Inequality (left) Poverty (right)<br />
Note(*): prelim<strong>in</strong>ary.<br />
Source: Instituto de Pesquisa Econômica e Aplicada (IPEA).<br />
Evolution of social classes <strong>in</strong> <strong>Brazil</strong><br />
38 40 42 45 47 49 50<br />
54 55<br />
55 53 50 46 43 40 39 34 33<br />
1993 2003 2004 2005 2006 2007 2008 2009 2010 2011<br />
Very Poor/Poor: up to US$640/month Middle Class: US$640 to 2.750/month<br />
Wealthy: More than US$2.750/month<br />
Source: Neri, M.C. (2011) – “Os Emergentes dos Emergentes: Reflexões Globais e<br />
Ações Locais para a Nova Classe Média Brasileira”, FGV-IBRE, CPS, Rio de Janeiro.<br />
18<br />
15<br />
12<br />
9<br />
6<br />
3<br />
27
II. <strong>Brazil</strong>: domestic market oriented but with an edge on<br />
commodities<br />
<strong>Brazil</strong> is a resource rich country, with a competitive edge<br />
<strong>in</strong> the production of several commodities.<br />
Gra<strong>in</strong>s, m<strong>in</strong>erals <strong>and</strong> animal prote<strong>in</strong>s are a dependable<br />
source of export receipts <strong>and</strong> hard currency <strong>in</strong>flows.<br />
More importantly, abundant commodities provide a low<br />
cost supply of raw materials for the local <strong>in</strong>dustry.<br />
Commodity dom<strong>in</strong>ate <strong>Brazil</strong>ian stock market <strong>in</strong>dices<br />
( 40%) but services account for over 60% of GDP.<br />
22549-d-092308<br />
1. Saudi Arabia<br />
2. Venezuela<br />
3. Iran<br />
4. Iraq<br />
5. Kuwait<br />
6. UAE<br />
<strong>Brazil</strong> (Pre-Salt)<br />
7. Russia<br />
8. Libya<br />
9. Kazakhstan<br />
10. Nigeria<br />
11. Canada<br />
12. United States<br />
13. Qatar<br />
14. Ch<strong>in</strong>a<br />
15. <strong>Brazil</strong><br />
16. Angola<br />
17. Algeria<br />
18. Mexico<br />
19. Azerbaijan<br />
20. Norway<br />
World’s proven oil reserves (2010)<br />
Billion boe<br />
0 50 100 150 200 250 300<br />
Source: BP Statistical Review of World Energy June 2011.<br />
<strong>Brazil</strong>’s production of agricultural commodities (2010-11)<br />
50<br />
40<br />
30<br />
20<br />
10<br />
0<br />
50<br />
40<br />
30<br />
20<br />
10<br />
0<br />
% of world production<br />
World major exporters of animal prote<strong>in</strong> (2010)<br />
% of world exports<br />
Source: U.S.D.A.<br />
40 38<br />
36 34<br />
20<br />
13<br />
33<br />
Coffee Orange Ethanol Soybeans Sugar<br />
Source: U.S.D.A.<br />
<strong>Brazil</strong> U.S. E.U. Australia<br />
11<br />
29<br />
4<br />
Poultry meat Beef<br />
0<br />
24<br />
18<br />
28
9<br />
6<br />
3<br />
0<br />
-3<br />
-6<br />
-9<br />
-12<br />
-15<br />
22549-d-092308<br />
III. Challenges <strong>and</strong> opportunities<br />
<strong>Brazil</strong> entered the global recession very late <strong>and</strong><br />
bounced back quickly.<br />
Activity exp<strong>and</strong>ed until 1H11 <strong>and</strong> is now slow<strong>in</strong>g down<br />
ow<strong>in</strong>g mostly to previous monetary <strong>and</strong> credit tighten<strong>in</strong>g.<br />
There are structural deficiencies that play an important<br />
role <strong>in</strong> <strong>Brazil</strong>’s bus<strong>in</strong>ess cycles over the long haul:<br />
lack of credit <strong>and</strong> <strong>in</strong>dustry fragmentation<br />
modest <strong>in</strong>vestment spend<strong>in</strong>g<br />
high asset price volatility<br />
Real wage ga<strong>in</strong>s x unemployment <strong>in</strong> <strong>Brazil</strong><br />
% 3-m/3-m oya<br />
-18<br />
2004 2005 2006 2007 2008 2009 2010 2011<br />
Source: IBGE.<br />
% of labor force<br />
Avg. real earn<strong>in</strong>gs (left) Unemployment (right)<br />
14<br />
13<br />
12<br />
11<br />
10<br />
9<br />
8<br />
7<br />
6<br />
5<br />
25<br />
20<br />
15<br />
10<br />
5<br />
0<br />
% 3-m/3-m oya % 3-m/3-m oya<br />
-5<br />
2004 2005 2006 2007 2008 2009 2010 2011<br />
Source: IBGE.<br />
Real retail sales <strong>and</strong> credit <strong>in</strong> <strong>Brazil</strong><br />
Broad retail Credit outstad<strong>in</strong>g<br />
UPC & bus<strong>in</strong>ess confidence <strong>in</strong> the <strong>Brazil</strong>ian <strong>in</strong>dustry<br />
90<br />
85<br />
80<br />
75<br />
% of total Index<br />
UPC<br />
Last = 83.5%<br />
Máx = 86.7%<br />
Avg. 2005-08 = 84.2%<br />
70<br />
2004 2005 2006 2007 2008 2009 2010 2011<br />
Plant capacity (left) Bus<strong>in</strong>ess confidence (right)<br />
Note(*): UPC st<strong>and</strong>s for utilization of plant capacity.<br />
Source: Fundação Getulio Vargas.<br />
25<br />
20<br />
15<br />
10<br />
5<br />
0<br />
90<br />
80<br />
70<br />
60<br />
50<br />
-5<br />
130<br />
120<br />
110<br />
100<br />
29
III. Challenges <strong>and</strong> opportunities:<br />
an underleveraged economy<br />
Credit to GDP ratio <strong>in</strong> <strong>Brazil</strong> is 48%, well below the level<br />
portrayed by middle-<strong>in</strong>come countries (at around 60%).<br />
Long term f<strong>in</strong>anc<strong>in</strong>g is <strong>in</strong>sufficient; most medium <strong>and</strong><br />
small firms have very <strong>in</strong>efficient capital structures.<br />
Opportunity: scarcity of capital implies very high IRRs for<br />
<strong>in</strong>vestment without leverag<strong>in</strong>g.<br />
Opportunity: <strong>in</strong>adequate capital structures entail <strong>in</strong>dustry<br />
fragmentation <strong>and</strong> fertile ground for consolidation.<br />
Opportunity: elementary f<strong>in</strong>ancial <strong>in</strong>struments (e.g.<br />
mortgage) are still <strong>in</strong> their <strong>in</strong>fancy.<br />
22549-d-092308<br />
Outst<strong>and</strong><strong>in</strong>g credit to GDP (2009)<br />
Source: Bradesco Economic letter dated 5-Apr-2011.<br />
70<br />
60<br />
50<br />
40<br />
30<br />
20<br />
10<br />
Volume of credit <strong>and</strong> <strong>in</strong>terest rates charged<br />
% per year<br />
0<br />
2004 2005 2006 2007 2008 2009 2010 2011<br />
Source: Banco Central do Brasil.<br />
Avg. rate charged on firms<br />
Avg. rate charged on <strong>in</strong>dividuals<br />
Average size of 50 largest firms (selected <strong>in</strong>dicators)<br />
Total Assets to GDP<br />
(%)<br />
<strong>Capital</strong> to GDP (%)<br />
Developed economies 0.979 0.375<br />
Develop<strong>in</strong>g ex-Lat<strong>in</strong><br />
America<br />
0.972 0.466<br />
Lat<strong>in</strong> America 0.472 0.269<br />
<strong>Brazil</strong> 0.414 0.188<br />
Source: Herrera A. M. & Lora, E. (2005): “Why So Small? Expla<strong>in</strong><strong>in</strong>g the<br />
Size of Firms <strong>in</strong> Lat<strong>in</strong> America”, Inter-american Development Bank.<br />
30
III. Challenges <strong>and</strong> opportunities:<br />
subpar <strong>in</strong>vestment spend<strong>in</strong>g<br />
In spite of a very successful macroeconomic story, <strong>Brazil</strong><br />
still reports modest <strong>in</strong>vestment spend<strong>in</strong>g.<br />
Any upbeat tone of the economy rapidly raises utilization<br />
of capacity to maximum <strong>and</strong> triggers <strong>in</strong>flation pressures.<br />
Opportunity: attractive greenfield <strong>and</strong> brownfield<br />
<strong>in</strong>vestment projects are plentiful.<br />
Opportunity: tight fiscal policy needed to tackle <strong>in</strong>flation<br />
restra<strong>in</strong>s federal spend<strong>in</strong>g.<br />
22549-d-092308<br />
The government needs to attract private CAPEX to complement<br />
its <strong>in</strong>vestment programs <strong>and</strong> will have to adopt a more market<br />
friendly approach towards local <strong>and</strong> foreign <strong>in</strong>vestors<br />
U.S.<br />
Australia<br />
S<strong>in</strong>gapore<br />
Russia<br />
Greece<br />
Chile<br />
Ch<strong>in</strong>a<br />
<strong>Brazil</strong><br />
Electric power consumption<br />
kWh per capita per year<br />
Norway<br />
0 5,000 10,000 15,000 20,000 25,000<br />
Source: World Bank Development Report 2010.<br />
Gross fixed capital formation (<strong>in</strong>vestment) compared<br />
35<br />
30<br />
25<br />
20<br />
15<br />
10<br />
5<br />
% to GDP<br />
0<br />
1995 1997 1999 2001 2003 2005 2007 2009<br />
<strong>Brazil</strong> World Emerg<strong>in</strong>g Markets<br />
Note(*): estimate.<br />
Source: International F<strong>in</strong>ancial Statistics (IMF).<br />
“Do<strong>in</strong>g Bus<strong>in</strong>ess” rank<strong>in</strong>g of competitiveness (1 to 183)<br />
1. S<strong>in</strong>gapore<br />
2. Hong Kong<br />
3. New Zeal<strong>and</strong><br />
4. U.S.<br />
91. Ch<strong>in</strong>a<br />
120. Russia<br />
126. <strong>Brazil</strong><br />
132. India<br />
Source: World Bank.<br />
31
III. Challenges <strong>and</strong> opportunities:<br />
highly volatile asset prices<br />
Globalization caused foreign capital flows to gradually<br />
comm<strong>and</strong> the prices of liquid <strong>Brazil</strong>ian assets.<br />
The prom<strong>in</strong>ence of short term, unstable portfolio<br />
<strong>in</strong>vestment entails high volatility of asset prices.<br />
Opportunity: asset volatility is much higher than it should<br />
be as long as economic fundamentals are concerned<br />
Opportunity: anti-cyclical behavior pays off h<strong>and</strong>somely<br />
60<br />
55<br />
50<br />
45<br />
40<br />
35<br />
30<br />
22549-d-092308<br />
Bullish tone divestment + capital rais<strong>in</strong>g<br />
Sour sentiment capital deployment<br />
2000<br />
Net fiscal debt <strong>and</strong> external <strong>in</strong>debtedness<br />
% of GDP % of GDP<br />
2001<br />
2002<br />
2003<br />
2004<br />
2005<br />
2006<br />
2007<br />
2008<br />
2009<br />
2010<br />
Public debt (left) Foreign debt (right)<br />
Source: Banco Central do Brasil.<br />
2011<br />
35<br />
30<br />
25<br />
20<br />
15<br />
10<br />
5<br />
0<br />
-5<br />
90<br />
75<br />
60<br />
45<br />
30<br />
15<br />
0<br />
-15<br />
<strong>Brazil</strong>: net FDI <strong>and</strong> foreign portfolio <strong>in</strong>vestment<br />
2000<br />
US$ Billion 12-m US$ Billion 12-m<br />
2001<br />
2002<br />
2003<br />
2004<br />
2005<br />
2006<br />
2007<br />
2008<br />
2009<br />
2010<br />
Short term portfolio Long term FDI<br />
Source: Banco Central do Brasil.<br />
4.00<br />
3.50<br />
3.00<br />
2.50<br />
2.00<br />
1.50<br />
1.00<br />
Source: Banco Central do Brasil <strong>and</strong> Patria Investimentos.<br />
2011<br />
Nom<strong>in</strong>al exchange rate x currency volatility<br />
2000<br />
R$ per US$ % change<br />
2001<br />
2002<br />
2003<br />
2004<br />
2005<br />
2006<br />
2007<br />
2008<br />
2009<br />
2010<br />
2011<br />
Avg.FX 00Q1 = R$1.77 per US$ Avg.FX 11Q3 = R$1.64 per US$<br />
Nom<strong>in</strong>al FX (left) FX changes (right)<br />
90<br />
75<br />
60<br />
45<br />
30<br />
15<br />
0<br />
-15<br />
20<br />
15<br />
10<br />
5<br />
0<br />
-5<br />
-10<br />
-15<br />
-20<br />
32
22549-d-092308<br />
IV. Foreign environment: foe or friend?<br />
Slower global growth negatively affects <strong>Brazil</strong> through two<br />
ma<strong>in</strong> channels:<br />
I. Trade balance (relevance = low)<br />
Gross exports account for a bit more than 10% of GDP<br />
Terms of trade for <strong>Brazil</strong> have been improv<strong>in</strong>g <strong>and</strong> surg<strong>in</strong>g<br />
FDI more than compensates for less vibrant exports<br />
II. Investment spend<strong>in</strong>g (relevance = moderate)<br />
<strong>Brazil</strong>’s aggregated CAPEX is quite volatile<br />
Adverse foreign shocks dent bus<strong>in</strong>ess confidence, lead<strong>in</strong>g<br />
to reduced <strong>in</strong>vestment spend<strong>in</strong>g <strong>and</strong> slower job creation<br />
There is a third channel of transmission of foreign shocks<br />
that may be activated <strong>in</strong> the case of global meltdown:<br />
III. Consumer purchas<strong>in</strong>g power (relevance = high)<br />
The unleveraged expansion of <strong>Brazil</strong>’s domestic<br />
consumption market highlights the importance of real<br />
disposable <strong>in</strong>come<br />
Adverse foreign shocks significantly affect activity if they<br />
erode real disposable <strong>in</strong>come over the longer term<br />
Cha<strong>in</strong> reaction: sharp currency depreciation higher<br />
<strong>in</strong>flation lower disposable <strong>in</strong>come weaker growth<br />
Most likely scenario: global jitters entail deceleration of<br />
<strong>Brazil</strong>’s real GDP growth to 3-4% <strong>in</strong> 2011-12.<br />
90<br />
75<br />
60<br />
45<br />
30<br />
15<br />
0<br />
<strong>Brazil</strong>: net FDI <strong>and</strong> terms of trade<br />
Source: Banco Central do Brasil.<br />
28<br />
24<br />
20<br />
16<br />
12<br />
8<br />
4<br />
0<br />
-4<br />
-8<br />
-12<br />
2000<br />
2000<br />
US$ Billion 12-m<br />
2001<br />
Investment spend<strong>in</strong>g x MSCI stock <strong>in</strong>dex<br />
2001<br />
2002<br />
2002<br />
2003<br />
2003<br />
2004<br />
2004<br />
2005<br />
2005<br />
2006<br />
% 12-m change % 12-m change<br />
2006<br />
2007<br />
2007<br />
2008<br />
2008<br />
2009<br />
2010<br />
Total CAPEX (left) MSCI <strong>Brazil</strong> (right)<br />
US$ Billion 12-m<br />
2009<br />
Source: Banco Central do Brasil <strong>and</strong> Patria Investimentos.<br />
2010<br />
Long term FDI (left) Trade balance (right)<br />
2011<br />
2011<br />
100<br />
75<br />
50<br />
25<br />
0<br />
0<br />
-25<br />
-50<br />
60<br />
50<br />
40<br />
30<br />
20<br />
10<br />
-10<br />
33
22549-d-092308<br />
V. Historical data <strong>and</strong> forecasts<br />
oya = over-year-ago<br />
aop = average-of-period<br />
eop = end-of-period<br />
1995-2005<br />
average<br />
2006 2007 2008 2009 2010 2011 2012<br />
World real growth %oya 3.6 5.0 4.9 2.8 -0.6 4.9 4.0 3.7 4.5<br />
Advanced economies real growth %oya 2.7 3.0 2.7 0.2 -3.4 3.0 2.0 1.8 2.4<br />
Emerg<strong>in</strong>g markets real growth %oya 5.1 8.2 8.8 6.1 2.7 7.3 6.4 6.1 6.7<br />
Sources: International Monetary Fund, IBGE, Banco Central do Brasil <strong>and</strong> Patria Investimentos (forecasts)<br />
2013-17<br />
average<br />
BRAZIL<br />
Nom<strong>in</strong>al GDP R$ billion 2,369 2,661 3,005 3,143 3,578 3,938 4,290<br />
Nom<strong>in</strong>al GDP US$ billion 1,072 1,314 1,639 1,579 2,034 2,394 2,510<br />
Real GDP %oya 2.6 4.0 6.1 5.2 -0.6 7.5 3.4 3.0 4.4<br />
Household consumption %oya 2.4 5.2 6.1 5.7 4.2 7.0 5.0 4.5 4.8<br />
Government outlays %oya 1.9 2.5 5.1 3.1 3.9 3.3 3.5 3.2 3.3<br />
Investment spend<strong>in</strong>g %oya 1.8 9.8 13.8 13.6 -10.3 21.8 9.0 8.1 8.9<br />
Exports of good & services %oya 8.0 5.0 6.2 0.6 -10.2 11.5 8.0 7.2 6.7<br />
Imports of good & services %oya 5.3 18.5 19.9 15.4 -11.5 36.2 25.0 22.5 7.3<br />
Consumer price <strong>in</strong>dex (IPCA) %Dec/Dec 7.4 3.1 4.5 5.9 4.3 5.9 6.5 5.7 4.5<br />
General price <strong>in</strong>dex (IGP-M) %Dec/Dec 10.7 3.8 7.8 9.8 -1.7 11.3 5.9 5.5 4.9<br />
Primary fiscal balance % of GDP 2.5 3.9 4.0 4.1 1.4 2.8 3.1 2.5 2.7<br />
Nom<strong>in</strong>al fiscal balance % of GDP -5.7 -3.0 -2.3 -1.5 -3.2 -2.6 -2.9 -3.1 -0.9<br />
Net public debt % of GDP 45.8 47.3 45.5 38.5 42.8 40.2 39.0 40.5 41.6<br />
Short term rate (CDI) % p.a. aop 21.9 15.1 12.0 12.5 9.9 10.0 11.7 10.5 9.0<br />
Real <strong>in</strong>terest rate (Selic/IPCA) % p.a. aop 13.6 11.6 7.2 6.3 5.4 3.9 4.9 4.5 4.3<br />
Trade balance US$ billion 10 46 40 25 25 20 31 22<br />
Exports US$ billion 66 138 161 198 153 202 251 264<br />
Imports US$ billion 56 91 121 173 128 182 220 242<br />
Current account US$ billion -14 14 2 -28 -24 -48 -47 -61<br />
Current account % of GDP -2.0 1.3 0.1 -1.7 -1.5 -2.3 -2.0 -2.4 -1.7<br />
Foreign direct <strong>in</strong>vestment US$ billion 20 19 35 45 26 48 70 50<br />
Gross <strong>in</strong>ternational reserves US$ billion eop 46 86 180 207 239 288 388 411<br />
Exchange rate R$ per US$ aop 2.06 2.18 1.93 1.83 1.99 1.76 1.64 1.71<br />
34
In partnership with<br />
<strong>Private</strong> <strong>Equity</strong> <strong>and</strong><br />
<strong>Venture</strong> <strong>Capital</strong> <strong>in</strong> <strong>Brazil</strong><br />
In partnership with<br />
In association with Offshore jurisdiction<br />
sponsor<br />
Support<strong>in</strong>g sponsor
International<br />
Series <strong>Brazil</strong><br />
Advantage <strong>and</strong><br />
Challenges of a<br />
Favourite<br />
As one of the most attractive<br />
dest<strong>in</strong>ations for PE/VC<br />
<strong>in</strong>vestments, how has the local<br />
scenario changed?<br />
How has the entrance of new<br />
<strong>in</strong>vestors impacted on the<br />
competition of deals,<br />
valuations, deal terms <strong>and</strong> co<strong>in</strong>vestments?<br />
In partnership with
International<br />
Series <strong>Brazil</strong><br />
Advantage <strong>and</strong><br />
Challenges of a<br />
Favourite<br />
Paulo Sérgio Gobbo Mar<strong>in</strong>s (Moderator)<br />
Head of Sales <strong>Brazil</strong> – Securities <strong>and</strong> Fund Services, Citi<br />
Eduardo Oliveira<br />
Partner, Grupo Stratus<br />
Gustavo Peixoto<br />
Investment Manager <strong>Private</strong> <strong>Equity</strong> Team, Grupo Sant<strong>and</strong>er<br />
Bob Stefanowski<br />
Chairman <strong>and</strong> Manag<strong>in</strong>g Partner, 3i Asia <strong>and</strong> the Americas<br />
In partnership with
International<br />
Series <strong>Brazil</strong><br />
<strong>Private</strong> <strong>Equity</strong> <strong>and</strong><br />
<strong>Venture</strong> <strong>Capital</strong><br />
<strong>Brazil</strong> Atlas<br />
Christiane Nascimento<br />
A<strong>BVCA</strong><br />
In partnership with
In partnership with<br />
Coffee <strong>and</strong><br />
Network<strong>in</strong>g<br />
In partnership with<br />
In association with Offshore jurisdiction<br />
sponsor<br />
Support<strong>in</strong>g sponsor
In partnership with<br />
<strong>Private</strong> <strong>Equity</strong> <strong>and</strong><br />
<strong>Venture</strong> <strong>Capital</strong> <strong>in</strong> <strong>Brazil</strong><br />
In partnership with<br />
In association with Offshore jurisdiction<br />
sponsor<br />
Support<strong>in</strong>g sponsor
International<br />
Series <strong>Brazil</strong><br />
The Regulatory<br />
L<strong>and</strong>scape for<br />
<strong>Private</strong> <strong>Equity</strong> <strong>in</strong><br />
<strong>Brazil</strong><br />
How to tap opportunities via<br />
<strong>in</strong>ternational or local<br />
structures<br />
In partnership with
International<br />
Series <strong>Brazil</strong><br />
The Regulatory<br />
L<strong>and</strong>scape for<br />
<strong>Private</strong> <strong>Equity</strong> <strong>in</strong><br />
<strong>Brazil</strong><br />
Tim Hames (Moderator)<br />
Head of Public Affairs, Communications <strong>and</strong> Campaigns, <strong>BVCA</strong><br />
Mart<strong>in</strong> Pose<br />
Partner Tozz<strong>in</strong>iFreire<br />
Peter Furci<br />
Partner, Debevoise & Plimpton LLP<br />
In partnership with
THE ROLE OF BRAZILIAN LEGISLATION<br />
IN PE & VC DEALS<br />
November 2011<br />
Mart<strong>in</strong> Miralles Pose<br />
mpose@tozz<strong>in</strong>ifreire.com.br
<strong>Brazil</strong>ian Legal Framework – 180 yrs<br />
Consolidated Legal Environment<br />
FIRST FEDERAL<br />
CONSTITUTION<br />
1824<br />
BANKRUPTCY<br />
LAW<br />
1945 / 2005<br />
TAX<br />
CODE<br />
1966<br />
LAST FEDERAL<br />
CONSTITUTION<br />
1988<br />
COMMERCIAL<br />
CODE<br />
1850<br />
FOREIGN<br />
INVESTMENT<br />
LAW<br />
1962<br />
MINING<br />
CODE<br />
1967<br />
CONSUMERS<br />
CODE<br />
1990<br />
Informações Confidenciais de Propriedade de Tozz<strong>in</strong>iFreire Advogados<br />
CIVIL<br />
CODE<br />
1916 / 2003<br />
BANKING<br />
LAW<br />
1964<br />
IP<br />
LAWS<br />
1971 / 1996<br />
VENTURE<br />
CAPITAL<br />
1994<br />
CORPORATION<br />
LAW<br />
1940 / 1976<br />
CAPITAL<br />
MARKETS LAW<br />
1965<br />
SECURITIES<br />
LAW<br />
1976<br />
ARBITRATION<br />
LAW<br />
1996<br />
LABOR LAWS<br />
1943<br />
FOREST<br />
CODE<br />
1965<br />
ENVIRONMENTAL<br />
LAW<br />
1981<br />
PRIVATE<br />
EQUITY<br />
2003
Foreign Investment<br />
▪ EQUAL TREATMENT TO FOREIGN AND NATIONAL CAPITAL<br />
▪ FREE INFLOW/OUTFLOW OF FUNDS – RULES OF 1962<br />
▪ CONSOLIDATED BANKING SYSTEM REGULATION SINCE 1964<br />
▪ REGULATED VEHICLES<br />
▪ SPECIFIC PERFORMANCE FOR SHAREHOLDERS AGREEMENT<br />
▪ ENFORCEABILITY OF FOREIGN AND BRAZILIAN ARBITRATION<br />
AWARDS SINCE 1996<br />
Informações Confidenciais de Propriedade de Tozz<strong>in</strong>iFreire Advogados
Consolidated <strong>Capital</strong> Markets Regulation -<br />
1965<br />
STOCK<br />
EXCHANGE<br />
ASSET<br />
MANAGERS<br />
BROKERS<br />
CUSTODIANS<br />
Informações Confidenciais de Propriedade de Tozz<strong>in</strong>iFreire Advogados<br />
CVM<br />
AUDITORS<br />
DEPOSITARIES<br />
OTC<br />
FUNDS<br />
DEALERS
Regulated - Vehicles<br />
Foreign Country<br />
<strong>Brazil</strong><br />
Limited<br />
Liability<br />
Company<br />
Informações Confidenciais de Propriedade de Tozz<strong>in</strong>iFreire Advogados<br />
Non Listed<br />
Corporation<br />
Foreign<br />
Investor<br />
PE/VC<br />
Fund<br />
Listed<br />
Corporation
Corporate Governance<br />
▪ CORPORATION LAW<br />
• Tag along for vot<strong>in</strong>g<br />
shareholders (80%)<br />
• Reduction of disproportion<br />
between vot<strong>in</strong>g <strong>and</strong> non-<br />
vot<strong>in</strong>g<br />
• M<strong>in</strong>ority shareholder on the<br />
board<br />
Informações Confidenciais de Propriedade de Tozz<strong>in</strong>iFreire Advogados<br />
▪ NOVO MERCADO<br />
• Only vot<strong>in</strong>g shares<br />
• M<strong>in</strong>imum free float of 25%<br />
• Same premium paid to<br />
controll<strong>in</strong>g stake for all<br />
shares<br />
• 20% of <strong>in</strong>dependent<br />
directors<br />
• Compliance with IFRS<br />
• M<strong>and</strong>atory arbitration for<br />
resolution of corporate<br />
disputes
PE / VC FUNDS<br />
▪ CLOSED END INVESTMENT FUNDS (CONDOMINIUM)<br />
▪ INVEST IN BRAZILIAN LISTED AND NON LISTED CORPORATIONS AND<br />
IN OTHER FUNDS<br />
▪ VC ONLY IN EMERGING COMPANIES (BASED ON ANNUAL REVENUES)<br />
▪ PE INVESTORS – ONLY QUALIFIED ONES SUCH AS FINANCIAL<br />
INSTITUTIONS, INSURANCE COMPANIES AND PENSION FUNDS<br />
▪ SPECIAL ECONOMIC / POLITICAL RIGHTS TO QUOTAS<br />
▪ FUND REGULATION<br />
Informações Confidenciais de Propriedade de Tozz<strong>in</strong>iFreire Advogados
PE/VC FUNDS<br />
▪ MANAGERS WITH DUTY TO INFORM: ACCOUNTING STATEMENTS,<br />
PORTFOLIO COMPOSITION / NET EQUITY / ETC ANNUALLY AUDITED BY<br />
INDEPENDENT AUDITING FIRM<br />
▪ GENERAL MEETING – ACCOUNTS / MANAGER DISMISSAL / ISSUANCE<br />
OF NEW QUOTAS / AMENDMENT TO REGULATION<br />
▪ COMMITTEES – INVESTMENT / SUPERVISORY / AUDIT<br />
▪ RESTRICTION TO RELATED PARTIES TRANSACTIONS<br />
Informações Confidenciais de Propriedade de Tozz<strong>in</strong>iFreire Advogados
PE / VC FUNDS - PORTFOLIO<br />
SHARES<br />
DEBENTURES<br />
WARRANTS<br />
CONVERTIBLE<br />
SECURITIES<br />
PORTFOLIO<br />
OTHER<br />
ADMISSIBLE<br />
ASSETS<br />
Informações Confidenciais de Propriedade de Tozz<strong>in</strong>iFreire Advogados<br />
DERIVATIVES<br />
(HEDGING)<br />
TRANSACTIONS<br />
RELATED PARTIES<br />
(GMEETING)<br />
5% OF THE FUND<br />
10% OF TK/VK<br />
(GMEETING)<br />
REAL ESTATE<br />
PROPERTIES<br />
INVESTMENTS<br />
ABROAD<br />
INVESTMENT<br />
MANAGER<br />
SHARES<br />
EXTEND<br />
LOANS<br />
GRANT<br />
GUARANTEES
A<strong>BVCA</strong>P / ANBIMA CODE<br />
▪ SELF REGULATION AND BEST PRACTICES CODE<br />
• PURPOSE:<br />
▪ TRANSPARENCY ON MANAGEMENT ACTIVITIES<br />
▪ TO CREATE STANDARD PRACTICES AND PROCESSES<br />
▪ EQUITABLE TREATMENT<br />
▪ INCREASE FIDUCIARY DUTIES<br />
• MANDATORY ADHESION:<br />
▪ MANAGERS AFFILIATED TO A<strong>BVCA</strong>P<br />
▪ INVESTMENT MANAGERS OF PE / VC FUNDS<br />
▪ INSTITUTIONS AFFILIATED TO ANBIMA<br />
Informações Confidenciais de Propriedade de Tozz<strong>in</strong>iFreire Advogados
<strong>Brazil</strong>: International Fund<br />
Structures<br />
November 7, 2011<br />
Peter A. Furci<br />
Debevoise & Plimpton LLP<br />
<strong>Private</strong> <strong>Equity</strong> <strong>and</strong> <strong>Venture</strong> <strong>Capital</strong> <strong>in</strong> <strong>Brazil</strong> Forum<br />
23539783
<strong>Brazil</strong> Fund Structures<br />
• Funds for <strong>in</strong>ternational <strong>in</strong>vestors are typically<br />
structured as limited partnerships (Delaware or<br />
Cayman Isl<strong>and</strong>s) with <strong>in</strong>vestors as limited partners<br />
<strong>and</strong> sponsor as general partner<br />
• <strong>Brazil</strong>-focused <strong>in</strong>ternational funds utilize this structure,<br />
but also typically utilize a “FIP” structure to make<br />
<strong>in</strong>vestments <strong>in</strong> <strong>Brazil</strong>ian portfolio companies<br />
23539783
FIPs<br />
• Closed-end <strong>in</strong>vestment funds organized to <strong>in</strong>vest <strong>in</strong><br />
<strong>Brazil</strong>ian companies<br />
• Permissible <strong>in</strong>vestments:<br />
– Shares of sociedades anonimas (Target Companies)<br />
– Debentures<br />
• Investment restrictions:<br />
– Derivative transactions (except for hedg<strong>in</strong>g purposes)<br />
23539783<br />
– Investments outside <strong>Brazil</strong><br />
– Real property<br />
• Restrictions on borrow<strong>in</strong>g <strong>and</strong> pledg<strong>in</strong>g
FIPs: Tax Considerations<br />
• IOF of 2% on <strong>in</strong>vestments <strong>in</strong> FIPs (0% on outflows)<br />
– Rate fluctuated <strong>in</strong> 2009-10 from zero to 6%<br />
• FIP is not taxed on dividends from portfolio companies or<br />
capital ga<strong>in</strong>s on sale of shares <strong>in</strong> portfolio companies<br />
• FIP may distribute cash <strong>in</strong> respect of dividends received to<br />
quotaholders without withhold<strong>in</strong>g tax<br />
• Sale proceeds distributed by the FIP to a quotaholder are<br />
exempt from tax if<br />
– Quotaholder (<strong>in</strong>dividually or with related parties) owns<br />
less than 40% of the FIP quotas/economic <strong>in</strong>terests<br />
– FIP does not own debt exceed<strong>in</strong>g 5% of net equity<br />
(except convertible debentures, warrants <strong>and</strong><br />
government bonds)<br />
– Quotaholder not domiciled <strong>in</strong> a tax haven jurisdiction<br />
23539783
FIP/Offshore Fund Structure<br />
Non-FIP<br />
Investments<br />
(Public <strong>and</strong> non-<br />
<strong>Brazil</strong>ian Portfolio<br />
Companies)<br />
23539783<br />
Fund A<br />
(Cayman LP)<br />
GP of GP<br />
(LLC)<br />
General Partner<br />
(LP)<br />
Fund B<br />
(Cayman LP)<br />
Fund C<br />
(Cayman LP)<br />
Delaware LLC A Delaware LLC B<br />
Delaware LLC C<br />
FIP 1 FIP 2 FIP 3<br />
<strong>Private</strong> <strong>Brazil</strong>ian<br />
Portfolio Company<br />
<strong>Private</strong> <strong>Brazil</strong>ian<br />
Portfolio Company<br />
<strong>Private</strong> <strong>Brazil</strong>ian<br />
Portfolio Company
FIP/Offshore Fund Structure<br />
• Delaware LLCs not tax haven <strong>in</strong>vestors<br />
• Investor representations about 40% limit<br />
• Multiple parallel funds typically utilized<br />
– Fund documents conta<strong>in</strong> numerous provisions to<br />
ensure compliance with 40% limit<br />
– Default, excuse <strong>and</strong> withdrawals raise potential issues<br />
• Reallocation of <strong>in</strong>vestments for subsequent clos<strong>in</strong>gs<br />
– Sales of FIP shares between LLCs triggers IOF<br />
– Could sell <strong>in</strong>terests <strong>in</strong> LLCs across funds<br />
– Could also be addressed by allocat<strong>in</strong>g commitments<br />
across parallel funds to ma<strong>in</strong>ta<strong>in</strong> ownership<br />
percentages<br />
23539783
Currency/Inflation Issues<br />
• Currency movements<br />
– If fund contributions/distributions are measured <strong>in</strong><br />
dollars, but <strong>in</strong>vestments are <strong>in</strong> real-denom<strong>in</strong>ated<br />
assets:<br />
– Carried <strong>in</strong>terest is “supercharged” if the real appreciates<br />
– Possible loss of sponsor <strong>in</strong>centives if the real<br />
depreciates<br />
– Investors sometimes ask for the “waterfall” to be<br />
calculated <strong>in</strong> reais<br />
• IOF tax<br />
– Fund expense vs. <strong>in</strong>vestor expense<br />
• Inflation<br />
– Some funds adjust “hurdle” rate to reflect <strong>in</strong>flation rate<br />
23539783<br />
<strong>in</strong> <strong>Brazil</strong>
Thank you<br />
23539783
In partnership with<br />
<strong>Private</strong> <strong>Equity</strong> <strong>and</strong><br />
<strong>Venture</strong> <strong>Capital</strong> <strong>in</strong> <strong>Brazil</strong><br />
In partnership with<br />
In association with Offshore jurisdiction<br />
sponsor<br />
Support<strong>in</strong>g sponsor
International<br />
Series <strong>Brazil</strong><br />
Presentation of<br />
Research<br />
What are European LPs look<strong>in</strong>g<br />
for when choos<strong>in</strong>g to <strong>in</strong>vest<br />
<strong>in</strong> <strong>Brazil</strong>, what are the ma<strong>in</strong><br />
drivers <strong>and</strong> what are the<br />
deterrents?<br />
Tim Hames<br />
Head of Public Affairs, Communications <strong>and</strong> Campaigns, <strong>BVCA</strong><br />
In partnership with
LPs’ views of the <strong>Brazil</strong>ian<br />
PE/VC market<br />
64
50<br />
45<br />
40<br />
35<br />
30<br />
25<br />
20<br />
15<br />
10<br />
5<br />
0<br />
Percentage of<br />
respondents<br />
Source: A<strong>BVCA</strong>P/<strong>BVCA</strong><br />
Average PE/VC allocations<br />
0-49mn 50-249mn 250-999mn 1-4.9bn 5bn +<br />
65
90<br />
80<br />
70<br />
60<br />
50<br />
40<br />
30<br />
20<br />
10<br />
0<br />
Source: A<strong>BVCA</strong>P/<strong>BVCA</strong><br />
Market allocations #1<br />
Average allocation among<br />
respondents (%)<br />
Emerg<strong>in</strong>g markets Developed markets<br />
66
14<br />
12<br />
10<br />
8<br />
6<br />
4<br />
2<br />
0<br />
Source: A<strong>BVCA</strong>P/<strong>BVCA</strong><br />
Market allocations #2<br />
Average allocation among respondents (%)<br />
Lat<strong>in</strong> America Asia Middle East Africa CEE<br />
67
70<br />
60<br />
50<br />
40<br />
30<br />
20<br />
10<br />
0<br />
<strong>Brazil</strong>ian PE/VC knowledge<br />
Percentage of respondents<br />
No real expertise Some broad<br />
knowledge<br />
Source: A<strong>BVCA</strong>P/<strong>BVCA</strong><br />
Detailed experience<br />
<strong>and</strong> past expertise<br />
Currently active <strong>and</strong><br />
well <strong>in</strong>formed<br />
68
90<br />
80<br />
70<br />
60<br />
50<br />
40<br />
30<br />
20<br />
10<br />
0<br />
<strong>Brazil</strong>ian PE/VC perceptions<br />
Percentage of respondents<br />
Worse than other<br />
emerg<strong>in</strong>g PE/VC<br />
markets<br />
Source: A<strong>BVCA</strong>P/<strong>BVCA</strong><br />
Not substantially<br />
different from other<br />
emerg<strong>in</strong>g PE/VC<br />
markets<br />
Some <strong>in</strong>terest<strong>in</strong>g <strong>and</strong><br />
unique characteristics<br />
Excit<strong>in</strong>g & unmatched<br />
opportunities<br />
69
70<br />
60<br />
50<br />
40<br />
30<br />
20<br />
10<br />
0<br />
Percentage of respondents<br />
PE exposure to<br />
high-growth<br />
markets<br />
Source: A<strong>BVCA</strong>P/<strong>BVCA</strong><br />
Reasons to <strong>in</strong>vest<br />
Improv<strong>in</strong>g skills &<br />
experience of GPs<br />
Better risk-return<br />
on offer<br />
Not at all important<br />
Somewhat important<br />
Very important<br />
Portfolio<br />
diversification<br />
Political &<br />
economic stability<br />
70
80<br />
70<br />
60<br />
50<br />
40<br />
30<br />
20<br />
10<br />
0<br />
Percentage of respondents<br />
Limited<br />
number of GPs<br />
Source: A<strong>BVCA</strong>P/<strong>BVCA</strong><br />
Reasons not to <strong>in</strong>vest<br />
Scale of<br />
opportunity<br />
Entry<br />
valuations are<br />
too high<br />
Weak exit<br />
environment<br />
Not at all important<br />
Somewhat important<br />
Very important<br />
Challeng<strong>in</strong>g<br />
regulatory/tax<br />
issues<br />
Political risk<br />
71
35<br />
30<br />
25<br />
20<br />
15<br />
10<br />
5<br />
0<br />
Plans for EM/GP relationships #1<br />
Percentage of<br />
respondents<br />
Not consider<br />
new or exist<strong>in</strong>g<br />
Source: A<strong>BVCA</strong>P/<strong>BVCA</strong><br />
Only renew<br />
with exist<strong>in</strong>g<br />
Exist<strong>in</strong>g <strong>and</strong><br />
consider new<br />
Mostly new,<br />
consider<br />
exist<strong>in</strong>g<br />
Only new Consider with<br />
advisors<br />
72
90<br />
80<br />
70<br />
60<br />
50<br />
40<br />
30<br />
20<br />
10<br />
0<br />
Plans for EM/GP relationships #2<br />
Percentage of respondents<br />
Increase number of GPs Ma<strong>in</strong>ta<strong>in</strong> number of GPs Decrease number of GPs<br />
Source: A<strong>BVCA</strong>P/<strong>BVCA</strong><br />
73
30<br />
25<br />
20<br />
15<br />
10<br />
5<br />
0<br />
Source: A<strong>BVCA</strong>P/<strong>BVCA</strong><br />
Allocations: 2012 vs 2011<br />
Percentage of respondents<br />
First-time Considerably<br />
<strong>in</strong>vestment <strong>in</strong><br />
2012<br />
higher<br />
Slightly<br />
higher<br />
Same<br />
ammount<br />
Slightly less Considerably<br />
less<br />
Won't <strong>in</strong>vest<br />
<strong>in</strong> 2012<br />
74
60<br />
50<br />
40<br />
30<br />
20<br />
10<br />
0<br />
Source: A<strong>BVCA</strong>P/<strong>BVCA</strong><br />
Expected commitments<br />
Percentage of respondents<br />
Next 12 months<br />
Next 1-2 years<br />
Next 2-5 years<br />
More than 5 years<br />
Zero Up to $24mn $25mn-49mn $50mn-99mn $100mn+<br />
75
80<br />
70<br />
60<br />
50<br />
40<br />
30<br />
20<br />
10<br />
0<br />
Percentage of respondents<br />
Source: A<strong>BVCA</strong>P/<strong>BVCA</strong><br />
Expected returns<br />
V<strong>in</strong>tages up to 2010<br />
2011 v<strong>in</strong>tages onwards<br />
< 1x 1x - 1.5x 1.6x - 2x 2.1x - 3x > 3x<br />
76
70<br />
60<br />
50<br />
40<br />
30<br />
20<br />
10<br />
0<br />
Source: A<strong>BVCA</strong>P/<strong>BVCA</strong><br />
First-time funds (FTFs) #1<br />
Percentage of respondents<br />
Currently <strong>in</strong>vest<strong>in</strong>g <strong>in</strong><br />
FTF<br />
Consider<strong>in</strong>g <strong>in</strong>vest<strong>in</strong>g<br />
<strong>in</strong> FTF<br />
Invest<strong>in</strong>g <strong>in</strong> sp<strong>in</strong>-offs Will not pick FTFs<br />
77
60<br />
50<br />
40<br />
30<br />
20<br />
10<br />
0<br />
Source: A<strong>BVCA</strong>P/<strong>BVCA</strong><br />
First-time funds (FTFs) #2<br />
Percentage of respondents<br />
Would <strong>in</strong>vest <strong>in</strong> FTF before<br />
<strong>in</strong>itial close<br />
Only <strong>in</strong>vest <strong>in</strong> FTF after <strong>in</strong>itial<br />
close<br />
Would not <strong>in</strong>vest <strong>in</strong> FTF<br />
78
80<br />
70<br />
60<br />
50<br />
40<br />
30<br />
20<br />
10<br />
0<br />
Source: A<strong>BVCA</strong>P/<strong>BVCA</strong><br />
Value of local structures<br />
Percentage of respondents<br />
Local <strong>in</strong>vestor participation on<br />
<strong>in</strong>vestment committees<br />
Investments <strong>in</strong> local structures<br />
eg FIPs<br />
Not desirable Irrelevant Desirable<br />
79
80<br />
70<br />
60<br />
50<br />
40<br />
30<br />
20<br />
10<br />
0<br />
Percentage of respondents<br />
Source: A<strong>BVCA</strong>P/<strong>BVCA</strong><br />
Preferred fund types<br />
Generalist Small to mid-market buyout <strong>Venture</strong> Depends on advice<br />
80
90<br />
80<br />
70<br />
60<br />
50<br />
40<br />
30<br />
20<br />
10<br />
0<br />
Sport<strong>in</strong>g/pre-salt <strong>in</strong>fluence?<br />
Percentage of respondents<br />
Source: A<strong>BVCA</strong>P/<strong>BVCA</strong><br />
Irrelevant Slight <strong>in</strong>fluence Considerable <strong>in</strong>fluence<br />
81
Thank you<br />
82
In partnership with<br />
<strong>Private</strong> <strong>Equity</strong> <strong>and</strong><br />
<strong>Venture</strong> <strong>Capital</strong> <strong>in</strong> <strong>Brazil</strong><br />
In partnership with<br />
In association with Offshore jurisdiction<br />
sponsor<br />
Support<strong>in</strong>g sponsor
International<br />
Series <strong>Brazil</strong><br />
The LP Perspective on<br />
Invest<strong>in</strong>g <strong>in</strong> <strong>Brazil</strong><br />
What to look for when select<strong>in</strong>g<br />
fund managers? Do first time<br />
funds get <strong>in</strong>to the mix? How?<br />
In partnership with
International<br />
Series <strong>Brazil</strong><br />
The LP Perspective on<br />
Invest<strong>in</strong>g <strong>in</strong> <strong>Brazil</strong><br />
Philippe Munch (moderator)<br />
Investment Director, Greenpark <strong>Capital</strong><br />
Anselm Adams<br />
Director - Senior PE Portfolio Manager, PECA Ltd<br />
Elvire Perr<strong>in</strong><br />
Partner <strong>and</strong> Head of Research, Altius Associates<br />
Guy Eastman<br />
Partner, Head of European Investment <strong>and</strong> Member of Global<br />
Investment Committee, SVG <strong>Capital</strong><br />
In partnership with
International<br />
Series <strong>Brazil</strong><br />
Clos<strong>in</strong>g Remarks<br />
Kamran Anwar<br />
EMEA Head of <strong>Private</strong> <strong>Equity</strong> Services, Citi<br />
In partnership with