Private Equity and Venture Capital in Brazil - BVCA admin
Private Equity and Venture Capital in Brazil - BVCA admin
Private Equity and Venture Capital in Brazil - BVCA admin

Create successful ePaper yourself
Turn your PDF publications into a flip-book with our unique Google optimized e-Paper software.
22549-d-092308<br />
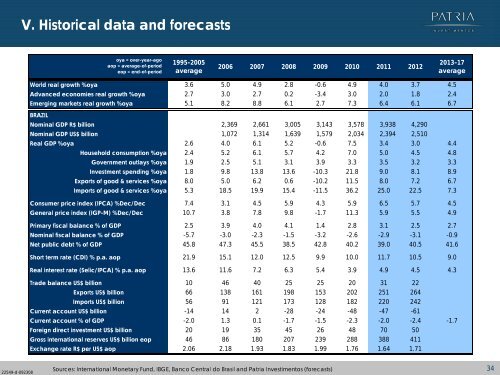
V. Historical data <strong>and</strong> forecasts<br />
oya = over-year-ago<br />
aop = average-of-period<br />
eop = end-of-period<br />
1995-2005<br />
average<br />
2006 2007 2008 2009 2010 2011 2012<br />
World real growth %oya 3.6 5.0 4.9 2.8 -0.6 4.9 4.0 3.7 4.5<br />
Advanced economies real growth %oya 2.7 3.0 2.7 0.2 -3.4 3.0 2.0 1.8 2.4<br />
Emerg<strong>in</strong>g markets real growth %oya 5.1 8.2 8.8 6.1 2.7 7.3 6.4 6.1 6.7<br />
Sources: International Monetary Fund, IBGE, Banco Central do Brasil <strong>and</strong> Patria Investimentos (forecasts)<br />
2013-17<br />
average<br />
BRAZIL<br />
Nom<strong>in</strong>al GDP R$ billion 2,369 2,661 3,005 3,143 3,578 3,938 4,290<br />
Nom<strong>in</strong>al GDP US$ billion 1,072 1,314 1,639 1,579 2,034 2,394 2,510<br />
Real GDP %oya 2.6 4.0 6.1 5.2 -0.6 7.5 3.4 3.0 4.4<br />
Household consumption %oya 2.4 5.2 6.1 5.7 4.2 7.0 5.0 4.5 4.8<br />
Government outlays %oya 1.9 2.5 5.1 3.1 3.9 3.3 3.5 3.2 3.3<br />
Investment spend<strong>in</strong>g %oya 1.8 9.8 13.8 13.6 -10.3 21.8 9.0 8.1 8.9<br />
Exports of good & services %oya 8.0 5.0 6.2 0.6 -10.2 11.5 8.0 7.2 6.7<br />
Imports of good & services %oya 5.3 18.5 19.9 15.4 -11.5 36.2 25.0 22.5 7.3<br />
Consumer price <strong>in</strong>dex (IPCA) %Dec/Dec 7.4 3.1 4.5 5.9 4.3 5.9 6.5 5.7 4.5<br />
General price <strong>in</strong>dex (IGP-M) %Dec/Dec 10.7 3.8 7.8 9.8 -1.7 11.3 5.9 5.5 4.9<br />
Primary fiscal balance % of GDP 2.5 3.9 4.0 4.1 1.4 2.8 3.1 2.5 2.7<br />
Nom<strong>in</strong>al fiscal balance % of GDP -5.7 -3.0 -2.3 -1.5 -3.2 -2.6 -2.9 -3.1 -0.9<br />
Net public debt % of GDP 45.8 47.3 45.5 38.5 42.8 40.2 39.0 40.5 41.6<br />
Short term rate (CDI) % p.a. aop 21.9 15.1 12.0 12.5 9.9 10.0 11.7 10.5 9.0<br />
Real <strong>in</strong>terest rate (Selic/IPCA) % p.a. aop 13.6 11.6 7.2 6.3 5.4 3.9 4.9 4.5 4.3<br />
Trade balance US$ billion 10 46 40 25 25 20 31 22<br />
Exports US$ billion 66 138 161 198 153 202 251 264<br />
Imports US$ billion 56 91 121 173 128 182 220 242<br />
Current account US$ billion -14 14 2 -28 -24 -48 -47 -61<br />
Current account % of GDP -2.0 1.3 0.1 -1.7 -1.5 -2.3 -2.0 -2.4 -1.7<br />
Foreign direct <strong>in</strong>vestment US$ billion 20 19 35 45 26 48 70 50<br />
Gross <strong>in</strong>ternational reserves US$ billion eop 46 86 180 207 239 288 388 411<br />
Exchange rate R$ per US$ aop 2.06 2.18 1.93 1.83 1.99 1.76 1.64 1.71<br />
34