Private Equity and Venture Capital in Brazil - BVCA admin
Private Equity and Venture Capital in Brazil - BVCA admin
Private Equity and Venture Capital in Brazil - BVCA admin

You also want an ePaper? Increase the reach of your titles
YUMPU automatically turns print PDFs into web optimized ePapers that Google loves.
22549-d-092308<br />
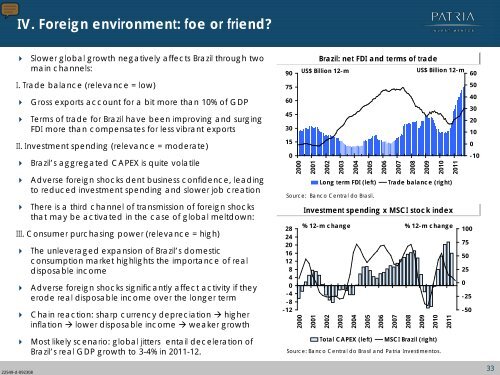
IV. Foreign environment: foe or friend?<br />
Slower global growth negatively affects <strong>Brazil</strong> through two<br />
ma<strong>in</strong> channels:<br />
I. Trade balance (relevance = low)<br />
Gross exports account for a bit more than 10% of GDP<br />
Terms of trade for <strong>Brazil</strong> have been improv<strong>in</strong>g <strong>and</strong> surg<strong>in</strong>g<br />
FDI more than compensates for less vibrant exports<br />
II. Investment spend<strong>in</strong>g (relevance = moderate)<br />
<strong>Brazil</strong>’s aggregated CAPEX is quite volatile<br />
Adverse foreign shocks dent bus<strong>in</strong>ess confidence, lead<strong>in</strong>g<br />
to reduced <strong>in</strong>vestment spend<strong>in</strong>g <strong>and</strong> slower job creation<br />
There is a third channel of transmission of foreign shocks<br />
that may be activated <strong>in</strong> the case of global meltdown:<br />
III. Consumer purchas<strong>in</strong>g power (relevance = high)<br />
The unleveraged expansion of <strong>Brazil</strong>’s domestic<br />
consumption market highlights the importance of real<br />
disposable <strong>in</strong>come<br />
Adverse foreign shocks significantly affect activity if they<br />
erode real disposable <strong>in</strong>come over the longer term<br />
Cha<strong>in</strong> reaction: sharp currency depreciation higher<br />
<strong>in</strong>flation lower disposable <strong>in</strong>come weaker growth<br />
Most likely scenario: global jitters entail deceleration of<br />
<strong>Brazil</strong>’s real GDP growth to 3-4% <strong>in</strong> 2011-12.<br />
90<br />
75<br />
60<br />
45<br />
30<br />
15<br />
0<br />
<strong>Brazil</strong>: net FDI <strong>and</strong> terms of trade<br />
Source: Banco Central do Brasil.<br />
28<br />
24<br />
20<br />
16<br />
12<br />
8<br />
4<br />
0<br />
-4<br />
-8<br />
-12<br />
2000<br />
2000<br />
US$ Billion 12-m<br />
2001<br />
Investment spend<strong>in</strong>g x MSCI stock <strong>in</strong>dex<br />
2001<br />
2002<br />
2002<br />
2003<br />
2003<br />
2004<br />
2004<br />
2005<br />
2005<br />
2006<br />
% 12-m change % 12-m change<br />
2006<br />
2007<br />
2007<br />
2008<br />
2008<br />
2009<br />
2010<br />
Total CAPEX (left) MSCI <strong>Brazil</strong> (right)<br />
US$ Billion 12-m<br />
2009<br />
Source: Banco Central do Brasil <strong>and</strong> Patria Investimentos.<br />
2010<br />
Long term FDI (left) Trade balance (right)<br />
2011<br />
2011<br />
100<br />
75<br />
50<br />
25<br />
0<br />
0<br />
-25<br />
-50<br />
60<br />
50<br />
40<br />
30<br />
20<br />
10<br />
-10<br />
33