Diagnostic accuracy of hospitalist-performed hand-carried ...
Diagnostic accuracy of hospitalist-performed hand-carried ...
Diagnostic accuracy of hospitalist-performed hand-carried ...

Create successful ePaper yourself
Turn your PDF publications into a flip-book with our unique Google optimized e-Paper software.
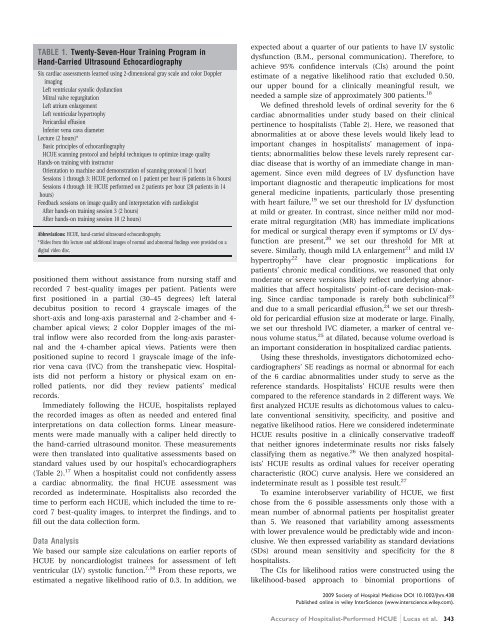
TABLE 1. Twenty-Seven-Hour Training Program in<br />
Hand-Carried Ultrasound Echocardiography<br />
Six cardiac assessments learned using 2-dimensional gray scale and color Doppler<br />
imaging<br />
Left ventricular systolic dysfunction<br />
Mitral valve regurgitation<br />
Left atrium enlargement<br />
Left ventricular hypertrophy<br />
Pericardial effusion<br />
Inferior vena cava diameter<br />
Lecture (2 hours)*<br />
Basic principles <strong>of</strong> echocardiography<br />
HCUE scanning protocol and helpful techniques to optimize image quality<br />
Hands-on training with instructor<br />
Orientation to machine and demonstration <strong>of</strong> scanning protocol (1 hour)<br />
Sessions 1 through 3: HCUE <strong>performed</strong> on 1 patient per hour (6 patients in 6 hours)<br />
Sessions 4 through 10: HCUE <strong>performed</strong> on 2 patients per hour (28 patients in 14<br />
hours)<br />
Feedback sessions on image quality and interpretation with cardiologist<br />
After <strong>hand</strong>s-on training session 3 (2 hours)<br />
After <strong>hand</strong>s-on training session 10 (2 hours)<br />
Abbreviations: HCUE, <strong>hand</strong>-<strong>carried</strong> ultrasound echocardiography.<br />
* Slides from this lecture and additional images <strong>of</strong> normal and abnormal findings were provided on a<br />
digital video disc.<br />
positioned them without assistance from nursing staff and<br />
recorded 7 best-quality images per patient. Patients were<br />
first positioned in a partial (30–45 degrees) left lateral<br />
decubitus position to record 4 grayscale images <strong>of</strong> the<br />
short-axis and long-axis parasternal and 2-chamber and 4chamber<br />
apical views; 2 color Doppler images <strong>of</strong> the mitral<br />
inflow were also recorded from the long-axis parasternal<br />
and the 4-chamber apical views. Patients were then<br />
positioned supine to record 1 grayscale image <strong>of</strong> the inferior<br />
vena cava (IVC) from the transhepatic view. Hospitalists<br />
did not perform a history or physical exam on enrolled<br />
patients, nor did they review patients’ medical<br />
records.<br />
Immediately following the HCUE, <strong>hospitalist</strong>s replayed<br />
the recorded images as <strong>of</strong>ten as needed and entered final<br />
interpretations on data collection forms. Linear measurements<br />
were made manually with a caliper held directly to<br />
the <strong>hand</strong>-<strong>carried</strong> ultrasound monitor. These measurements<br />
were then translated into qualitative assessments based on<br />
standard values used by our hospital’s echocardiographers<br />
(Table 2). 17 When a <strong>hospitalist</strong> could not confidently assess<br />
a cardiac abnormality, the final HCUE assessment was<br />
recorded as indeterminate. Hospitalists also recorded the<br />
time to perform each HCUE, which included the time to record<br />
7 best-quality images, to interpret the findings, and to<br />
fill out the data collection form.<br />
Data Analysis<br />
We based our sample size calculations on earlier reports <strong>of</strong><br />
HCUE by noncardiologist trainees for assessment <strong>of</strong> left<br />
ventricular (LV) systolic function. 7,10 From these reports, we<br />
estimated a negative likelihood ratio <strong>of</strong> 0.3. In addition, we<br />
expected about a quarter <strong>of</strong> our patients to have LV systolic<br />
dysfunction (B.M., personal communication). Therefore, to<br />
achieve 95% confidence intervals (CIs) around the point<br />
estimate <strong>of</strong> a negative likelihood ratio that excluded 0.50,<br />
our upper bound for a clinically meaningful result, we<br />
needed a sample size <strong>of</strong> approximately 300 patients. 18<br />
We defined threshold levels <strong>of</strong> ordinal severity for the 6<br />
cardiac abnormalities under study based on their clinical<br />
pertinence to <strong>hospitalist</strong>s (Table 2). Here, we reasoned that<br />
abnormalities at or above these levels would likely lead to<br />
important changes in <strong>hospitalist</strong>s’ management <strong>of</strong> inpatients;<br />
abnormalities below these levels rarely represent cardiac<br />
disease that is worthy <strong>of</strong> an immediate change in management.<br />
Since even mild degrees <strong>of</strong> LV dysfunction have<br />
important diagnostic and therapeutic implications for most<br />
general medicine inpatients, particularly those presenting<br />
with heart failure, 19 we set our threshold for LV dysfunction<br />
at mild or greater. In contrast, since neither mild nor moderate<br />
mitral regurgitation (MR) has immediate implications<br />
for medical or surgical therapy even if symptoms or LV dysfunction<br />
are present, 20 we set our threshold for MR at<br />
severe. Similarly, though mild LA enlargement 21 and mild LV<br />
hypertrophy 22 have clear prognostic implications for<br />
patients’ chronic medical conditions, we reasoned that only<br />
moderate or severe versions likely reflect underlying abnormalities<br />
that affect <strong>hospitalist</strong>s’ point-<strong>of</strong>-care decision-making.<br />
Since cardiac tamponade is rarely both subclinical 23<br />
and due to a small pericardial effusion, 24 we set our threshold<br />
for pericardial effusion size at moderate or large. Finally,<br />
we set our threshold IVC diameter, a marker <strong>of</strong> central venous<br />
volume status, 25 at dilated, because volume overload is<br />
an important consideration in hospitalized cardiac patients.<br />
Using these thresholds, investigators dichotomized echocardiographers’<br />
SE readings as normal or abnormal for each<br />
<strong>of</strong> the 6 cardiac abnormalities under study to serve as the<br />
reference standards. Hospitalists’ HCUE results were then<br />
compared to the reference standards in 2 different ways. We<br />
first analyzed HCUE results as dichotomous values to calculate<br />
conventional sensitivity, specificity, and positive and<br />
negative likelihood ratios. Here we considered indeterminate<br />
HCUE results positive in a clinically conservative trade<strong>of</strong>f<br />
that neither ignores indeterminate results nor risks falsely<br />
classifying them as negative. 26 We then analyzed <strong>hospitalist</strong>s’<br />
HCUE results as ordinal values for receiver operating<br />
characteristic (ROC) curve analysis. Here we considered an<br />
indeterminate result as 1 possible test result. 27<br />
To examine interobserver variability <strong>of</strong> HCUE, we first<br />
chose from the 6 possible assessments only those with a<br />
mean number <strong>of</strong> abnormal patients per <strong>hospitalist</strong> greater<br />
than 5. We reasoned that variability among assessments<br />
with lower prevalence would be predictably wide and inconclusive.<br />
We then expressed variability as standard deviations<br />
(SDs) around mean sensitivity and specificity for the 8<br />
<strong>hospitalist</strong>s.<br />
The CIs for likelihood ratios were constructed using the<br />
likelihood-based approach to binomial proportions <strong>of</strong><br />
2009 Society <strong>of</strong> Hospital Medicine DOI 10.1002/jhm.438<br />
Published online in wiley InterScience (www.interscience.wiley.com).<br />
Accuracy <strong>of</strong> Hospitalist-Performed HCUE Lucas et al. 343