SafeGuard Solutions Troubleshooting Guide - Public Support Login ...
SafeGuard Solutions Troubleshooting Guide - Public Support Login ...
SafeGuard Solutions Troubleshooting Guide - Public Support Login ...

You also want an ePaper? Increase the reach of your titles
YUMPU automatically turns print PDFs into web optimized ePapers that Google loves.
Unisys <strong>SafeGuard</strong> <strong>Solutions</strong><br />
<strong>Troubleshooting</strong> <strong>Guide</strong><br />
Unisys <strong>SafeGuard</strong> <strong>Solutions</strong> Release 6.0<br />
June 2008
Unisys <strong>SafeGuard</strong> <strong>Solutions</strong><br />
<strong>Troubleshooting</strong> <strong>Guide</strong><br />
Unisys <strong>SafeGuard</strong> <strong>Solutions</strong> Release 6.0<br />
June 2008 6872 5688–002<br />
unisys<br />
imagine it. done.
NO WARRANTIES OF ANY NATURE ARE EXTENDED BY THIS DOCUMENT. Any product or related information<br />
described herein is only furnished pursuant and subject to the terms and conditions of a duly executed agreement to<br />
purchase or lease equipment or to license software. The only warranties made by Unisys, if any, with respect to the<br />
products described in this document are set forth in such agreement. Unisys cannot accept any financial or other<br />
responsibility that may be the result of your use of the information in this document or software material, including<br />
direct, special, or consequential damages.<br />
You should be very careful to ensure that the use of this information and/or software material complies with the laws,<br />
rules, and regulations of the jurisdictions with respect to which it is used.<br />
The information contained herein is subject to change without notice. Revisions may be issued to advise of such<br />
changes and/or additions.<br />
Notice to U.S. Government End Users: This is commercial computer software or hardware documentation developed at<br />
private expense. Use, reproduction, or disclosure by the Government is subject to the terms of Unisys standard<br />
commercial license for the products, and where applicable, the restricted/limited rights provisions of the contract data<br />
rights clauses.<br />
Unisys is a registered trademark of Unisys Corporation in the United States and other countries.<br />
All other brands and products referenced in this document are acknowledged to be the trademarks or registered<br />
trademarks of their respective holders.
Unisys <strong>SafeGuard</strong><br />
<strong>Solutions</strong><br />
<strong>Troubleshooting</strong> <strong>Guide</strong><br />
Unisys <strong>SafeGuard</strong><br />
<strong>Solutions</strong> Release 6.0<br />
Unisys <strong>SafeGuard</strong><br />
<strong>Solutions</strong><br />
<strong>Troubleshooting</strong><br />
<strong>Guide</strong><br />
Unisys<br />
<strong>SafeGuard</strong><br />
<strong>Solutions</strong><br />
Release 6.0<br />
6872 5688–002 6872 5688–002<br />
Bend here, peel upwards and apply to spine.
Contents<br />
Section 1. About This <strong>Guide</strong><br />
Section 2. Overview<br />
Purpose and Audience .......................................................................... 1–1<br />
Related Product Information ................................................................. 1–1<br />
Documentation Updates ....................................................................... 1–1<br />
What’s New in This Release ................................................................. 1–2<br />
Using This <strong>Guide</strong> ................................................................................... 1–3<br />
Geographic Replication Environment .................................................... 2–1<br />
Geographic Clustered Environment ...................................................... 2–2<br />
Data Flow .............................................................................................. 2–3<br />
Diagnostic Tools and Capabilities.......................................................... 2–7<br />
Event Log ............................................................................. 2–7<br />
System Status ..................................................................... 2–7<br />
E-mail Notifications .............................................................. 2–8<br />
Installation Diagnostics ........................................................ 2–9<br />
Host Information Collector (HIC) ......................................... 2–9<br />
Cluster Logs......................................................................... 2–9<br />
Unisys <strong>SafeGuard</strong> 30m Collector......................................... 2–9<br />
RA Diagnostics .................................................................... 2–9<br />
Hardware Indicators ............................................................ 2–9<br />
SNMP <strong>Support</strong> ................................................................... 2–10<br />
kutils Utility ........................................................................ 2–10<br />
Discovering Problems ......................................................................... 2–10<br />
Events That Cause Journal Distribution ............................ 2–10<br />
<strong>Troubleshooting</strong> Procedures ............................................................... 2–11<br />
Identifying the Main Components and Connectivity<br />
of the Configuration....................................................... 2–11<br />
Understanding the Current State of the System ............... 2–12<br />
Verifying the System Connectivity .................................... 2–12<br />
Analyzing the Configuration Settings ................................ 2–13<br />
Section 3. Recovering in a Geographic Replication<br />
Environment<br />
Manual Failover of Volumes and Data Consistency Groups ................. 3–2<br />
Accessing an Image ............................................................ 3–2<br />
Testing the Selected Image at Remote Site ....................... 3–3<br />
Manual Failover of Volumes and Data Consistency Groups for<br />
ClearPath MCP Hosts ....................................................................... 3–5<br />
6872 5688–002 iii
Contents<br />
Accessing an Image ............................................................. 3–5<br />
Testing the Selected Image at Remote Site ........................ 3–5<br />
Section 4. Recovering in a Geographic Clustered Environment<br />
Checking the Cluster Setup ................................................................... 4–1<br />
MSCS Properties .................................................................. 4–1<br />
Network Bindings ................................................................. 4–2<br />
Group Initialization Effects on a Cluster Move-Group<br />
Operation ........................................................................................... 4–3<br />
Full-Sweep Initialization ........................................................ 4–4<br />
Long Resynchronization ....................................................... 4–4<br />
Initialization from Marking Mode .......................................... 4–5<br />
Behavior of <strong>SafeGuard</strong> 30m Control During a Move-Group<br />
Operation ........................................................................................... 4–5<br />
Recovering by Manually Moving an Auto-Data (Shared<br />
Quorum) Consistency Group ............................................................. 4–7<br />
Taking a Cluster Data Group Offline ..................................... 4–7<br />
Performing a Manual Failover of an Auto-Data<br />
(Shared Quorum) Consistency Group to a<br />
Selected Image ................................................................ 4–8<br />
Bringing a Cluster Data Group Online and Checking<br />
the Validity of the Image .................................................. 4–9<br />
Reversing the Replication Direction of the<br />
Consistency Group ......................................................... 4–10<br />
Recovery When All RAs Fail on Site 1 (Site 1 Quorum Owner) .......... 4–11<br />
Recovery When All RAs Fail on Site 1 (Site 2 Quorum Owner) .......... 4–17<br />
Recovery When All RAs and All Servers Fail on One Site ................... 4–19<br />
Site 1 Failure (Site 1 Quorum Owner) ................................ 4–19<br />
Site 1 Failure (Site 2 Quorum Owner) ................................ 4–25<br />
Section 5. Solving Storage Problems<br />
User or Replication Volume Not Accessible .......................................... 5–4<br />
Repository Volume Not Accessible ....................................................... 5–6<br />
Reformatting the Repository Volume ................................... 5–8<br />
Journal Not Accessible ........................................................................ 5–11<br />
Journal Volume Lost Scenarios ........................................................... 5–13<br />
Total Storage Loss in a Geographic Replicated Environment ............. 5–13<br />
Storage Failure on One Site in a Geographic Clustered<br />
Environment .................................................................................... 5–16<br />
Storage Failure on One Site with Quorum Owner<br />
on Failed Site ................................................................. 5–17<br />
Storage Failure on One Site with Quorum Owner<br />
on Surviving Site ............................................................ 5–20<br />
Section 6. Solving SAN Connectivity Problems<br />
Volume Not Accessible to RAs .............................................................. 6–3<br />
Volume Not Accessible to <strong>SafeGuard</strong> 30m Splitter ............................... 6–7<br />
iv 6872 5688–002
Contents<br />
RAs Not Accessible to <strong>SafeGuard</strong> 30m Splitter .................................. 6–12<br />
Total SAN Switch Failure on One Site in a Geographic<br />
Clustered Environment ................................................................... 6–17<br />
Cluster Quorum Owner Located on Site with Failed<br />
SAN Switch ................................................................... 6–18<br />
Cluster Quorum Owner Not on Site with Failed<br />
SAN Switch ................................................................... 6–22<br />
Section 7. Solving Network Problems<br />
<strong>Public</strong> NIC Failure on a Cluster Node in a Geographic<br />
Clustered Environment ..................................................................... 7–3<br />
<strong>Public</strong> or Client WAN Failure in a Geographic Clustered<br />
Environment ..................................................................................... 7–6<br />
Management Network Failure in a Geographic Clustered<br />
Environment ................................................................................... 7–11<br />
Replication Network Failure in a Geographic Clustered<br />
Environment ................................................................................... 7–15<br />
Temporary WAN Failures .................................................................... 7–21<br />
Private Cluster Network Failure in a Geographic Clustered<br />
Environment ................................................................................... 7–22<br />
Total Communication Failure in a Geographic Clustered<br />
Environment ................................................................................... 7–26<br />
Port Information .................................................................................. 7–32<br />
Section 8. Solving Replication Appliance (RA) Problems<br />
Single RA Failures ................................................................................. 8–4<br />
Single RA Failure with Switchover ...................................... 8–5<br />
Reboot Regulation ............................................................. 8–12<br />
Failure of All SAN Fibre Channel Host Bus Adapters<br />
(HBAs ............................................................................ 8–14<br />
Failure of Onboard WAN Adapter or Failure of<br />
Optional Gigabit Fibre Channel WAN Adapter .............. 8–19<br />
Single RA Failures Without a Switchover ........................................... 8–21<br />
Port Failure on a Single SAN Fibre Channel HBA on<br />
One RA .......................................................................... 8–21<br />
Onboard Management Network Adapter Failure .............. 8–23<br />
Single Hard Disk Failure ..................................................... 8–24<br />
Failure of All RAs at One Site .............................................................. 8–25<br />
All RAs Are Not Attached .................................................................... 8–27<br />
Section 9. Solving Server Problems<br />
Cluster Node Failure (Hardware or Software) in a Geographic<br />
Clustered Environment ..................................................................... 9–2<br />
Possible Subset Scenarios .................................................. 9–3<br />
Windows Server Reboot ..................................................... 9–3<br />
Unexpected Server Shutdown Because of a Bug<br />
Check .............................................................................. 9–8<br />
6872 5688–002 v
Contents<br />
Server Crash or Restart ...................................................... 9–12<br />
Server Unable to Connect with SAN .................................. 9–14<br />
Server HBA Failure ............................................................. 9–17<br />
Infrastructure (NTP) Server Failure ...................................................... 9–18<br />
Server Failure (Hardware or Software) in a Geographic<br />
Replication Environment ................................................................. 9–20<br />
Section 10. Solving Performance Problems<br />
Slow Initialization ................................................................................. 10–2<br />
General Description of High-Load Event ............................................. 10–3<br />
High-Load (Disk Manager) Condition ................................................... 10–4<br />
High-Load (Distributor) Condition ........................................................ 10–5<br />
Failover Time Lengthens ..................................................................... 10–5<br />
Appendix A. Collecting and Using Logs<br />
Collecting RA Logs ............................................................................... A–1<br />
Setting the Automatic Host Info Collection Option ............. A–2<br />
Testing FTP Connectivity .................................................... A–2<br />
Determining When the Failure Occurred ............................ A–2<br />
Converting Local Time to GMT or UTC ............................... A–3<br />
Collecting RA Logs .............................................................. A–3<br />
Collecting Server (Host) Logs ............................................................... A–6<br />
Using the MPS Report Utility .............................................. A–6<br />
Using the Host Information Collector (HIC) Utility .............. A–7<br />
Analyzing RA Log Collection Files ........................................................ A–8<br />
RA Log Extraction Directory ................................................ A–9<br />
tmp Directory .................................................................... A–14<br />
Host Log Extraction Directory ........................................... A–15<br />
Analyzing Server (Host) Logs .............................................................. A–16<br />
Analyzing Intelligent Fabric Switch Logs ............................................ A–16<br />
Appendix B. Running Replication Appliance (RA) Diagnostics<br />
Clearing the System Event Log (SEL)................................................... B–1<br />
Running Hardware Diagnostics ............................................................ B–2<br />
Custom Test ........................................................................ B–3<br />
Express Test ........................................................................ B–4<br />
LCD Status Messages .......................................................................... B–4<br />
Appendix C. Running Installation Manager Diagnostics<br />
Using the SSH Client ............................................................................ C–1<br />
Running Diagnostics ............................................................................. C–1<br />
IP Diagnostics ...................................................................... C–2<br />
Fibre Channel Diagnostics ................................................... C–9<br />
Synchronization Diagnostics ............................................. C–17<br />
Collect System Info ........................................................... C–18<br />
vi 6872 5688–002
Appendix D. Replacing a Replication Appliance (RA)<br />
Contents<br />
Saving the Configuration Settings ........................................................ D–2<br />
Recording Policy Properties and Saving Settings ................................. D–2<br />
Modifying the Preferred RA Setting ..................................................... D–3<br />
Removing Fibre Channel Adapter Cards ............................................... D–4<br />
Installing and Configuring the Replacement RA ................................... D–4<br />
Cable and Apply Power to the New RA .............................. D–4<br />
Connecting and Accessing the RA ...................................... D–4<br />
Checking Storage-to-RA Access .......................................... D–5<br />
Enabling PCI-X Slot Functionality ......................................... D–5<br />
Configuring the RA .............................................................. D–6<br />
Verifying the RA Installation .................................................................. D–7<br />
Restoring Group Properties .................................................................. D–8<br />
Ensuring the Existing RA Can Switch Over to the New RA ................. D–8<br />
Appendix E. Understanding Events<br />
Event Log .............................................................................................. E–1<br />
Event Topics ........................................................................ E–1<br />
Event Levels ........................................................................ E–2<br />
Event Scope......................................................................... E–2<br />
Displaying the Event Log ..................................................... E–3<br />
Using the Event Log for <strong>Troubleshooting</strong> ............................ E–3<br />
List of Events ........................................................................................ E–4<br />
List of Normal Events .......................................................... E–5<br />
List of Detailed Events ...................................................... E–22<br />
Appendix F. Configuring and Using SNMP Traps<br />
Software Monitoring ............................................................................. F–1<br />
SNMP Monitoring and Trap Configuration ............................................ F–3<br />
Installing MIB Files on an SNMP Browser ............................................ F–3<br />
Resolving SNMP Issues ........................................................................ F–4<br />
Appendix G. Using the Unisys <strong>SafeGuard</strong> 30m Collector<br />
Appendix H. Using kutils<br />
Installing the <strong>SafeGuard</strong> 30m Collector ................................................ G–1<br />
Before You Begin the Configuration ..................................................... G–2<br />
Handling the Security Breach Warning ................................ G–3<br />
Using Collector Mode ........................................................................... G–4<br />
Getting Started .................................................................... G–4<br />
Understanding Operations in Collector Mode ..................... G–7<br />
Using View Mode ............................................................................... G–15<br />
Usage .................................................................................................... H–1<br />
Path Designations ................................................................................. H–1<br />
Command Summary ............................................................................. H–2<br />
6872 5688–002 vii
Contents<br />
Appendix I. Analyzing Cluster Logs<br />
Introduction to Cluster Logs ................................................................... I–1<br />
Creating the Cluster Log ....................................................... I–2<br />
Understanding the Cluster Log Layout ................................. I–3<br />
Sample Cluster Log ................................................................................ I–5<br />
Posting Information to the Cluster Log ................................. I–5<br />
Diagnosing a Problem Using Cluster Logs ............................................. I–6<br />
Gathering Materials ............................................................... I–7<br />
Opening the Cluster Log ....................................................... I–7<br />
Converting GMT/UCT to Local Time ..................................... I–8<br />
Converting Cluster Log GUIDs to Text Resource<br />
Names ............................................................................... I–8<br />
Understanding State Codes ................................................ I–10<br />
Understanding Persistent State .......................................... I–14<br />
Understanding Error and Status Codes ............................... I–15<br />
Index ............................................................................................. 1<br />
viii 6872 5688–002
Figures<br />
2–1. Basic Geographic Clustered Environment ......................................................... 2–2<br />
2–2. Data Flow ........................................................................................................... 2–3<br />
2–3. Data Flow with Fabric Splitter ............................................................................ 2–5<br />
2–4. Data flow in CDP ................................................................................................ 2–6<br />
4–1. All RAs Fail on Site 1 (Site 1 Quorum Owner) ................................................. 4–11<br />
4–2. All RAs Fail on Site 1 (Site 2 Quorum Owner) ................................................. 4–17<br />
4–3. All RAs and Servers Fail on Site 1 (Site 1 Quorum Owner) ............................. 4–20<br />
4–4. All RAs and Servers Fail on Site 1 (Site 2 Quorum Owner) ............................. 4–25<br />
5–1. Volumes Tab Showing Volume Connection Errors ............................................ 5–4<br />
5–2. Management Console Messages for the User Volume Not Accessible<br />
Problem ......................................................................................................... 5–5<br />
5–3. Groups Tab Shows “Paused by System” .......................................................... 5–5<br />
5–4. Management Console Display: Storage Error and RAs Tab Shows<br />
Volume Errors ................................................................................................ 5–7<br />
5–5. Volumes Tab Shows Error for Repository Volume ............................................ 5–7<br />
5–6. Groups Tab Shows All Groups Paused by System ............................................ 5–7<br />
5–7. Management Console Messages for the Repository Volume not<br />
Accessible Problem ....................................................................................... 5–8<br />
5–8. Volumes Tab Shows Journal Volume Error ..................................................... 5–11<br />
5–9. RAs Tab Shows Connection Errors .................................................................. 5–11<br />
5–10. Groups Tab Shows Group Paused by System ................................................. 5–12<br />
5–11. Management Console Messages for the Journal Not Accessible<br />
Problem ....................................................................................................... 5–12<br />
5–12. Management Console Volumes Tab Shows Errors for All Volumes ............... 5–14<br />
5–13. RAs Tab Shows Volumes That Are Not Accessible ......................................... 5–14<br />
5–14. Multipathing Software Reports Failed Paths to Storage Device ..................... 5–15<br />
5–15. Storage on Site 1 Fails ..................................................................................... 5–16<br />
5–16. Cluster “Regroup” Process ............................................................................. 5–17<br />
5–17. Cluster Administrator Displays ......................................................................... 5–19<br />
5–18. Multipathing Software Shows Server Errors for Failed Storage<br />
Subsystem ................................................................................................... 5–19<br />
6–1. Management Console Showing “Inaccessible Volume” Errors ........................ 6–3<br />
6–2. Management Console Messages for Inaccessible Volumes ............................. 6–3<br />
6–3. Management Console Error Display Screen ...................................................... 6–7<br />
6–4. Management Console Messages for Volumes Inaccessible to Splitter ............ 6–8<br />
6–5. EMC PowerPath Shows Disk Error .................................................................. 6–10<br />
6–6. Management Console Display Shows a Splitter Down ................................... 6–12<br />
6–7. Management Console Messages for Splitter Inaccessible to RA ................... 6–13<br />
6–8. SAN Switch Failure on One Site ...................................................................... 6–17<br />
6–9. Management Console Display with Errors for Failed SAN Switch .................. 6–18<br />
6872 5688–002 ix
Figures<br />
6–10. Management Console Messages for Failed SAN Switch ................................ 6–19<br />
6–11. Management Console Messages for Failed SAN Switch with Quorum<br />
Owner on Surviving Site ............................................................................... 6–23<br />
7–1. <strong>Public</strong> NIC Failure of a Cluster Node .................................................................. 7–3<br />
7–2. <strong>Public</strong> NIC Error Shown in the Cluster Administrator ......................................... 7–5<br />
7–3. <strong>Public</strong> or Client WAN Failure............................................................................... 7–7<br />
7–4. Cluster Administrator Showing <strong>Public</strong> LAN Network Error ................................ 7–8<br />
7–5. Management Network Failure .......................................................................... 7–11<br />
7–6. Management Console Display: “Not Connected” ........................................... 7–13<br />
7–7. Management Console Message for Event 3023 .............................................. 7–13<br />
7–8. Replication Network Failure .............................................................................. 7–15<br />
7–9. Management Console Display: WAN Down .................................................... 7–17<br />
7–10. Management Console Log Messages: WAN Down ........................................ 7–17<br />
7–11. Management Console RAs Tab: All RAs Data Link Down ............................... 7–18<br />
7–12. Private Cluster Network Failure ........................................................................ 7–22<br />
7–13. Cluster Administrator Display with Failures ...................................................... 7–23<br />
7–14. Total Communication Failure ............................................................................ 7–26<br />
7–15. Management Console Display Showing WAN Error ........................................ 7–27<br />
7–16. RAs Tab for Total Communication Failure ........................................................ 7–28<br />
7–17. Management Console Messages for Total Communication Failure ................ 7–28<br />
7–18. Cluster Administrator Showing Private Network Down ................................... 7–31<br />
7–19. Cluster Administrator Showing <strong>Public</strong> Network Down .................................... 7–31<br />
8–1. Single RA Failure ................................................................................................. 8–5<br />
8–2. Sample BIOS Display .......................................................................................... 8–6<br />
8–3. Management Console Display Showing RA Error and RAs Tab......................... 8–7<br />
8–4. Management Console Messages for Single RA Failure with<br />
Switchover...................................................................................................... 8–8<br />
8–5. LCD Display on Front Panel of RA .................................................................... 8–10<br />
8–6. Rear Panel of RA Showing Indicators ............................................................... 8–11<br />
8–7. Location of Network LEDs................................................................................ 8–11<br />
8–8. Location of SAN Fibre Channel HBA LEDs ....................................................... 8–12<br />
8–9. Management Console Display: Host Connection with RA Is Down ................ 8–15<br />
8–10. Management Console Messages for Failed RA (All SAN HBAs Fail) ............... 8–16<br />
8–11. Management Console Showing WAN Data Link Failure .................................. 8–20<br />
8–12. Location of Hard Drive LEDs ............................................................................ 8–25<br />
8–13. Management Console Showing All RAs Down ................................................ 8–26<br />
9–1. Cluster Node Failure ........................................................................................... 9–2<br />
9–2. Management Console Display with Server Error ............................................... 9–4<br />
9–3. Management Console Messages for Server Down ........................................... 9–5<br />
9–4. Management Console Messages for Server Down for Bug Check ................... 9–9<br />
9–5. Management Console Display Showing LA Site Server Down ........................ 9–14<br />
9–6. Management Console Images Showing Messages for Server Unable<br />
to Connect to SAN ....................................................................................... 9–15<br />
9–7. PowerPath Administrator Console Showing Failures ....................................... 9–16<br />
9–8. PowerPath Administrator Console Showing Adapter Failure ........................... 9–17<br />
9–9. Event 1009 Display ........................................................................................... 9–19<br />
I–1. Layout of the Cluster Log .................................................................................... I–3<br />
I–2. Expanded Cluster Hive (in Windows 2000 Server) ............................................ I–10<br />
x 6872 5688–002
Figures<br />
6872 5688–002 xi
Figures<br />
xii 6872 5688–002
Tables<br />
2–1. User Types ......................................................................................................... 2–8<br />
2–2. Events That Cause Journal Distribution ........................................................... 2–11<br />
5–1. Possible Storage Problems with Symptoms ..................................................... 5–1<br />
5–2. Indicators and Management Console Errors to Distinguish Different<br />
Storage Volume Failures ................................................................................ 5–3<br />
6–1. Possible SAN Connectivity Problems ................................................................ 6–1<br />
7–1. Possible Networking Problems with Symptoms ............................................... 7–1<br />
7–2. Ports for Internet Communication ................................................................... 7–33<br />
7–3. Ports for Management LAN Communication and Notification ........................ 7–33<br />
7–4. Ports for RA-to-RA Internal Communication .................................................... 7–34<br />
8–1. Possible Problems for Single RA Failure with a Switchover .............................. 8–2<br />
8–2. Possible Problems for Single RA Failure Wthout a Switchover ......................... 8–3<br />
8–3. Possible Problems for Multiple RA Failures with Symptoms ............................ 8–3<br />
8–4. Management Console Messages Pertaining to Reboots ................................ 8–13<br />
9–1. Possible Server Problems with Symptoms ....................................................... 9–1<br />
10–1. Possible Performance Problems with Symptoms ........................................... 10–1<br />
B–1. LCD Status Messages ....................................................................................... B–5<br />
C–1. Messages from the Connectivity Testing Tool .................................................. C–8<br />
E–1. Normal Events .................................................................................................... E–5<br />
E–2. Detailed Events ................................................................................................ E–23<br />
F–1. Trap Variables and Values .................................................................................. F–2<br />
I–1. System Environment Variables Related to Clustering ........................................ I–2<br />
I–2. Modules of MSCS ............................................................................................... I–4<br />
I–3. Node State Codes ............................................................................................. I–12<br />
I–4. Group State Codes ............................................................................................ I–12<br />
I–5. Resource State Codes ...................................................................................... I–12<br />
I–6. Network Interface State Codes ........................................................................ I–13<br />
I–7. Network State Codes ........................................................................................ I–13<br />
6872 5688–002 xiii
Tables<br />
xiv 6872 5688–002
Section 1<br />
About This <strong>Guide</strong><br />
Purpose and Audience<br />
This document presents procedures for problem analysis and troubleshooting of the<br />
Unisys <strong>SafeGuard</strong> 30m solution. It is intended for Unisys service representatives and<br />
other technical personnel who are responsible for maintaining the Unisys <strong>SafeGuard</strong><br />
30m solution installation.<br />
Related Product Information<br />
The methods described in this document are based on support and diagnostic tools that<br />
are provided as standard components of the Unisys <strong>SafeGuard</strong> 30m solution. You can<br />
find additional information about these tools in the following documents:<br />
• Unisys <strong>SafeGuard</strong> <strong>Solutions</strong> Planning and Installation <strong>Guide</strong><br />
• Unisys <strong>SafeGuard</strong> <strong>Solutions</strong> Replication Appliance Administrator’s <strong>Guide</strong><br />
• Unisys <strong>SafeGuard</strong> <strong>Solutions</strong> Introduction to Replication Appliance Command Line<br />
Interface (CLI)<br />
• Unisys <strong>SafeGuard</strong> <strong>Solutions</strong> Replication Appliance Installation <strong>Guide</strong><br />
Note: Review the information in the Unisys <strong>SafeGuard</strong> <strong>Solutions</strong> Planning and<br />
Installation <strong>Guide</strong> about making configuration changes before you begin troubleshooting<br />
a problem.<br />
Documentation Updates<br />
This document contains all the information that was available at the time of<br />
publication. Changes identified after release of this document are included in problem list<br />
entry (PLE) 18609274. To obtain a copy of the PLE, contact your Unisys service<br />
representative or access the current PLE from the Unisys Product <strong>Support</strong> Web site:<br />
http://www.support.unisys.com/all/ple/18609274<br />
Note: If you are not logged into the Product <strong>Support</strong> site, you will be asked to do so.<br />
6872 5688–002 1–1
About This <strong>Guide</strong><br />
What’s New in This Release<br />
Some of the important changes in the 6.0 release are summarized in this table.<br />
Unisys <strong>SafeGuard</strong><br />
Continuous Data<br />
Protection (CDP)<br />
Change Notes<br />
<strong>Support</strong> for Concurrent<br />
Local and Remote (CLR)<br />
<strong>Support</strong> for CLARiiON<br />
splitter.<br />
<strong>Support</strong> for Brocade<br />
intelligent fabric splitting<br />
(multi-VI mode only), using<br />
the Brocade 7500 SAN<br />
Router.<br />
<strong>Support</strong> for configurations<br />
using a mix of splitters<br />
within the same RA<br />
cluster and across RA<br />
clusters at different sites.<br />
Redesign of the<br />
Management Console GUI<br />
for greater ease-of-use.<br />
SNMP trap viewer, Log<br />
Collection and Analysis,<br />
Auto-discovery of<br />
<strong>SafeGuard</strong> components in<br />
Safeguard Command<br />
Center.<br />
A Unisys <strong>SafeGuard</strong> Duplex solution that uses one<br />
Replication Appliance (RA) cluster to replicate data<br />
across the Storage Area Network (SAN).<br />
Concurrent Local (CDP) and Concurrent Remote<br />
Replication (CRR) of the same production volumes.<br />
Unisys <strong>SafeGuard</strong> solutions work with the<br />
CLARiiON CX3 Series CLARiiON Splitter service to<br />
deliver a fully heterogeneous array-based data<br />
replication solution that is achieved without the<br />
need for host-based agents.<br />
To support the heterogeneous environment at<br />
switch level, Safeguard Solution supports<br />
Intelligent fabric splitting with Brocade switch.<br />
<strong>SafeGuard</strong> solutions can support mixed splitters in<br />
a given solution configuration.<br />
New RA GUI interface is easy to navigate and<br />
more clear to use.<br />
Command Center now has the log collection and<br />
automatic discovery of the devices.<br />
1–2 6872 5688–002
Using This <strong>Guide</strong><br />
About This <strong>Guide</strong><br />
This guide offers general information in the first four sections. Read Section 2 to<br />
understand the overall approach to troubleshooting and to gain an understanding of the<br />
Unisys <strong>SafeGuard</strong> 30m solution architecture.<br />
Section 3 describes recovery in a geographic replication environment, and Section 4<br />
offers information and recovery procedures for geographic clustered environments.<br />
Sections 5 through 10 group potential problems into categories and describe the<br />
problems. You must recognize symptoms, identify the problem or failed component, and<br />
then decide what to do to correct the problem. Sections 5 through 10 include a table at<br />
the beginning of each section that lists symptoms and potential problems.<br />
Each problem is then presented in the following format:<br />
• Problem Description: Description of the problem<br />
• Symptoms: List of symptoms that are typical for this problem<br />
• Actions to Resolve the Problem: Steps recommended to solve the problem<br />
The appendixes provide information about using tools and offer reference information<br />
that you might find useful in different situations.<br />
6872 5688–002 1–3
About This <strong>Guide</strong><br />
1–4 6872 5688–002
Section 2<br />
Overview<br />
The Unisys <strong>SafeGuard</strong> <strong>Solutions</strong> are flexible, integrated business continuance solutions<br />
especially suitable for protecting business-critical application environments. The Unisys<br />
<strong>SafeGuard</strong> 30m solution provides two distinct functions that act in concert: replication of<br />
data and automated application recovery through clustering over great distances.<br />
Typically, the Unisys <strong>SafeGuard</strong> 30m solution is implemented in one of these<br />
environments:<br />
• Geographic replication environment: In this replication environment, data from<br />
servers at one site are replicated to a remote site.<br />
• Geographic clustered environment: In this replication environment, Microsoft Cluster<br />
Service (MSCS) is installed on servers that span sites and that participate in one<br />
cluster. The use of a Unisys <strong>SafeGuard</strong> 30m Control resource allows automated<br />
failover and recovery by controlling the replication direction with a MSCS resource.<br />
The resource is used in this environment only.<br />
Geographic Replication Environment<br />
Unisys <strong>SafeGuard</strong> <strong>Solutions</strong> supports replication of data over Fibre Channel to local SANattached<br />
storage and over WAN to remote sites. It also allows failover to a secondary<br />
site and continues operations in the event of a disaster at the primary site.<br />
Unisys <strong>SafeGuard</strong> <strong>Solutions</strong> replicates data over any distance:<br />
• within the same site (CDP), or<br />
• to another site halfway around the globe (CRR), or<br />
• both (CLR.)<br />
6872 5688–002 2–1
Overview<br />
Geographic Clusteered<br />
Environment<br />
2–2<br />
In the geographic clusterred<br />
environment, MSCS and cluster nodes are part of o the<br />
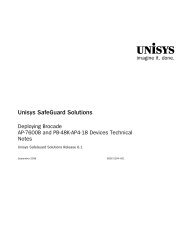
environment. Figure 2–1 illustrates a basic geographic clustered environmen nt that<br />
consists of two sites. In addition to server clusters, the typical configuration is made up<br />
of an RA cluster (RA 1 annd<br />
RA 2) at each of the two sites. However, multiple e RA cluster<br />
configurations are also poossible.<br />
Note: The dashed liness<br />
in Figure 2–1 represent the server WAN connections.<br />
To<br />
simplify the view, redunddant<br />
and physical connections are not shown.<br />
Figure 2–11.<br />
Basic Geographic Clustered Environment t<br />
68 872 5688–002
Data Flow<br />
Write<br />
Overview<br />
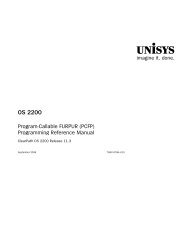
Figure 2–2 shows the data flow in the basic system configuration for data written by the<br />
server. The system replicates the data in snapshot replication mode to a remote site.<br />
The data flow is divided into the following segments: write, transfer, and distribute.<br />
Figure 2–2. Data Flow<br />
The flow of data for a write transaction is as follows:<br />
1. The host writes data to the splitter (either on the host or the fabric) that immediately<br />
sends it to the RA and to the production site replication volume (storage system).<br />
2. After receiving the data, the RA returns an acknowledgement (ACK) to the splitter.<br />
The storage system returns an ACK after successfully writing the data to storage.<br />
3. The splitter sends an ACK to the host that the write operation has been completed<br />
successfully.<br />
In snapshot replication mode, this sequence of events (steps 1 to 3) can be repeated<br />
multiple times before the snapshot is closed.<br />
6872 5688–002 2–3
Overview<br />
Transfer<br />
Distribute<br />
The flow of data for transfer is as follows:<br />
1. After processing the snapshot data (that is, applying the various compression<br />
techniques), the RA sends the snapshot over the WAN to its peer RA at the remote<br />
site.<br />
2. The RA at the remote site writes the snapshot to the journal. At the same time, the<br />
remote RA returns an ACK to its peer at the production site.<br />
Note: Alternatively, you can set an advanced policy parameter so that lag is<br />
measured to the journal. In that case, the RA at the target site returns an ACK to its<br />
peer at the source site only after it receives an ACK from the journal (step 3).<br />
3. After the complete snapshot is written to the journal, the journal returns an ACK to<br />
the RA.<br />
When possible, and unless instructed otherwise, the Unisys <strong>SafeGuard</strong> 30m solution<br />
proceeds at first opportunity to “distribute” the image to the appropriate location on the<br />
storage system at the remote site. The logical flow of data for distribution is as follows:<br />
1. The remote RA reads the image from the journal.<br />
2. The RA reads existing information from the relevant remote replication volume.<br />
3. The RA writes “undo” information (that is, information that can support a rollback, if<br />
necessary) to the journal.<br />
Note: Steps 2 and 3 are skipped when the maximum journal lag policy parameter<br />
causes distribution to operate in fast-forward mode.<br />
(See the Unisys <strong>SafeGuard</strong> <strong>Solutions</strong> Replication Appliance Administrator’s <strong>Guide</strong> for<br />
more information.)<br />
4. The RA writes the image to the appropriate remote replication volume.<br />
Alternatives to the basic system architecture<br />
The following are derivatives of the basic system architecture:<br />
Fabric Splitter<br />
An intelligent fabric switch can perform the splitting function instead of a Unisys<br />
<strong>SafeGuard</strong> <strong>Solutions</strong> host-based Splitter installed on the host. In this case, the host<br />
sends a single write transaction to the switch on its way to storage. At the switch,<br />
however, the message is split, with a copy sent also to RA (as shown in Figure 2–3). The<br />
system behaves the same way as it does when using a Unisys <strong>SafeGuard</strong> <strong>Solutions</strong><br />
host-based splitter on the host to perform the splitting function.<br />
2–4 6872 5688–002
Figure 2–3. Data Flow with Fabric Splitter<br />
Local Replication by CDP<br />
Overview<br />
You can use CDP to perform replication over short distances—that is, to replicate<br />
storage at the same site as CRR does over long distances. Operation of the system is<br />
similar to CRR including the ability to use the journal to recover from a corrupted data<br />
image, and the ability, if necessary, to fail over to the remote side or storage pool. In<br />
Figure 2–4, there is no WAN, the storage pools are part of the storage at the same site,<br />
and the same RA appears in each of the segments.<br />
6872 5688–002 2–5
Overview<br />
Figure 2–4. Data flow in CDP<br />
Note: The repository volume must belong to remote-side storage pool. Unisys<br />
<strong>SafeGuard</strong> <strong>Solutions</strong> support a simultaneous mix of groups for remote and local<br />
replication. Individual volumes and groups, however, must be designated for either<br />
remote or local replication, but not for both. Certain policy parameters do not apply for<br />
local replication by CDP.<br />
Single RA<br />
Note: Unisys <strong>SafeGuard</strong> <strong>Solutions</strong> does not support single RA configuration (at both<br />
sites or at a single site).<br />
2–6 6872 5688–002
Diagnostic Tools and Capabilities<br />
Event Log<br />
Overview<br />
The Unisys <strong>SafeGuard</strong> 30m solution offers the following tools and capabilities to help<br />
you diagnose and solve problems.<br />
The replication capability of the Unisys <strong>SafeGuard</strong> 30m solution records log entries in<br />
response to a wide range of predefined events. The event log records all significant<br />
events that have recently occurred in the system. Appendix E lists and explains the<br />
events.<br />
Each event is classified by an event ID. The event ID can be used to help analyze or<br />
diagnose system behavior, including identifying the trigger for a rolling problem,<br />
understanding a sequence of events, and examining whether the system performed the<br />
correct set of actions in response to a component failure.<br />
You can monitor system behavior by viewing the event log through the management<br />
console, by issuing CLI commands, or by reading RA logs. The exact period of time<br />
covered by the log varies according to the operational state of the environment during<br />
that period or, in the case of RA logs, the time period that was specified. The capacity of<br />
the event log is 5000 events.<br />
For problems that are not readily apparent and for situations that you are monitoring for<br />
failure, you can configure an e-mail notification to send all logs to you in a daily summary.<br />
Once you resolve the problem, you can remove the event notifications. See “Configuring<br />
a Diagnostic E-mail Notification” in this section to configure a daily summary of events.<br />
System Status<br />
The management console displays an immediate indication of any problem that<br />
interferes with normal operation of the Unisys <strong>SafeGuard</strong> 30m environment. If a<br />
component fails, the indication is accompanied by an error message that provides<br />
detailed information about the failure.<br />
6872 5688–002 2–7
Overview<br />
You must log in to the management console to monitor the environment and to view<br />
events. The RAs are preconfigured with the users defined in Table 2–1.<br />
Table 2–1. User Types<br />
User Initial Password Permissions<br />
boxmgmt boxmgmt Install<br />
admin admin All except install and<br />
webdownload<br />
monitor monitor Read only<br />
webdownload webdownload webdownload<br />
SE Unisys(CSC) All except install and<br />
webdownload<br />
Note: The password boxmgmt is not used to log in to the management console; it is<br />
only used for SSH sessions.<br />
The CLI provides all users with status commands for the complete set of Unisys<br />
<strong>SafeGuard</strong> 30m components. You can use the information and statistics provided by<br />
these commands to identify bottlenecks in the system.<br />
E-mail Notifications<br />
The e-mail notification mechanism sends specified event notifications (or alerts) to<br />
designated individuals. Also, you can set up an e-mail notification for once a day that<br />
contains a daily summary of events.<br />
Configuring a Diagnostic E-mail Notification<br />
1. From the management console, click Alert Settings on the System menu.<br />
2. Under Rules, click Add.<br />
3. Using the diagnostic rule, select the appropriate topic, level, and type options.<br />
Diagnostic Rule<br />
This rule sends all messages on a daily basis to personnel of your choice.<br />
Topics: All Topics<br />
Level: Information<br />
Scope: Detailed<br />
Type Daily<br />
4. Under Addresses, click Add.<br />
2–8 6872 5688–002
Overview<br />
5. In the New Address box, type the e-mail address to which you would like event<br />
notifications sent. You can specify more than one e-mail address.<br />
6. Click OK.<br />
7. Repeat steps 4 through 6 for each additional e-mail recipient.<br />
8. Click OK.<br />
9. Click OK.<br />
Installation Diagnostics<br />
The Diagnostics menu of the Installation Manager provides a suite of diagnostic tools for<br />
testing the functionality and connectivity of the installed RAs and Unisys <strong>SafeGuard</strong> 30m<br />
components. Appendix C explains how to use the Installation Manager diagnostics.<br />
Installation Manager is also used to collect RA logs and host splitter logs from one<br />
centralized location. See Appendix A for more information about collecting logs.<br />
Host Information Collector (HIC)<br />
Cluster Logs<br />
The HIC collects extensive information about the environment, operation, and<br />
performance of any server on which a splitter has been installed. You can use the<br />
Installation Manager to collect logs across the entire environment including RAs and all<br />
servers on which the HIC feature is enabled. The HIC can also be used at the server. See<br />
Appendix A for more information about collecting logs.<br />
In a geographic clustered environment, MSCS maintains logs of events for the clustered<br />
environment. Analyzing these logs is helpful in diagnosing certain problems. Appendix I<br />
explains how to analyze these logs.<br />
Unisys <strong>SafeGuard</strong> 30m Collector<br />
The Unisys <strong>SafeGuard</strong> 30m Collector utility enables you to easily collect various pieces of<br />
information about the environment that can help in solving problems. Appendix G<br />
describes this utility.<br />
RA Diagnostics<br />
Diagnostics specific to the RAs are available to aid in identifying problems. Appendix B<br />
explains how to use the RA diagnostics.<br />
Hardware Indicators<br />
Hardware problems—for example, RA disk failures or RA power problems—are<br />
identified by status LEDs located on the RAs themselves. Several indicators are<br />
explained in Section 8, “Solving Replication Appliance (RA) Problems.”<br />
6872 5688–002 2–9
Overview<br />
SNMP <strong>Support</strong><br />
kutils Utility<br />
The RAs support monitoring and problem notification using standard SNMP, including<br />
support for SNMPv3. You can use SNMP queries to the agent on the RA. Also, you can<br />
configure the environment such that events generate SNMP traps that are then sent to<br />
designated hosts. Appendix F explains how to configure and use SNMP traps.<br />
The kutils utility is a proprietary server-based program that enables you to manage server<br />
splitters across all platforms. The command-line utility is installed automatically when the<br />
Unisys <strong>SafeGuard</strong> 30m splitter is installed on the application server. If the splitting<br />
function is not on a host but rather is on an intelligent switch, the kutils utility is copied<br />
from the Splitter CD-ROM. (See the Unisys <strong>SafeGuard</strong> <strong>Solutions</strong> Planning and Installation<br />
<strong>Guide</strong> for more information.)<br />
Appendix H explains some kutils commands that are helpful in troubleshooting<br />
problems. See the Unisys <strong>SafeGuard</strong> <strong>Solutions</strong> Replication Appliance Administrator’s<br />
<strong>Guide</strong> for complete reference information on the kutils utility.<br />
Discovering Problems<br />
Symptoms of problems and notifications occur in various ways with the Unisys<br />
<strong>SafeGuard</strong> 30m solution. The tools and capabilities described previously provide<br />
notifications for some conditions and events. Other problems are recognized from<br />
failures. Problems might be noted in the following ways:<br />
• Problems with data because of a rolling disaster, which means that the site needs to<br />
use a previous snapshot to recover<br />
• Problems with applications failing<br />
• Inability to switch processing to the remote or secondary site<br />
• Problems with the MSCS cluster (such as a failover to another cluster or site)<br />
• Problems reported in an e-mail notification from an RA<br />
• Problem reported in an SNMP trap notification<br />
• Problems listed on the management console as reported in the overall system status<br />
or in group state or properties<br />
• Problems reported in the daily summary of events<br />
In this guide, symptoms and notifications are often listed with potential problems.<br />
However, the messages and notifications vary based on the problem, and multiple<br />
events and notifications are possible at any given time.<br />
Events That Cause Journal Distribution<br />
Certain conditions might occur that can prevent access to the expected journal image.<br />
For instance, images might be flushed or distributed so that they are not available. Table<br />
2–2 lists events that might cause the images to be unavailable. For tables listing all<br />
events, see Appendix E.<br />
2–10 6872 5688–002
Table 2–2. Events That Cause Journal Distribution<br />
Event ID Level Scope Description Trigger<br />
4042 Info Detailed Group deactivated.<br />
(Group , RA<br />
)<br />
4062 Info Detailed Access enabled to<br />
latest image. (Group<br />
, Failover site<br />
)<br />
4097 Warning Detailed Maximum journal lag<br />
exceeded.<br />
Distribution in fastforward—older<br />
images removed from<br />
journal. (Group<br />
)<br />
4099 Info Detailed Initializing in long<br />
resynchronization<br />
mode. (Group<br />
)<br />
<strong>Troubleshooting</strong> Procedures<br />
Overview<br />
A user action deactivated<br />
the group.<br />
Access was enabled to<br />
the latest image during<br />
automatic failover.<br />
Fast-forward action<br />
started and caused the<br />
snapshots taken before<br />
the fast-forward action to<br />
be lost and the maximum<br />
journal lag to be<br />
exceeded.<br />
The system started a long<br />
resynchronization<br />
For troubleshooting, you must differentiate between problems that arise from<br />
environmental changes, network changes (cabling, routing and port blocking), or those<br />
changes related to zoning, logical unit number (LUN) masking, other devices in the SAN,<br />
and storage failures and problems that arise from misconfiguration or internal errors in<br />
the environmental setup.<br />
Refer to the preceding diagrams as you consider the general troubleshooting procedures<br />
that follow. Use the following four general tasks to help you identify symptoms and<br />
causes whenever you encounter a problem.<br />
Identifying the Main Components and Connectivity of the<br />
Configuration<br />
Knowledge of the main system components and the connectivity between these<br />
components is a key to understanding how the entire environment operates. This<br />
knowledge helps you understand where the problem exists in the overall system context<br />
and can help you correctly identify which components are affected.<br />
6872 5688–002 2–11
Overview<br />
Identify the following components:<br />
• Storage device, controller, and the configuration of connections to the Fibre Channel<br />
(FC) switch<br />
• Switch and port types, and their connectivity<br />
• Network configuration (WAN and LAN): IP addresses, routing schemes, subnet<br />
masks, and gateways<br />
• Participating servers: operating system, host bus adapters (HBAs), connectivity to<br />
the FC switch<br />
• Participating volumes: repository volumes, journal volumes, and replication volumes<br />
Understanding the Current State of the System<br />
Use the management console and the CLI get commands to understand the current<br />
state of the system:<br />
• Is there any component which is shown to be in an error state?<br />
If so, what is the error? Is it down, disconnected from any other components?<br />
• What is the state of the groups, splitters, volumes, transfer, and distribution?<br />
• Is the current state stable or changing within intervals of time?<br />
Verifying the System Connectivity<br />
To verify the system connectivity, use physical and tool-based verification methods to<br />
answer the following questions:<br />
• Are all the components physically connected? Are the activity or link lights active?<br />
• Are the components connected to the correct switch or switches? Are they<br />
connected to the correct ports?<br />
• Is there connectivity over the WAN between all appliances? Is there connectivity<br />
between the appliances on the same site over the management network?<br />
2–12 6872 5688–002
Analyzing the Configuration Settings<br />
Many problems occur because of improper configuration settings such as improper<br />
zoning. Analyze the configuration settings to ensure they are not the cause of the<br />
problem.<br />
Overview<br />
• Are the zones properly configured?<br />
− Splitter-to-storage?<br />
− Splitter-to-RA?<br />
− RA-to-storage?<br />
− RA-to-RA?<br />
• Are the zones in the switch config?<br />
• Has the proper switch config been applied?<br />
• Are the LUNs properly masked?<br />
− Is the splitter masked to see only the relevant replication volume or volumes?<br />
− Are the RAs masked to see the relevant replication volume or volumes,<br />
repository volume, and journal volume or volumes?<br />
• Are the network settings (such as gateway) for the RAs correct?<br />
• Are there any possible IP conflicts on the network?<br />
6872 5688–002 2–13
Overview<br />
2–14 6872 5688–002
Section 3<br />
Recovering in a Geographic Replication<br />
Environment<br />
This section provides recovery procedures so that user applications can be online as<br />
quickly as possible in a geographic replication environment.<br />
An older image might be required to recover from a rolling disaster, human error, a virus,<br />
or any other failure that corrupts the latest snapshot image. Ensure that the image is<br />
tested prior to reversing direction.<br />
Complete the procedures for each group that needs to be moved based on the type of<br />
hosts in the environment:<br />
• Manual Failover of Volumes and Data Consistency Groups<br />
• Manual Failover of Volumes and Data Consistency Groups for ClearPath MCP Hosts<br />
Refer to the Unisys <strong>SafeGuard</strong> <strong>Solutions</strong> Replication Appliance Administrator’s <strong>Guide</strong> for<br />
more information on logged and virtual (with roll or without roll) access modes. For<br />
specific environments, refer to the best practices documents listed under <strong>SafeGuard</strong><br />
<strong>Solutions</strong> documentation on the Unisys Product <strong>Support</strong> Web site,<br />
www.support.unisys.com<br />
6872 5688–002 3–1
Recovering in a Geographic Replication Environment<br />
Manual Failover of Volumes and Data Consistency<br />
Groups<br />
When you need to perform a manual failover of volumes and data consistency groups,<br />
complete the following tasks:<br />
1. Accessing an image<br />
2. Testing the selected image<br />
Accessing an Image<br />
1. From the Management Console, select any one of the data consistency groups<br />
on the navigation pane.<br />
2. Select the Status tab, (if it is not opened.)<br />
3. Perform the following steps to allow access to the target image:<br />
a. Right-click the Consistency Group and select Pause Transfer. Click Yes<br />
when the system prompts that the group activity will be paused.<br />
b. Right-click the Consistency Group and scroll down.<br />
c. Select the Remote Copy name and click Enable Image Access.<br />
The Enable Image Access dialog box appears.<br />
d. Choose Select an image from the list and click Next.<br />
The Select Explicit Image dialog box appears and displays the available<br />
images.<br />
e. Select the desired image from the list and click Next.<br />
The Image Access Mode dialog box appears.<br />
f. Select the option Logged access (physical) and click Next.<br />
The Summary screen displays the Image name and the Image Access mode.<br />
g. Click Finish.<br />
Note: This process might take a long time to complete depending on the value<br />
of the journal lag setting in the group policy of the consistency group. The<br />
following message appears during the process:<br />
Enabling log access<br />
h. Verify the target image name displayed below the bitmap in the components<br />
pane under the Status tab.<br />
Transfer:Paused displays at the bottom in the Status tab under the<br />
components pane.<br />
3–2 6872 5688–002
Testing the Selected Image at Remote Site<br />
Recovering in a Geographic Replication Environment<br />
Perform the following steps to test the selected image at the remote site:<br />
1. Run the following batch file to mount a volume at the remote site. If necessary,<br />
modify the program files\kdriver path to fit your environment.<br />
@echo off<br />
cd "c:\program files\kdriver\kutils"<br />
"c:\program files\kdriver\kutils\kutils.exe" umount e:<br />
"c:\program files\kdriver\kutils\kutils.exe" mount e:<br />
2. Repeat step 1 for all volumes in the group.<br />
3. Ensure that the selected image is valid:<br />
• all applications start successfully using the selected image<br />
• the data in the image is consistent and valid<br />
For example, you might want to test whether you can start a database application on<br />
this image. You might also want to run proprietary test procedures to validate the<br />
data.<br />
4. Skip to “Unmounting Volumes at Production site and Reversing Replication<br />
Direction” if you have tested the validity of the image and the test is successful. If<br />
the test is unsuccessful, continue with step 5.<br />
5. To test a different image, perform the procedure “Unmounting the Volumes and<br />
Disabling the Image Access at Remote site.”<br />
Unmounting the Volumes and Disabling the Image Access at Remote<br />
Site<br />
1. Before choosing another image, unmount the volume using the following batch file.<br />
If necessary, modify the program files/kdriver path to fit your environment.<br />
@echo off<br />
cd "c:\program files\kdriver\kutils"<br />
"c:\program files\kdriver\kutils\kutils.exe" flushFS e:<br />
"c:\program files\kdriver\kutils.exe" umount e:<br />
2. Repeat step 1 for all volumes in the group.<br />
3. Select one of the Consistency Groups in the navigation pane on the<br />
Management Console.<br />
4. Right-click the Consistency Group and scroll down.<br />
5. Select the Remote Copy name and click Disable Image Access.<br />
6. Click Yes when the system prompts you to ensure that all group volumes are<br />
unmounted.<br />
7. Repeat the procedures “Accessing an Image” and “Testing the Selected Image at<br />
the Remote Site”.<br />
6872 5688–002 3–3
Recovering in a Geographic Replication Environment<br />
Unmounting the Volumes at Production Site and Reversing<br />
Replication Direction<br />
Perform these steps at the host:<br />
1. To unmount a volume at the production site, run the following batch file. If<br />
necessary, modify the program files\kdriver path to fit your environment.<br />
@echo off<br />
cd "c:\program files\kdriver\kutils"<br />
"c:\program files\kdriver\kutils\kutils.exe" flushFS e:<br />
"c:\program files\kdriver\kutils\kutils.exe" umount e:<br />
2. Repeat step 1 for all volumes in the group.<br />
Perform these steps on the Management Console:<br />
1. Select a Consistency Group from the navigation pane.<br />
2. Right-click the Group and select Pause Transfer. Click Yes when the system<br />
prompts that the group activity will be paused.<br />
3. Click the Status tab. The status of the transfer must display Paused.<br />
4. Right-click the Consistency group and select Failover to .<br />
5. Click Yes when the system prompts you to confirm failover.<br />
6. Ensure that the Start data transfer immediately check box is selected.<br />
The following warning message appears:<br />
Warning: Journal will be erased. Do you wish to continue?<br />
7. Click Yes to continue.<br />
3–4 6872 5688–002
Recovering in a Geographic Replication Environment<br />
Manual Failover of Volumes and Data Consistency<br />
Groups for ClearPath MCP Hosts<br />
When you need to perform a manual failover of volumes and data consistency groups,<br />
complete the following tasks:<br />
1. Accessing an image<br />
2. Testing the selected image<br />
Note: For ClearPath MCP hosts, close and free units at the remote site before<br />
completing the following procedures. This action prevents SCSI Reserved errors being<br />
logged to units that are no longer accessible.<br />
Accessing an Image<br />
Quiescence any databases before accessing an image. Once the pack has failed over<br />
and has been acquired, resume the databases.<br />
If the volumes to be failed over are not in use by a database, issue the CLOSE PK<br />
command from the operator display terminal (ODT) to close the<br />
volumes.<br />
For more information on how to access an image, refer to the procedures,<br />
“Accessing an Image under Manual Failover of Volumes” and “Data Consistency<br />
Groups”.<br />
Testing the Selected Image at Remote Site<br />
1. Mount a volume at the remote site by issuing the ACQUIRE PK <br />
command from the remote site ODT to acquire the unit. Also acquire any controls<br />
necessary to access the unit if these controls are not automatically acquired.<br />
Verify that the MCP can access the volume using commands such as SC– and P PK<br />
to display the status of the peripherals.<br />
2. Repeat step 1 for all volumes in the group.<br />
3. Ensure that the selected image is valid; that is, verify that<br />
• All applications start successfully using the selected image.<br />
• The data in the image is consistent and valid.<br />
For example, you might want to test whether you can start a database application on<br />
this image. You might also want to run proprietary test procedures to validate the<br />
data.<br />
4. If you tested the validity of the image and the test completed successfully, skip to<br />
“Unmounting Volumes and Reversing Replication Direction at Production site.” If the<br />
testing is not successful, continue with step 5.<br />
5. To test a different image, perform the procedure “Unmounting the Volumes and<br />
Disabling the Image Access at Remote Site.”<br />
6872 5688–002 3–5
Recovering in a Geographic Replication Environment<br />
Unmounting the Volumes and Disabling the Image Access at Remote<br />
Site<br />
1. Before choosing another image, unmount the volume by issuing the CLOSE PK<br />
command followed by the FREE PK command from<br />
the ODT. Verify that the units are closed and freed using peripheral status<br />
commands.<br />
2. Repeat step 1 for all volumes in the group.<br />
3. Click the Status tab. The status of the transfer must display Paused.<br />
4. Right-click the Consistency group and select Failover to .<br />
5. Click Yes when the system prompts you to confirm failover.<br />
6. Ensure that the Start data transfer immediately check box is selected.<br />
The following warning message appears:<br />
Warning: Journal will be erased. Do you wish to continue?<br />
7. Click Yes to continue.<br />
Unmounting the Volumes at Source Site and Reversing Replication<br />
Direction<br />
Perform these steps at the source site host:<br />
1. Unmount a volume at the source site by issuing the CLOSE PK <br />
command followed by the FREE PK command from the ODT to close<br />
and free the volume.<br />
If the site is down when the host is recovered, use the FREE PK <br />
command to free the original source units. In response to inquiry commands, the<br />
status of the original source units is “closed.” Free the units to prevent access by<br />
the original source site host.<br />
2. Repeat step 1 for all volumes in the group.<br />
3. Select a Consistency Group from the navigation pane.<br />
4. Right-click the Group and select Pause Transfer. Click Yes when the system<br />
prompts that the group activity will be paused.<br />
5. Click the Status tab. The status of the transfer must display Paused.<br />
6. Right-click the Consistency group and select Failover to .<br />
7. Click Yes when the system prompts you to confirm failover.<br />
8. Ensure that the Start data transfer immediately check box is selected.<br />
The following warning message appears:<br />
Warning: Journal will be erased. Do you wish to continue?<br />
9. Click Yes to continue.<br />
3–6 6872 5688–002
Section 4<br />
Recovering in a Geographic Clustered<br />
Environment<br />
This section provides information and procedures that relate to geographic clustered<br />
environments running Microsoft Cluster Service (MSCS).<br />
Checking the Cluster Setup<br />
To ensure that the cluster configuration is correct, check the MSCS properties and the<br />
network bindings. For more detailed information, refer to “<strong>Guide</strong> to Creating and<br />
Configuring a Server Cluster under Windows Server 2003”, which you can download at<br />
MSCS Properties<br />
http://www.microsoft.com/downloads/details.aspx?familyid=96F76ED7-9634-4300-<br />
9159-89638F4B4EF7&displaylang=en<br />
To check the MSCS properties, enter the following command from the command<br />
prompt:<br />
Cluster /prop<br />
Output similar to the following is displayed:<br />
T Cluster Name Value<br />
-- -------------------- ------------------------------ -----------------------<br />
M AdminExtensions {4EC90FB0-D0BB-11CF-B5EF-0A0C90AB505}<br />
D DefaultNetworkRole 2 (0x2)<br />
S Description<br />
B Security 01 00 14 80 ... (148 bytes)<br />
B Security Descriptor 01 00 14 80 ... (148 bytes)<br />
M Groups\AdminExtensions<br />
M Networks\AdminExtensions<br />
M NetworkInterfaces\AdminExtensions<br />
M Nodes\AdminExtensions<br />
M Resources\AdminExtensions<br />
M ResourceTypes\AdminExtensions<br />
D EnableEventLogReplication 0 (0x0)<br />
D QuorumArbitrationTimeMax 300 (0x12c)<br />
D QuorumArbitrationTimeMin 15 (0xf)<br />
D DisableGroupPreferredOwnerRandomization 0 (0x0)<br />
D EnableEventDeltaGeneration 1 (0x1)<br />
D EnableResourceDllDeadlockDetection 0 (0x0)<br />
D ResourceDllDeadlockTimeout 240 (0xf0)<br />
D ResourceDllDeadlockThreshold 3 (0x3)<br />
D ResourceDllDeadlockPeriod 1800 (0x708)<br />
D ClusSvcHeartbeatTimeout 60 (0x3c)<br />
D HangRecoveryAction 3 (0x3)<br />
6872 5688–002 4–1
Recovering in a Geographic Clustered Environment<br />
If the properties are not set correctly, use one of the following commands to correct the<br />
settings.<br />
Majority Node Set Quorum<br />
Cluster /prop HangRecoveryAction=3<br />
Cluster /prop EnableEventLogReplication=0<br />
Shared Quorum<br />
Cluster /prop QuorumArbitrationTimeMax=300 (not for majority node set)<br />
Network Bindings<br />
Cluster /prop QuorumArbitrationTimeMin=15<br />
Cluster /prop HangRecoveryAction=3<br />
Cluster /prop EnableEventLogReplication=0<br />
The following binding priority order and settings are suggested as best practices for<br />
clustered configurations. These procedures assume that you can identify the public and<br />
private networks by the connection names that are referenced in the steps.<br />
Host-Specific Network Bindings and Settings<br />
1. Open the Network Connections window.<br />
2. On the Advanced menu, click Advanced Settings.<br />
3. Select the Networks and Bindings tab.<br />
This tab shows the binding order in the upper pane and specific connection<br />
properties in the lower pane.<br />
4. Verify that the public network connection is above the private network in the binding<br />
list in the upper pane.<br />
If it is not, follow these steps to change the order:<br />
a. Select a network connection in the binding list in the upper pane.<br />
b. Use the arrows to the right to move the network connection up or down in the<br />
list as appropriate.<br />
5. Select the private network in the binding list. In the lower pane, verify that the File<br />
and Print Sharing for Microsoft Networks and the Client for Microsoft<br />
Networks check boxes are cleared for the private network.<br />
6. Click OK.<br />
7. Highlight the public connections, then right-click and click Properties.<br />
8. Select Internet (TCP.IP) in the list, and click Properties.<br />
9. Click Advanced.<br />
10. Select the WINS tab.<br />
4–2 6872 5688–002
Recovering in a Geographic Clustered Environment<br />
11. Ensure that Enable LM/Hosts lookup is selected.<br />
12. Ensure that Disable NetBIOS over TCP/IP is selected.<br />
13. Repeat steps 7 through 12 for the private network connection.<br />
Cluster-Specific Network Bindings and Settings<br />
1. Open the Cluster Administrator.<br />
2. Right-click the cluster (the top node in the tree structure in the left pane and click<br />
Properties.<br />
3. Select the Networks Priority tab.<br />
4. Ensure that the private network is at the top of the list and that the public network is<br />
below the private network.<br />
If it is not, follow these steps to change the order:<br />
a. Select the private network.<br />
b. Use the command button at the right to move up the private network up in the<br />
list as appropriate.<br />
5. Select the private network, and click Properties.<br />
6. Verify that the Enable this network for cluster use check box is selected and<br />
that Internal cluster communications only (private network) is selected.<br />
7. Click OK.<br />
8. Select the public network, and click Properties.<br />
9. Verify that the Enable this network for cluster use check box is selected and<br />
that All communications (mixed network) is selected.<br />
10. Click OK.<br />
Group Initialization Effects on a Cluster<br />
Move-Group Operation<br />
The following conditions affect failover times for a cluster move-group operation. A<br />
cluster move-group operation cannot complete if a lengthy consistency group<br />
initialization, such as a full-sweep initialization, long resynchronization, or initialization<br />
from marking mode, is executing in the background. Review these conditions and plan<br />
accordingly.<br />
6872 5688–002 4–3
Recovering in a Geographic Clustered Environment<br />
Full-Sweep Initialization<br />
A full-sweep initialization occurs when the disks on both sites are scanned or read in<br />
their entirety and a comparison is made, using checksums, to check for differences. Any<br />
differences are then replicated from the Production site disk to the remote site disk. A<br />
full-sweep initialization generates an entry in the management console log.<br />
A full-sweep initialization occurs in the following circumstances:<br />
• Disabling or enabling a group<br />
Disabling a group causes all disk replication in the group to stop. A full-sweep<br />
initialization is performed once the group is enabled. The full-sweep initialization<br />
guarantees that the disks are consistent between the sites.<br />
• Adding a new splitter server or host that has access to the disks in the group<br />
When adding a new splitter to the replication, there is a time before the splitter is<br />
added to the configuration when activity from this splitter to the disks is not being<br />
monitored or replicated. To guarantee that no write operations were performed by<br />
the new splitter before the splitter was configured in the replication, a full-sweep<br />
initialization is required for all groups that contain disks accessed by this splitter. This<br />
initialization is done automatically by the system.<br />
• Double failure of a main component<br />
When a double failure of a main component occurs, a full-sweep initialization is<br />
required to guarantee that consistency was maintained. The main components<br />
include the host, the replication appliance (RA), and the storage subsystem.<br />
Long Resynchronization<br />
A long resynchronization occurs when the data difference that needs to be replicated to<br />
the other site cannot fit on the journal volume. The data is split into multiple snapshots<br />
for distribution to the other site, and all the previous snapshots are lost. Long<br />
resynchronization can be caused by long WAN outages, a group being disabled for a long<br />
time period, and other instances when replication has not been functional for a long time<br />
period.<br />
Long resynchronization is not connected with full-sweep initialization and can also<br />
happen during initialization from marking (see “Initialization from Marking Mode”). It is<br />
dependant only on the journal volume size and the amount of data to be replicated.<br />
A long resynchronization is identified in the Status Tab in Components Pane under<br />
the remote journal bitmap in the management console. The status Performing Long<br />
Resync is visible for the group that is currently performing a long resynchronization.<br />
4–4 6872 5688–002
Initialization from Marking Mode<br />
Recovering in a Geographic Clustered Environment<br />
All other instances of initialization in the replication are caused by marking. The marking<br />
mode refers to a replication mode in which the location of “dirty,” or changed, data is<br />
marked in a bitmap on the repository volume. This bitmap is a standard size—no matter<br />
how much data changes or what size disks are being monitored—so the repository<br />
volume cannot fill up during marking.<br />
The replication moves to marking mode when replication cannot be performed normally,<br />
such as during WAN outages. This marking mode guarantees that all data changes are<br />
still being recorded until replication is functioning normally. When replication can perform<br />
normally again, the RAs read the dirty, or changed, data from the source disk based on<br />
data recorded in the bitmap and replicates it to the disk on the remote site. The length of<br />
time for this process to complete depends on the amount of dirty, or changed, data as<br />
well as the performance of other components in the configuration, such as bandwidth<br />
and the storage subsystem.<br />
A high-load state can also cause the replication to move to marking mode. A high-load<br />
state occurs when write activity to the source disks exceeds the limits that the<br />
replication, bandwidth, or remote disks can handle. Replication moves into marking<br />
mode at this time until the replication determines the activity has reached a level at<br />
which it can continue normal replication. The replication then exits the high-load state<br />
and an initialization from marking occurs.<br />
See Section 10, “Solving Performance Problems,” for more information on high-load<br />
conditions and problems.<br />
Behavior of <strong>SafeGuard</strong> 30m Control During a<br />
Move-Group Operation<br />
During a move-group operation, the Unisys <strong>SafeGuard</strong> 30m Control resource in a<br />
clustered environment behaves as follow. Be aware of this information when dealing<br />
with various failure scenarios.<br />
1. MSCS issues an offline request because of a failure with a group resource—for<br />
example, a physical disk—or an MSCS move group. The request is sent to the<br />
Unisys <strong>SafeGuard</strong> 30m Control resource on the node that owns the group.<br />
The MSCS resources that are dependent on the Unisys <strong>SafeGuard</strong> 30m Control<br />
resource, such as physical disk resources, are taken offline first. Taking the<br />
resources offline does not issue any commands to the RA.<br />
2. MSCS issues an online request to the Unisys <strong>SafeGuard</strong> 30m Control resource on<br />
the node to which a group was moved, or in the case of failure, to the next node in<br />
the preferred owners list.<br />
3. When the resource receives an online request from MSCS, the Unisys <strong>SafeGuard</strong><br />
30m Control resource issues two commands to control the access to disks:<br />
initiate_failover and verify_failover.<br />
6872 5688–002 4–5
Recovering in a Geographic Clustered Environment<br />
Initiate_Failover Command<br />
This command changes the replication direction from one site to another.<br />
• If a same-site failover is requested, the command completes successfully with<br />
no action performed by the RA.<br />
• The resource issues the verify_failover command to see if the RA performed<br />
the operations successfully.<br />
• If a different-site failover is requested, the RA starts changing direction between<br />
sites and returns successfully. In certain circumstances, the RA returns a failure<br />
when the WAN is down or a long resynchronization occurs.<br />
• If the RA returns a failure to the Unisys <strong>SafeGuard</strong> 30m Control resource, the<br />
resource logs the failure in the Windows application event log and retries the<br />
command continuously until the cluster pending timeout is reached. When a<br />
move-group operation fails to view events posted by the resource, check the<br />
application event log. The event source of the event entry is the 30m Control.<br />
Verify_Failover Command<br />
This command enables the Unisys <strong>SafeGuard</strong> 30m Control resource to determine<br />
the time at which the change of the replication direction completes.<br />
• If a same-site failover is requested, the command completes successfully with<br />
no action performed by the RA.<br />
• If a different-site failover is requested, the verify_failover command returns a<br />
pending status until the replication direction changes. The change of direction<br />
takes from 2 to 30 minutes.<br />
• When the verify_failover command completes, write access to the physical disk<br />
is enabled to the host from the RA and the splitter.<br />
• If the time to complete the verify_failover command is within the pending<br />
timeout, the Unisys <strong>SafeGuard</strong> 30m Control resource comes online followed by<br />
all the resources dependent on this resource.<br />
All dependent disks come online using the default physical disk timeout of an<br />
MSCS cluster. The physical disk is available to the physical disk resource<br />
immediately; there is no delay. Physical disk access is available when the Unisys<br />
<strong>SafeGuard</strong> 30m Control resource comes online. You do not need to change the<br />
default resource settings for the physical disk. However, the physical disk must<br />
be dependent on the Unisys <strong>SafeGuard</strong> 30m Control resource.<br />
• If the time to complete the verify_failover command is longer than the pending<br />
timeout of the Unisys <strong>SafeGuard</strong> 30m Control resource, MSCS fails this<br />
resource.<br />
The default pending timeout for a Unisys <strong>SafeGuard</strong> 30m Control resource is<br />
15 minutes or 900 seconds. This timeout occurs before the cluster disk timeout.<br />
4–6 6872 5688–002
Recovering in a Geographic Clustered Environment<br />
If you use the default retry value of 1, this resource issues the following<br />
commands:<br />
• Initiate_failover<br />
• Verify_failover<br />
• Initiate_failover<br />
• Verify_failover<br />
Using the default pending timeout, the Unisys <strong>SafeGuard</strong> 30m Control resource<br />
waits a total of 30 minutes to come online; this timeout period equals the<br />
timeout plus one retry. If the resource does not come online, MSCS attempts to<br />
move the group to the next node in the preferred owners list and then repeats<br />
this process.<br />
Recovering by Manually Moving an Auto-Data<br />
(Shared Quorum) Consistency Group<br />
An older image might be required to recover from a rolling disaster, human error, a virus,<br />
or any other failure that corrupts the latest snapshot image. It is impossible to recover<br />
automatically to an older image using MSCS because automatic cluster failover is<br />
designed to minimize data loss. The Unisys <strong>SafeGuard</strong> 30m solution always attempts to<br />
fail over to the latest image.<br />
Note: Manual image recovery is only for data consistency groups, not for the quorum<br />
group.<br />
To recover a data consistency group using an older image, you must complete the<br />
following tasks:<br />
• Take the cluster data group offline.<br />
• Perform a manual failover of an auto-data (shared quorum) consistency group to a<br />
selected image.<br />
• Bring the cluster group online and check the validity of the image.<br />
• Reverse the replication direction of the consistency group.<br />
Taking a Cluster Data Group Offline<br />
To take a group offline in the cluster for which you are performing a manual recovery,<br />
complete the following steps:<br />
1. Open Cluster Administrator on one of the nodes in the MSCS cluster.<br />
2. Right-click the group that you want to recover and click Take Offline.<br />
3. Wait until all resources in the group show the status as Offline.<br />
6872 5688–002 4–7
Recovering in a Geographic Clustered Environment<br />
Performing a Manual Failover of an Auto-Data (Shared Quorum)<br />
Consistency Group to a Selected Image<br />
1. Open the Management Console.<br />
2. Select a Consistency Group from the navigation pane.<br />
Note: Do not select the quorum group. The data consistency group you select<br />
should be the cluster data group that you took offline.<br />
4. Click the Policy tab on the selected Consistency Group.<br />
5. Scroll down and select Advanced in the Policy tab.<br />
6. In Global Cluster mode, select Manual (shared quorum) in the Global cluster<br />
mode list.<br />
7. Click Apply.<br />
8. Perform the following steps to access the image:<br />
a. Right-click the Consistency Group and select Pause Transfer. Click Yes<br />
when the system prompts that the group activity will be paused.<br />
b. Right-click the Consistency Group and scroll down.<br />
c. Select the Remote Copy name and click Enable Image Access.<br />
The Enable Image Access dialog box appears.<br />
d. Choose Select an image from the list and click Next.<br />
The Select Explicit Image dialog box appears and displays the available<br />
images.<br />
e. Select the desired image from the list and click Next.<br />
The Image Access Mode dialog box appears.<br />
f. Select the option Logged access (physical) and click Next.<br />
The Summary screen displays the Image name and the Image Access mode.<br />
g. Click Finish.<br />
Note: This process might take a long time to complete depending on the value<br />
of the journal lag setting in the group policy of the consistency group. The<br />
following message appears during the process:<br />
Enabling log access<br />
h. Verify the target image name displayed below the bitmap in the components<br />
pane under the Status tab.<br />
Transfer:Paused status appears at the bottom in the Status tab under the<br />
components pane.<br />
4–8 6872 5688–002
Recovering in a Geographic Clustered Environment<br />
Bringing a Cluster Data Group Online and Checking the Validity<br />
of the Image<br />
1. Open the Cluster Administrator window on the Management Console.<br />
2. Move the group to the node on the recovered site by right-clicking the group that<br />
you previously took offline and then clicking Move Group.<br />
• If the cluster has more than two nodes, a list of possible owner target nodes<br />
appears. Select the node to which you want to move the group.<br />
• If the cluster has only two nodes, the move starts immediately. Go to step 3.<br />
3. Bring the group online by right-clicking the group name and then clicking Bring<br />
Online.<br />
4. Ensure that the selected image is valid; that is, verify that<br />
• All applications start successfully using the selected image.<br />
• The data in the image is consistent and valid.<br />
For example, you might want to test whether you can start a database application on<br />
this image. You might also want to run proprietary test procedures to validate the<br />
data.<br />
5. If you tested the validity of the image and the test completed successfully, skip to<br />
“Reversing the Replication Direction of the Consistency Group.”<br />
6. If the validity of the image fails and you choose to test a different image, perform the<br />
following steps:<br />
a. To take the group offline, right-click the group name and then click Take<br />
Offline on the Cluster Administrator.<br />
b. Select one of the Consistency Groups in the navigation pane on the<br />
Management Console.<br />
c. Right-click the Consistency Group and scroll down.<br />
d. Select the Remote Copy name and click Disable Image Access.<br />
e. Click Yes when the system prompts you to ensure that all group volumes are<br />
unmounted.<br />
7. Perform the following steps if you want to choose a different image:<br />
a. Right-click the Consistency Group and select Pause Transfer. Click Yes<br />
when the system prompts that the group activity will be paused.<br />
b. Right-click the Consistency Group and scroll down.<br />
c. Select the Remote Copy name and click Enable Image Access.<br />
The Enable Image Access dialog box appears.<br />
d. Choose Select an image from the list and click Next.<br />
The Select Explicit Image dialog box appears and displays the available<br />
images.<br />
6872 5688–002 4–9
Recovering in a Geographic Clustered Environment<br />
e. Select the desired image from the list and click Next.<br />
The Image Access Mode dialog box appears.<br />
f. Select the option Logged access (physical) and click Next.<br />
The Summary screen displays the Image name and the Image Access mode.<br />
g. Click Finish.<br />
Note: This process might take a long time to complete depending on the value<br />
of the journal lag setting in the group policy of the consistency group. The<br />
following message appears during the process:<br />
Enabling log access<br />
h. Verify the target image name displayed below the bitmap in the components<br />
pane under Status tab.<br />
Transfer:Paused status appears at the bottom in the Status tab under the<br />
components pane.<br />
8. To bring the cluster group online, using the Cluster Administrator, right-click the<br />
group name and then click Online to.<br />
9. Ensure that the selected image is valid. Verify that<br />
• All applications start successfully using the selected image.<br />
• The data in the image is consistent and valid.<br />
For example, you might want to test whether you can start a database application on<br />
this image. You might also want to run proprietary test procedures to validate the<br />
data.<br />
10. If you tested the validity of the image and the test completed successfully, skip to<br />
“Reversing the Replication Direction of the Consistency Group.”<br />
11. If the image is not valid, repeat steps 6 through 9 as necessary.<br />
Reversing the Replication Direction of the Consistency Group<br />
1. Select the Consistency Group from the navigation pane.<br />
2. Right-click the Group and select Pause Transfer. Click Yes when the system<br />
prompts that the group activity will be paused.<br />
3. Click the Status tab. The status transfer must display Paused.<br />
4. Click the Policy tab and expand the Advanced Settings (if it is not expanded).<br />
5. Select Auto data (shared quorum) from the Global Cluster mode list.<br />
6. Right-click the Consistency Group and select Failover to .<br />
7. Click Yes when the system prompts you to confirm failover.<br />
4–10 6872 5688–002
6872 5688–002<br />
8. Ensure that thee<br />
Start data transfer immediately check box is s selected.<br />
The following wwarning<br />
message appears:<br />
Warning: JJournal<br />
will be erased. Do you wish to continue e?<br />
9. Click Yes to coontinue.<br />
Problem Description<br />
The following pointts<br />
describe the behavior of the components in this event:<br />
• When the quorum<br />
group is running on the site where the RAs faile ed (site 1), the<br />
cluster nodes oon<br />
site 1 fail because of quorum lost reservations, an nd cluster nodes<br />
on site 2 attempt<br />
to arbitrate for the quorum resource.<br />
• To prevent a “ssplit<br />
brain” scenario, the RAs assume that the other site is active<br />
when a WAN faailure<br />
occurs. (A WAN failure occurs if the RAs cannot<br />
communicate<br />
to at least one RA at the other site.)<br />
• When the MSCCS<br />
Reservation Manager on the surviving site (site 2)<br />
attempts the<br />
quorum arbitrattion<br />
request, the RA prevents access. Eventually, all cluster services<br />
stop and manuaal<br />
intervention is required to bring up the cluster service.<br />
Figure 4–1 illustratees<br />
this failure.<br />
Recovering in a Geographic Clustere ed Environment<br />
Recovery When All RAs Fail on Site 1 (Site 1<br />
Quorum Owner) )<br />
Figure 44–1.<br />
All RAs Fail on Site 1 (Site 1 Quorum Owner)<br />
O<br />
4–11
Recovering in a Geographic Clustered Environment<br />
Symptoms<br />
The following symptoms might help you identify this failure:<br />
• The management console display shows errors and messages similar to those for<br />
“Total Communication Failure in a Geographic Clustered Environment” in Section 7.<br />
• If you review the system event log, you find messages similar to the following<br />
examples:<br />
System Event Log for Usmv-East2 Host (Surviving Host)<br />
8/2/2008 1:35:48 PM ClusSvc Error Physical Disk Resource 1038 N/A USMV-WEST2 Reservation of<br />
cluster disk 'Disk Q:' has been lost. Please check your system and disk configuration.<br />
8/2/2008 1:35:48 PM Ftdisk Warning Disk 57 N/A USMV-WEST2 The system failed to flush data to<br />
the transaction log. Corruption may occur.<br />
System Event Log for Usmv-West2 (Failure Host)<br />
8/2/2008 1:35:48 PM ClusSvc Error Physical Disk Resource 1038 N/A USMV-WEST2 Reservation of<br />
cluster disk 'Disk Q:' has been lost. Please check your system and disk configuration.<br />
8/2/2008 1:35:48 PM Ftdisk Warning Disk 57 N/A USMV-WEST2 The system failed to flush data to<br />
the transaction log. Corruption may occur.<br />
• If you review the cluster log, you find messages similar to the following examples:<br />
Cluster Log for Usmv-East2 (Surviving Host)<br />
Attempted to try five times before the cluster timed-out. The entries recorded five times in the log:<br />
00000f90.00000620::2008/02/02-20:36:06.195 ERR Physical Disk : [DiskArb] GetPartInfo<br />
completed, status 170 (The requested resource is in use).<br />
00000f90.00000620::2008/02/02-20:36:06.195 ERR Physical Disk : [DiskArb] Failed to read<br />
(sector 12), error 170.<br />
00000f90.00000620::2008/02/02-20:36:08.210 ERR Physical Disk : [DiskArb] GetPartInfo<br />
completed, status 170.<br />
00000f90.00000620::2008/02/02-20:36:08.210 ERR Physical Disk : [DiskArb] Failed to write<br />
(sector 12), error 170.<br />
00000638.00000b10::2008/02/02-20:36:18.273 ERR [FM] Failed to arbitrate quorum resource c336021a-<br />
083e-4fa0-9d37-7077a590c206, error 170.<br />
00000638.00000b10::2008/02/02-20:36:18.273 ERR [RGP] Node 2: REGROUP ERROR: arbitration failed.<br />
00000638.00000b10::2008/02/02-20:36:18.273 ERR [CS] Halting this node to prevent an inconsistency<br />
within the cluster. Error status = 5892 (The membership engine requested shutdown of the cluster<br />
service on this node).<br />
00000684.000005a8::2008/02/02-20:37:53.473 ERR [JOIN] Unable to connect to any sponsor node.<br />
00000684.000005a8::2008/02/02-20:38:06.020 ERR [FM] FmGetQuorumResource failed, error 170.<br />
00000684.000005a8::2008/02/02-20:38:06.020 ERR [INIT] ClusterForm: Could not get quorum resource.<br />
No fixup attempted. Status = 5086 (The quorum disk could not be located by the cluster service).<br />
00000684.000005a8::2008/02/02-20:38:06.020 ERR [INIT] Failed to form cluster, status 5086 (The<br />
quorum disk could not be located by the cluster service).<br />
4–12 6872 5688–002
Cluster Log for Usmv-West2 (Failure Host)<br />
Recovering in a Geographic Clustered Environment<br />
00000d80.00000bbc::2008/02/02-20:31:21.257 ERR [FM] FmpSetGroupEnumOwner:: MM returned<br />
MM_INVALID_NODE, chose the default target<br />
00000da0.00000130::2008/02/02-20:35:48.395 ERR Physical Disk : [DiskArb]<br />
CompletionRoutine: reservation lost! Status 170 (The requested resource is in use)<br />
00000da0.00000130::2008/02/02-20:35:48.395 ERR [RM] LostQuorumResource, cluster service<br />
terminated...<br />
00000da0.00000b80::2008/02/02-20:35:49.145 ERR Network Name : Unable to open<br />
handle to cluster, status 1753 (There are no more endpoints available from the endpoint mapper).<br />
00000da0.00000c20::2008/02/02-20:35:49.145 ERR IP Address : WorkerThread:<br />
GetClusterNotify failed with status 6 (The handle is invalid).<br />
00000a04.00000a14::2008/02/02-20:37:23.456 ERR [JOIN] Unable to connect to any sponsor node.<br />
Attempted to try five times before the cluster timed-out, The entries recorded five times in the log:<br />
000001e4.00000598::2008/02/02-20:37:23.799 ERR Physical Disk : [DiskArb] GetPartInfo<br />
completed, status 170 (The resource is in use).<br />
000001e4.00000598::2008/02/02-20:37:23.831 ERR Physical Disk : [DiskArb] Failed to read<br />
(sector 12), error 170.<br />
000001e4.00000598::2008/02/02-20:37:23.831 ERR Physical Disk : [DiskArb] BusReset<br />
completed, status 31 (A device attached to the system is not functioning).<br />
000001e4.00000598::2008/02/02-20:37:23.831 ERR Physical Disk : [DiskArb] Failed to break<br />
reservation, error 31.<br />
00000a04.00000a14::2008/02/02-20:37:25.830 ERR [FM] FmGetQuorumResource failed, error 31.<br />
00000a04.00000a14::2008/08/02-20:37:25.830 ERR [INIT] ClusterForm: Could not get quorum resource.<br />
No fixup attempted. Status = 5086 (The quorum disk could not be located by the cluster service).<br />
00000a04.00000a14::2008/02/02-20:37:25.830 ERR [INIT] Failed to form cluster, status 5086 (The<br />
quorum disk could not be located by the cluster service).<br />
00000a04.00000a14::2008/02/02-20:37:25.830 ERR [CS] ClusterInitialize failed 5086<br />
00000a04.00000a14::2008/02/02-20:37:25.846 ERR [CS] Service Stopped. exit code = 5086<br />
Actions to Resolve the Problem<br />
If all RAs on site 1 fail and site 1 owns the quorum resource, perform the following tasks<br />
to recover:<br />
1. Disable MSCS on all nodes at the site with the failed RAs.<br />
2. Perform a manual failover of the quorum consistency group.<br />
3. Reverse replication direction.<br />
4. Start MSCS on a node on the surviving site.<br />
5. Complete the recovery process.<br />
6872 5688–002 4–13
Recovering in a Geographic Clustered Environment<br />
Caution<br />
Manual recovery is required only if the quorum device is lost because of a<br />
failure of an RA cluster.<br />
Before you bring the remote site online and before you perform the manual<br />
recovery procedure, ensure that MSCS is stopped and disabled on the cluster<br />
nodes at the production site (site 1 in this case). You must verify the server<br />
status with a network test.<br />
Improper use of the manual recovery procedure can lead to an inconsistent<br />
quorum disk and unpredictable results that might require a long recovery<br />
process.<br />
Disabling MSCS<br />
Stop MSCS on each node at the site where the RAs failed by completing the following<br />
steps:<br />
1. In the Control Panel, point to Administrative Tools, and then click Services.<br />
2. Right-click Cluster Service and click Stop.<br />
3. Change the startup type to Disabled.<br />
4. Repeat steps 1 through 3 for each node on the site.<br />
Performing a Manual Failover of the Quorum Consistency Group<br />
1. Connect to the Management Console by opening a browser to the management IP<br />
address of the surviving site. The management console can be accessed only by the<br />
site with a functional RA cluster because the WAN is down.<br />
2. Click the Quorum Consistency Group (that is, the consistency group that holds<br />
the quorum drive) in the navigation pane.<br />
3. Click the Policy tab.<br />
4. Under Advanced, select Manual (shared quorum) in the Global cluster<br />
mode list, and click Apply.<br />
5. Right-click the Quorum Consistency Group and then select Pause Transfer.<br />
Click Yes when the system prompts that the group activity will be stopped.<br />
6. Perform the following steps to allow access to the target image:<br />
a. Right-click the Consistency Group and scroll down.<br />
b. Select the Remote Copy name and click Enable Image Access.<br />
The Enable Image Access dialog box appears.<br />
c. Choose Select an image from the list and click Next.<br />
The Select Explicit Image dialog box displays the available images.<br />
d. Select the desired image from the list and then click Next.<br />
The Image Access Mode dialog box appears.<br />
4–14 6872 5688–002
Recovering in a Geographic Clustered Environment<br />
e. Select Logged access (physical) and click Next.<br />
The Summary screen shows the Image name and the Image Access mode.<br />
f. Click Finish.<br />
Note: This process might take a long time to complete depending on the value<br />
of the journal lag setting in the group policy of the consistency group.<br />
g. Verify the target image name displayed below the bitmap in the components<br />
pane under the Status tab.<br />
Transfer:Paused status displays under the bitmap in the Status tab under the<br />
components pane.<br />
Reversing Replication Direction<br />
1. Select the Quorum Consistency Group in the navigation pane.<br />
2. Right-click the Group and select Pause Transfer. Click Yes when the system<br />
prompts that the group activity will be paused.<br />
3. Click the Status tab. The status of the transfer must show Paused.<br />
4. Right-click the Consistency Group and select Failover to .<br />
5. Click Yes when the system prompts to confirm failover.<br />
6. Ensure that the Start data transfer immediately check box is selected.<br />
The following warning message appears:<br />
Warning: Journal will be erased. Do you wish to continue?<br />
7. Click Yes to continue.<br />
Starting MSCS<br />
MSCS should start within 1 minute on the surviving nodes when the MSCS recovery<br />
setting is enabled. You can manually start MSCS on each node of the surviving site by<br />
completing the following steps:<br />
1. In the Control Panel, point to Administrative Tools, and then click Services.<br />
2. Right-click Cluster Service, and click Start.<br />
MSCS starts the cluster group and automatically moves all groups to the first-started<br />
cluster node.<br />
3. Repeat steps 1 through 2 for each node on the site.<br />
6872 5688–002 4–15
Recovering in a Geographic Clustered Environment<br />
Completing the Recovery Process<br />
To complete the recovery process, you must restore the global cluster mode property<br />
and start MSCS.<br />
• Restoring the Global Cluster Mode Property for the Quorum Group<br />
Once the primary site is operational and you have verified that all nodes at both sites<br />
are online in the cluster, restore the failover settings by performing the following<br />
steps:<br />
1. Click the Quorum Consistency Group (that is, the consistency group that<br />
holds the quorum device) from the navigation pane.<br />
2. Click the Policy tab.<br />
3. Under Advanced, select Auto-quorum (shared quorum) in the Global<br />
cluster mode list.<br />
4. Click Apply.<br />
5. Click Yes when the system prompts that the group activity will be stopped.<br />
• Enabling MSCS<br />
Enable and start MSCS on each node at the site where the RAs failed by completing<br />
the following steps:<br />
1. In the Control Panel, point to Administrative Tools, and then click<br />
Services.<br />
2. Right-click Cluster Services and click Properties.<br />
3. Change the startup type to Automatic.<br />
4. Click Start<br />
5. Repeat steps 1 through 4 for each node on the site.<br />
6. Open the Cluster Administrator and move the groups to the preferred node.<br />
4–16 6872 5688–002
Problem Description<br />
Symptoms<br />
6872 5688–002<br />
If the quorum groupp<br />
is running on site 2 and the RAs fail on site 1, all cluster<br />
nodes<br />
remain in a running state. All consistency groups remain at the respective<br />
sites because<br />
all disk accesses arre<br />
successful. In this case, because data is stored on n the replication<br />
volumes—but the ccorresponding<br />
marking information is not written to the repository<br />
volume—a full-sweeep<br />
resynchronization is required following recovery.<br />
An exception is if thhe<br />
consistency group option “Allow application to ru un even when<br />
Unisys <strong>SafeGuard</strong> S<strong>Solutions</strong><br />
cannot mark data” was selected. The split tter prevents<br />
access to disks when<br />
the RAs are not available to write marking data to o the repository<br />
volume, and I/Os faail.<br />
Figure 4–2 illustratees<br />
this failure.<br />
Recovering in a Geographic Clustere ed Environment<br />
Recovery When All RAs Fail on Site 1 (Site 2<br />
Quorum Owner) )<br />
Figure 44–2.<br />
All RAs Fail on Site 1 (Site 2 Quorum Owner) O<br />
The following sympptoms<br />
might help you identify this failure:<br />
• The managemeent<br />
console display shows errors and messages sim milar to those for<br />
“Total Communnication<br />
Failure in a Geographic Clustered Environme ent” in Section 7.<br />
• If you review thhe<br />
system event log, you find messages similar to th he following<br />
examples:<br />
4–17
Recovering in a Geographic Clustered Environment<br />
System Event Log for Usmv-East2 Host (Surviving Site—Site 2)<br />
8/2/2008 3:09:27 PM ClusSvc Information Failover Mgr 1204 N/A USMV-EAST2 "The Cluster<br />
Service brought the Resource Group ""Group 0"" offline."<br />
8/2/2008 3:09:47 PM ClusSvc Error Failover Mgr 1069 N/A USMV-WEST2 Cluster resource 'Data1' in<br />
Resource Group 'Group 0' failed.<br />
8/2/2008 3:10:29 PM ClusSvc Information Failover Mgr 1153 N/A USMV-WEST2 Cluster service is<br />
attempting to failover the Cluster Resource Group 'Group 0' from node USMV-WEST2 to node USMV-<br />
EAST2.<br />
8/2/2008 3:10:53 PM ClusSvc Information Failover Mgr 1201 N/A USMV-EAST2 "The Cluster<br />
Service brought the Resource Group ""Group 0"" online."<br />
System Event Log for Usmv-West2 Host (Failure Site—Site 1)<br />
8/2/2008 3:09:27 PM ClusSvc Information Failover Mgr 1204 N/A USMV-EAST2 "The Cluster<br />
Service brought the Resource Group ""Group 0"" offline."<br />
8/2/2008 3:09:47 PM ClusSvc Error Failover Mgr 1069 N/A USMV-WEST2 Cluster resource 'Data1' in<br />
Resource Group 'Group 0' failed.<br />
8/2/2008 3:10:29 PM ClusSvc Information Failover Mgr 1153 N/A USMV-WEST2 Cluster service is<br />
attempting to failover the Cluster Resource Group 'Group 0' from node USMV-WEST2 to node USMV-<br />
EAST2.<br />
8/2/2008 3:10:53 PM ClusSvc Information Failover Mgr 1201 N/A USMV-EAST2 "The Cluster<br />
Service brought the Resource Group ""Group 0"" online."<br />
• If you review the cluster log, you find messages similar to the following examples:<br />
Cluster Log for Surviving Site (Site 2)<br />
000005a0.00000fdc::2008/02/02-21:57:33.543 ERR [FM] FmpSetGroupEnumOwner:: MM returned<br />
MM_INVALID_NODE, chose the default target<br />
00000ec8.000008b4::2008/02/02-22:09:03.139 ERR Unisys <strong>SafeGuard</strong> 30m Control : KfLogit:<br />
Online resource failed. Cannot complete transfer for auto failover. Action: Verify through the<br />
Management Console that the WAN connection is operational.<br />
00000ec8.00000f48::2008/02/02-22:10:39.715 ERR Unisys <strong>SafeGuard</strong> 30m Control : KfLogit:<br />
Online resource failed. Cannot complete transfer for auto failover. Action: Verify through the<br />
Management Console that the WAN connection is operational.<br />
Cluster Log for Failure Site (Site 1)<br />
0000033c.000008e4::2008/02/02-22:09:47.159 ERR Unisys <strong>SafeGuard</strong> 30m Control :<br />
KfGetKboxData: get_system_settings command failed. Error: (2685470674).<br />
0000033c.000008e4::2008/02/02-22:09:47.159 ERR Unisys <strong>SafeGuard</strong> 30m Control :<br />
UrcfKConGroupOnlineThread: Error 1117 bringing resource online. (Error 1117: the request could not be<br />
performed because of an I/O device error).<br />
0000033c.00000b8c::2008/02/02-22:10:08.168 ERR Unisys <strong>SafeGuard</strong> 30m Control :<br />
KfGetKboxData: get_version command failed. Error: (2685470674).<br />
0000033c.00000b8c::2008/02/02-22:10:29.146 ERR Unisys <strong>SafeGuard</strong> 30m Control :<br />
KfGetKboxData: get_system_settings command failed. Error: (2685470674).<br />
0000033c.00000b8c::2008/02/02-22:10:29.146 ERR Unisys <strong>SafeGuard</strong> 30m Control :<br />
UrcfKConGroupOnlineThread: Error 1117 bringing resource online. (Error 1117: the request could not be<br />
performed because of an I/O device error).<br />
4–18 6872 5688–002
Actions to Resolve the Problem<br />
Recovering in a Geographic Clustered Environment<br />
If all RAs on site 1 fail and site 2 owns the quorum resource, you do not need to perform<br />
manual recovery. Because the surviving site owns the quorum consistency group, MSCS<br />
automatically restarts, and the data consistency group fails over on the surviving site.<br />
Recovery When All RAs and All Servers Fail on One<br />
Site<br />
The following two cases describe an event in which a complete site fails (for example,<br />
site 1) and all data I/O, cluster node communication, disk reservations, and so forth, stop<br />
responding. MSCS nodes on site 2 detect a network heartbeat loss and loss of disk<br />
reservations, and try to take over the cluster groups that had been running on the nodes<br />
that failed.<br />
There are two cases for recovering from this failure based on which site owns the<br />
quorum group:<br />
• The RAs and servers fail on site 1 and that site owns the quorum group.<br />
• The RAs and servers fail on site 1 and site 2 owns the quorum group.<br />
Manual recovery of MSCS is required as described in the following topic, “Site 1 Failure<br />
(Site 1 Quorum Owner).”<br />
If the site can recover in an acceptable amount of time and the quorum owner does not<br />
reside on the failed site, manual recovery should not be performed.<br />
The two cases that follow respond differently and are solved differently based on where<br />
the quorum owner resides.<br />
Site 1 Failure (Site 1 Quorum Owner)<br />
Problem Description<br />
In the first failure case, all nodes at site 1 fail as well as the RAs. Thus, the RAs must fail<br />
quorum arbitration attempts initiated by nodes on the surviving site. Because the RAs on<br />
the surviving site (site 2) are not able to communicate over the communication<br />
networks, the RAs assume that it is a WAN network failure and do not allow automatic<br />
failover of cluster resources.<br />
MSCS attempts to fail over to a node at site 2. Because the quorum resource was<br />
owned by site 1, site 2 must be brought up using the manual quorum recovery<br />
procedure.<br />
Figure 4–3 illustrates this case.<br />
6872 5688–002 4–19
Recovering in a Geographic CClustered<br />
Environment<br />
4–20<br />
Figure 4–3. All RAs annd<br />
Servers Fail on Site 1 (Site 1 Quorum Ow wner)<br />
68 872 5688–002
Symptoms<br />
Recovering in a Geographic Clustered Environment<br />
The following symptoms might help you identify this failure:<br />
• The management console display shows errors and messages similar to those for<br />
“Total Communication Failure in a Geographic Clustered Environment” in Section 7.<br />
• If you review the system event log, you find messages similar to the following<br />
examples:<br />
System Event Log for Usmv-East2 Host (Failure Site)<br />
8/3/2008 10:46:01 AM ClusSvc Error Startup/Shutdown 1073 N/A USMV-EAST2 Cluster service<br />
was halted to prevent an inconsistency within the server cluster. The error code was 5892 (The<br />
membership engine requested shutdown of the cluster service on this node).<br />
8/3/2008 10:46:00 AM ClusSvc Error Membership Mgr 1177 N/A USMV-EAST2 Cluster service is<br />
shutting down because the membership engine failed to arbitrate for the quorum device. This could be<br />
due to the loss of network connectivity with the current quorum owner. Check your physical network<br />
infrastructure to ensure that communication between this node and all other nodes in the server cluster is<br />
intact.<br />
8/3/2008 10:47:40 AM ClusSvc Error Startup/Shutdown 1009 N/A USMV-EAST2 Cluster service<br />
could not join an existing server cluster and could not form a new server cluster. Cluster service has<br />
terminated.<br />
8/3/2008 10:50:16 AM ClusDisk Error None 1209 N/A USMV-EAST2 Cluster service is requesting<br />
a bus reset for device \Device\ClusDisk0.<br />
• If you review the cluster log, you find messages similar to the following examples:<br />
Cluster Log for Surviving Site (Site 2)<br />
00000c54.000008f4::2008/02/02-17:13:31.901 ERR [NMJOIN] Unable to begin join, status 1717 (the NIC<br />
interface is unknown).<br />
00000c54.000008f4::2008/02/02-17:13:31.901 ERR [CS] ClusterInitialize failed 1717<br />
00000c54.000008f4::2008/02/02-17:13:31.917 ERR [CS] Service Stopped. exit code = 1717<br />
00000be0.000008e0::2008/02/02-17:14:53.686 ERR [JOIN] Unable to connect to any sponsor node.<br />
00000be0.000008e0::2008/02/02-17:14:56.374 ERR [FM] FmpSetGroupEnumOwner:: MM returned<br />
MM_INVALID_NODE, chose the default target<br />
000001e0.00000bac::2008/02/02-17:16:37.563 ERR IP Address : WorkerThread:<br />
GetClusterNotify failed with status 6.<br />
00000e8c.00000ea8::2008/02/02-17:30:20.275 ERR Physical Disk : [DiskArb] Signature of disk<br />
has changed or failed to find disk with id, old signature 0xe1e7208e new signature 0xe1e7208e, status 2<br />
(the system cannot find the file specified).<br />
00000e8c.00000ea8::2008/02/02-17:30:20.289 ERR Physical Disk : SCSI: Attach, error<br />
attaching to signature e1e7208e, error 2.<br />
000008e8.000008fc::2008/02/02-17:30:20.289 ERR [FM] FmGetQuorumResource failed, error 2.<br />
000008e8.000008fc::2008/02/02-17:30:20.289 ERR [INIT] ClusterForm: Could not get quorum resource.<br />
No fixup attempted. Status = 5086 (The quorum disk could not be located by the cluster service).<br />
000008e8.000008fc::2008/02/0-17:30:20.289 ERR [INIT] Failed to form cluster, status 5086.<br />
000008e8.000008fc::2008/02/02-17:30:20.289 ERR [CS] ClusterInitialize failed 5086<br />
000008e8.000008fc::2008/02/02-17:30:20.360 ERR [CS] Service Stopped. exit code = 5086<br />
00000710.00000e80::2008/02/02-17:55:02.092 ERR [FM] FmpSetGroupEnumOwner:: MM returned<br />
MM_INVALID_NODE, chose the default target<br />
000009cc.00000884::2008/02/02-17:55:12.413 ERR Unisys <strong>SafeGuard</strong> 30m Control : KfLogit:<br />
6872 5688–002 4–21
Recovering in a Geographic Clustered Environment<br />
Online resource failed. Cannot complete transfer for auto failover. Action: Verify through the<br />
Management Console that the WAN connection is operational.<br />
Cluster Log for Failure Site (Site 1)<br />
00000dc8.00000c48::2008/02/02-17:12:53.942 ERR Physical Disk : [DiskArb] GetPartInfo<br />
completed, status 2.<br />
00000dc8.00000c48::2008/02/02-17:12:53.942 ERR Physical Disk : [DiskArb] Failed to read<br />
(sector 12), error 2.<br />
00000dc8.00000c48::2008/02/02-17:12:55.942 ERR Physical Disk : [DiskArb] GetPartInfo<br />
completed, status 2.<br />
00000dc8.00000c48::2008/02/02-17:12:55.942 ERR Physical Disk : [DiskArb] Failed to write<br />
(sector 12), error 2.<br />
00000fe4.00000810::2008/02/02-17:13:20.030 ERR [FM] Failed to arbitrate quorum resource c336021a-<br />
083e-4fa0-9d37-7077a590c206, error 2.<br />
00000fe4.00000810::2008/02/02-17:13:20.030 ERR [RGP] Node 1: REGROUP ERROR: arbitration failed.<br />
00000fe4.00000810::2008/02/02-17:13:20.030 ERR [NM] Halting this node due to membership or<br />
communications error. Halt code = 1000<br />
00000fe4.00000810::2008/02/02-17:13:20.030 ERR [CS] Halting this node to prevent an inconsistency<br />
within the cluster. Error status = 5892 (The membership engine requested shutdown of the cluster<br />
service on this node).<br />
00000dc8.00000f34::2008/02/02-17:13:20.670 ERR Unisys <strong>SafeGuard</strong> 30m Control : KfLogit:<br />
Online resource failed. Pending processing terminated by resource monitor.<br />
00000dc8.00000f34::2008/02/02-17:13:20.670 ERR Unisys <strong>SafeGuard</strong> 30m Control :<br />
UrcfKConGroupOnlineThread: Error 1117 bringing resource online.<br />
000009e4::2008/02/02-17:29:20.587 ERR [FM] FmGetQuorumResource failed, error 2.<br />
000008e4.000009e4::2008/02/02-17:29:20.587 ERR [INIT] ClusterForm: Could not get quorum resource.<br />
No fixup attempted. Status = 5086<br />
000008e4.000009e4::2008/02/02-17:29:20.587 ERR [INIT] Failed to form cluster, status 5086.<br />
000008e4.000009e4::2008/02/02-17:29:20.587 ERR [CS] ClusterInitialize failed 5086<br />
000008e4.000009e4::2008/02/02-17:29:20.602 ERR [CS] Service Stopped. exit code = 5086<br />
000005b4.000008cc::2008/02/02-17:31:11.075 ERR [FM] FmpSetGroupEnumOwner:: MM returned<br />
MM_INVALID_NODE, chose the default target<br />
00000ff4.000008d8::2008/02/02-17:31:19.901 ERR Unisys <strong>SafeGuard</strong> 30m Control : KfLogit:<br />
Online resource failed. Cannot complete transfer for auto failover. Action: Verify through the<br />
Management Console that the WAN connection is operational.<br />
Actions to Resolve the Problem<br />
If all RAs and servers on site 1 fail and site 1 owns the quorum resource, perform the<br />
following tasks to recover:<br />
1. Perform a manual failover of the quorum consistency group.<br />
2. Reverse replication direction.<br />
3. Start MSCS.<br />
4. Power on the site if a power failure occurred.<br />
5. Restore the failover settings.<br />
Note: Do not bring up any nodes until the manual recovery process is complete.<br />
4–22 6872 5688–002
Recovering in a Geographic Clustered Environment<br />
Caution<br />
Manual recovery is required only if the quorum device is lost because of a<br />
failure of an RA cluster.<br />
If the cluster nodes at the production site are operational, you must disable<br />
MSCS. You must verify the server status with a network test or attempt to<br />
log in to the server. Use the procedure in ”Recovery When All RAs Fail on<br />
Site 1 (Site 1 Quorum Owner).”<br />
Improper use of the manual recovery procedure can lead to an inconsistent<br />
quorum disk and unpredictable results that might require a long recovery<br />
process.<br />
Performing a Manual Failover of the Quorum Consistency Group<br />
To perform a manual failover of the quorum consistency group, follow the procedure<br />
given in the “Actions to Resolve the Problem” for “Recovery When All RAs Fail on Site 1<br />
(Site 1 Quorum Owner)” earlier in this section.<br />
Reversing Replication Direction<br />
1. Select the Consistency Group from the navigation pane.<br />
2. Right-click the Group and select Pause Transfer. Click Yes when the system<br />
prompts that the group activity will be paused.<br />
3. Click the Status tab. The status of the transfer must display Paused.<br />
4. Right-click the Consistency Group and select Failover to <br />
5. Click Yes when the system prompts to confirm failover.<br />
6. Ensure that the Start data transfer immediately check box is selected.<br />
The following warning message appears:<br />
Warning: Journal will be erased. Do you wish to continue?<br />
7. Click Yes to continue.<br />
Starting MSCS<br />
MSCS should start within 1 minute on the surviving nodes when the MSCS recovery<br />
setting is enabled. You can manually start MSCS on each node of the surviving site by<br />
completing the following steps:<br />
1. In the Control Panel, point to Administrative Tools, and then click<br />
Services.<br />
2. Right-click Cluster Service, and click Start.<br />
MSCS starts the cluster group and automatically moves all groups to the<br />
first-started cluster node.<br />
3. Repeat steps 1 through 2 for each node on the site.<br />
6872 5688–002 4–23
Recovering in a Geographic Clustered Environment<br />
Powering-on a Site<br />
If a site experienced a power failure, power on the site in the following order:<br />
• Switches<br />
• Storage<br />
Note: Wait until all switches and storage units are initialized before continuing to<br />
power on the site.<br />
• RAs<br />
Note: Wait 10 minutes after you power on the RAs before you power on the hosts.<br />
• Hosts<br />
Restoring the Global Cluster Mode Property for the Quorum Group<br />
Once the primary site is again operational and you have verified that all nodes at both<br />
sites are online in the cluster, restore the failover settings by completing the following<br />
steps:<br />
1. Click the Quorum Consistency Group (that is, the consistency group that holds<br />
the quorum drive) from the navigation pane.<br />
2. Click the Policy tab.<br />
3. Under Advanced, select Auto-quorum (shared quorum) in the Global<br />
cluster mode list.<br />
4. Ensure that the Allow Regulation box check box is selected.<br />
5. Click Apply.<br />
4–24 6872 5688–002
Site 1 Failure (Site 2 Quorum Owner)<br />
Problem Description<br />
6872 5688–002<br />
If the quorum groupp<br />
is running on site 2 and a complete site failure occ curs on site 1, a<br />
quorum failover is nnot<br />
required. Only data groups on the failed site will require failover.<br />
All data that is not mmirrored<br />
and was in the failed RA cache is lost; the latest<br />
image on<br />
the remote site is uused<br />
to recover. Cluster services will be up on all nod des on site 2, and<br />
cluster nodes will faail<br />
on site 1. You cannot move a group to nodes on a site where the<br />
RAs are down (site 1).<br />
MSCS attempts to fail over to a node at site 2. An e-mail alert is sent st tating that a site<br />
or RA cluster has faailed.<br />
Figure 4–4 illustratees<br />
this case.<br />
Recovering in a Geographic Clustere ed Environment<br />
Figure 4–4. All RAAs<br />
and Servers Fail on Site 1 (Site 2 Quorum m Owner)<br />
4–25
Recovering in a Geographic Clustered Environment<br />
Symptoms<br />
The following symptoms might help you identify this failure:<br />
• The management console display shows errors and messages similar to those for<br />
“Total Communication Failure in a Geographic Clustered Environment” in Section 7.<br />
• If you review the system event log, you find messages similar to the following<br />
examples:<br />
System Event Log for Usmv-West2 (Failure Site)<br />
8/3/2006 1:49:26 PM ClusSvc Information Failover Mgr 1205 N/A USMV-WEST2 "The Cluster<br />
Service failed to bring the Resource Group ""Cluster Group"" completely online or offline."<br />
8/3/2008 1:49:26 PM ClusSvc Information Failover Mgr 1203 N/A USMV-WEST2 "The Cluster<br />
Service is attempting to offline the Resource Group ""Cluster Group""."<br />
8/3/2008 1:50:46 PM ClusDisk Error None 1209 N/A USMV-WEST2 Cluster service is requesting a<br />
bus reset for device \Device\ClusDisk0.<br />
• If you review the cluster log, you find messages similar to the following examples:<br />
Cluster Log for Failure Site (Site 1)<br />
00000e50.00000c10::2008/02/02-20:50:46.165 ERR Physical Disk : [DiskArb] GetPartInfo<br />
completed, status 170 (the requested resource is in use).<br />
00000e50.00000c10::2008/02/02-20:50:46.165 ERR Physical Disk : [DiskArb] Failed to read<br />
(sector 12), error 170.<br />
00000e50.00000fb4::2008/02/02-20:52:05.133 ERR IP Address : WorkerThread:<br />
GetClusterNotify failed with status 6 (the handle is invalid).<br />
Cluster Log for Surviving Site (Site 2)<br />
00000178.00000dd8::2008/02/02-20:49:30.976 ERR Physical Disk : [DiskArb] GetPartInfo<br />
completed, status 170.<br />
00000178.00000dd8::2008/02/02-20:49:30.992 ERR Physical Disk : [DiskArb] Failed to read<br />
(sector 12), error 170.<br />
00000d80.00000e68::2008/02/02-20:49:57.679 ERR [GUM] GumSendUpdate: GumQueueLocking update<br />
to node 1 failed with 1818 (The remote procedure call was cancelled).<br />
00000d80.00000e68::2008/02/02-20:49:57.679 ERR [GUM] GumpCommFailure 1818 communicating<br />
with node 1<br />
00000178.00000810::2008/02/02-20:50:45.492 ERR IP Address : WorkerThread:<br />
GetClusterNotify failed with status 6 (The handle is invalid).<br />
Actions to Resolve the Problem<br />
If all RAs and all servers on site 1 fail and site 2 owns the quorum resource, you do not<br />
need to perform manual recovery. Because the surviving site owns the quorum<br />
consistency group, MSCS automatically restarts, and the data consistency group fails<br />
over on the surviving site.<br />
4–26 6872 5688–002
Section 5<br />
Solving Storage Problems<br />
This section lists symptoms that usually indicate problems with storage. Table 5–1 lists<br />
symptoms and possible problems indicated by the symptom. The problems and their<br />
solutions are described in this section. The graphics, behaviors, and examples in this<br />
section are similar to what you observe with your system but might differ in some<br />
details.<br />
In addition to the symptoms listed, you might receive e-mail messages or SNMP traps<br />
for possible problems. Also, messages similar to e-mail notifications might be displayed<br />
on the management console. If you do not see the messages, they might have already<br />
dropped off the display. Review the management console logs for messages that have<br />
dropped off the display.<br />
Table 5–1. Possible Storage Problems with Symptoms<br />
Symptom Possible Problem<br />
The system pauses the transfer for the<br />
relevant consistency group.<br />
The server cannot access this volume;<br />
writes to this volume fail; the file system<br />
cannot be mounted; and so forth.<br />
The management console shows an error<br />
for all connections to this volume—that is,<br />
all RAs on the relevant site and all splitters<br />
attached to this volume.<br />
The system pauses the transfer for all<br />
consistency groups.<br />
The management console shows an error<br />
for all connections to this volume—that is,<br />
all RAs on the relevant site and all splitters<br />
attached to this volume.<br />
The event log reports that the repository<br />
volume is inaccessible.<br />
The event log indicates that the repository<br />
volume is corrupted.<br />
User or replication volume not accessible<br />
Repository volume not accessible<br />
6872 5688–002 5–1
Solving Storage Problems<br />
Table 5–1. Possible Storage Problems with Symptoms<br />
Symptom Possible Problem<br />
The management console shows an error<br />
for the connections between this volume<br />
and all RAs on the relevant site.<br />
The system pauses the transfer for the<br />
relevant consistency group.<br />
The event log indicates that the journal<br />
was lost or corrupted.<br />
No volumes from the relevant target and<br />
worldwide name (WWN) are accessible to<br />
any initiator on the SAN.<br />
The cluster regroup process begins and<br />
the quorum device fails over to a site<br />
without failed storage.<br />
The management console shows a storage<br />
error and replication has stopped.<br />
Servers report multipath software errors.<br />
Applications that depend on physical disk<br />
resources go offline and fail when<br />
attempting to come online.<br />
Once resource retry threshold parameters<br />
are reached, site 1 fails over to site 2. With<br />
the default settings, this timing is about 30<br />
minutes.<br />
Journal not accessible<br />
Total storage loss in a geographic<br />
replicated environment<br />
Storage failure on one site with quorum<br />
owner on failed site in a geographic<br />
clustered environment<br />
Storage failure on one site with quorum<br />
owner on surviving site in a geographic<br />
clustered environment<br />
5–2 6872 5688–002
Solving Storage Problems<br />
Table 5–2 lists specific storage volume failures and the types of errors and indicators on<br />
the management console that distinguish each failure.<br />
Table 5–2. Indicators and Management Console Errors to<br />
Distinguish Different Storage Volume Failures<br />
Failure<br />
Data volume<br />
lost or failed<br />
Journal<br />
volume lost,<br />
failed, or<br />
corrupt<br />
Repository<br />
volume lost,<br />
failed, or<br />
corrupt<br />
Groups<br />
Paused<br />
Status<br />
Relevant<br />
Data<br />
Group<br />
Relevant<br />
Data<br />
Group<br />
System<br />
Status<br />
All Storage and<br />
RA error<br />
failure<br />
Volumes<br />
Tab<br />
Storage error Replication<br />
volume with<br />
error status<br />
Storage error Journal<br />
volume with<br />
error status<br />
Repository<br />
volume with<br />
error status<br />
6872 5688–002 5–3<br />
Logs<br />
Tab<br />
Error<br />
3012<br />
Error<br />
3012<br />
Error<br />
3014
Solving Storage Problems<br />
User or Replication Volume Not Accessible<br />
Problem Description<br />
Symptoms<br />
The replication volume is not accessible to any host or splitter.<br />
The following symptoms might help you identify this failure:<br />
• The management console shows an error for storage and the Volumes tab (status<br />
column) shows additional errors (See Figure 5–1).<br />
Figure 5–5–1. Volumes Tab Showing Volume Connection Errors<br />
• Warnings and informational messages similar to those shown in Figure 5–2 appear<br />
on the management console. See the table after the figure for an explanation of the<br />
numbered console messages.<br />
5–4 6872 5688–002
Solving Storage Problems<br />
Figure 5–2. Management Console Messages for the User Volume Not Accessible<br />
Problem<br />
Reference<br />
No.<br />
The following table explains the numbered messages in Figure 5–2.<br />
Event<br />
ID<br />
Description E-mail<br />
Immediate<br />
1 4003 Group capabilities problem with the details<br />
showing that the RA is unable to access .<br />
E-mail<br />
Daily<br />
Summary<br />
2 3012 The RA is unable to access the volume. X<br />
• The Groups tab on the management console shows that the system paused the<br />
transfer for the relevant consistency group. (See Figure 5–3.)<br />
Figure 5–3. Groups Tab Shows “Paused by System”<br />
• The server cannot access this volume; writes to this volume fail; the file system<br />
cannot be mounted; and so forth.<br />
6872 5688–002 5–5<br />
X
Solving Storage Problems<br />
Actions to Resolve<br />
Perform the following actions to isolate and resolve the problem:<br />
• Determine whether other volumes from the same storage device are accessible to<br />
the same RAs to rule out a total storage loss. If no volumes are seen by an RA, refer<br />
to “Total Storage Loss in a Geographic Replicated Environment.”<br />
• Verify that this LUN still exists and has not failed or been removed from the storage<br />
device.<br />
• Verify that the LUN is masked to the proper splitter or splitters and RAs.<br />
• Verify that other servers in the SAN do not use this volume. For example, if an<br />
MSCS cluster in the SAN acquired ownership of this volume, it might reserve the<br />
volume and block other initiators from seeing the volume.<br />
• Verify that the volume has read and write permissions on the storage system.<br />
• Verify that the volume, as configured in the management console, has the expected<br />
WWN and LUN.<br />
Repository Volume Not Accessible<br />
Problem Description<br />
Symptoms<br />
The repository volume is not accessible to any SAN-attached initiator, including the<br />
splitter and RAs.<br />
Or, the repository volume is corrupted---either by another initiator because of storage<br />
changes or as a result of storage failure. You must reformat the repository volume<br />
before replication can proceed normally.<br />
The following symptoms might help you identify this failure:<br />
• The management console shows an error for all connections to this volume—that is,<br />
all RAs on the relevant site and all splitters attached to this volume. The RAs tab on<br />
the management console shows errors for the volume. (See Figure 5–4.)<br />
The following error messages appear for the RAs error condition when you click<br />
Details:<br />
Error: RA 1 in Sydney can't access repository volume<br />
Error: RA 2 in Sydney can't access repository volume<br />
The following error message appears for the storage error condition, when you click<br />
Details:<br />
Error: Repository volume can't be accessed by any RAs<br />
5–6 6872 5688–002
Solving Storage Problems<br />
Figure 5–4. Management Console Display: Storage Error and RAs Tab Shows<br />
Volume Errors<br />
• The Volumes tab on the management console shows an error for the repository<br />
volume, as shown in Figure 5–5.<br />
Figure 5–5. Volumes Tab Shows Error for Repository Volume<br />
• The Groups tab on the management console shows that the system paused the<br />
transfer for all consistency groups, as shown in Figure 5–6.<br />
Figure 5–6. Groups Tab Shows All Groups Paused by System<br />
• The Logs tab on the management console lists a message for event ID 3014. This<br />
message indicates that the RA is unable to access the repository volume or the<br />
repository volume is corrupted. (See Figure 5–7.)<br />
6872 5688–002 5–7
Solving Storage Problems<br />
Figure 5–7. Management Console Messages for the Repository Volume not<br />
Accessible Problem<br />
Actions to Resolve<br />
Perform the following actions to isolate and resolve the problem:<br />
• Determine whether other volumes from the same storage device are accessible to<br />
the same RAs to rule out a total storage loss. If no volumes are seen by an RA, refer<br />
to “Total Storage Loss in a Geographic Replicated Environment.”<br />
• Verify that this LUN still exists and has not failed or been removed from the storage<br />
device.<br />
• Verify that the LUN is masked to the proper splitter or splitters and RAs.<br />
• Verify that other servers in the SAN do not use this volume. For example, if an<br />
MSCS cluster in the SAN acquired ownership of this volume, it might reserve the<br />
volume and block other initiators from seeing the volume.<br />
• Verify that the volume has read and write permissions on the storage system.<br />
• Verify that the volume, as configured in the management console, has the expected<br />
WWN and LUN.<br />
• If the volume is corrupted or you determine that it must be reformatted, perform the<br />
steps in “Reformatting the Repository Volume.”<br />
Reformatting the Repository Volume<br />
Before you begin the reformatting process in a geographic clustered environment, be<br />
sure that all groups are located at the site for which the repository volume is not to be<br />
formatted.<br />
On RA 1 at the site for which the repository volume is to be formatted, determine from<br />
the Site Planning <strong>Guide</strong> which LUN is used for the repository volume. If the LUN is not<br />
recorded for the repository volume, a list is presented during the volume formatting<br />
process that shows LUNs and the previously used repository volume is identified.<br />
5–8 6872 5688–002
Solving Storage Problems<br />
Perform the following steps to reformat a repository volume for a particular site:<br />
1. Click the Data Group in the Management Console, and perform the following<br />
steps:<br />
a. Click Policy in the right pane and change the Global Cluster mode<br />
selection to Manual.<br />
b. Click Apply.<br />
c. Right-click the Data Group and select Disable Group.<br />
d. Click Yes when the system prompts that the copy activities will be stopped.<br />
2. Skip to step 6 for geographic replication environments.<br />
3. Perform the following steps for geographic clustered environments:<br />
a. Open the Group Policy window for the quorum group.<br />
b. Change the Global Cluster mode selection to Manual.<br />
c. Click Apply.<br />
4. Right-click the Consistency Group and select Disable Group.<br />
5. Click Yes when the system prompts that the copy activities will be stopped.<br />
6. Select the Splitters tab.<br />
a. Open the Splitter Properties window for the splitter.<br />
b. Select all the attached volumes.<br />
c. Click Detach and then click Apply.<br />
d. Click OK to close the window.<br />
e. Delete the splitter at the site for which the repository volume is to be<br />
reformatted.<br />
7. Open the PuTTY session on RA1 for the site.<br />
a. Log on with boxmgmt as the User ID and boxmgmt as the password.<br />
The Main menu is displayed.<br />
b. At the prompt, type 2 (Setup) and press Enter.<br />
c. On the Setup menu, type 2 (Configure repository volume) and press Enter.<br />
d. Type 1 (Format repository volume) and press Enter.<br />
e. Enter the appropriate number from the list to select the LUN. Ensure that<br />
the WWN and LUN are for the volume that you want to format. The LUN<br />
and identifier displays.<br />
f. Confirm the volume to format.<br />
All data is removed from the volume.<br />
g. Verify that the operation succeeds and press Enter.<br />
h. On the Main Menu, type Q (quit) and press Enter.<br />
8. Open a PuTTY session on each additional RA at the site for which the repository<br />
volume is to be formatted.<br />
6872 5688–002 5–9
Solving Storage Problems<br />
9. Log on with the boxmgmt as the user ID and boxmgmt as the password.<br />
The Main menu displays.<br />
a. At the prompt, type 2 (Setup) and press Enter.<br />
b. On the Setup menu, type 2 (Configure repository volume) and press Enter.<br />
c. Type 2 (Select a previously formatted repository volume) and press Enter.<br />
d. Enter the appropriate number from the list to select the LUN. Ensure that<br />
the WWN and LUN are for the volume that you want to format. The LUN<br />
and identifier displays.<br />
e. Confirm the volume to format. All data is removed from the volume.<br />
f. Verify that the operation succeeds and press Enter.<br />
g. On the Main menu, type Q (quit) and press Enter.<br />
Note: Complete step 9 for each additional RA at the site.<br />
10. On the Management Console, select the Splitters tab.<br />
a. Click the Add New Splitter icon to open the Add splitter window.<br />
b. Click Rescan and select the splitter.<br />
11. Open the Group Properties window and click the Policy tab and perform the<br />
following steps for each data group:<br />
a. Change the Global cluster mode selection to auto-data (shared<br />
quorum).<br />
b. Right-click the Data Group and click Enable Group.<br />
12. Skip to step 16 for geographic replication environments.<br />
13. Perform the following steps for geographic clustered environments.<br />
a. Right-click the Quorum Group and click Enable Group.<br />
b. Click the Quorum Group and select Policy in the right pane.<br />
c. Change the Global Cluster mode selection to Auto-quorum (shared<br />
quorum).<br />
14. Verify that initialization completes for all the groups.<br />
15. Review the Management Console event log.<br />
16. Ensure that no storage error or other component error appears.<br />
5–10 6872 5688–002
Journal Not Accessible<br />
Problem Description<br />
Symptoms<br />
The journal is not accessible to either RA.<br />
Solving Storage Problems<br />
A journal for one of the consistency groups is corrupted. The corruption results from<br />
another initiator because of storage changes or as a result of storage failure. Because<br />
the snapshot history is corrupted, replication for the relevant consistency group cannot<br />
proceed.<br />
The following symptoms might help you identify this failure:<br />
• The Volumes tab on the management console shows an error for the journal volume.<br />
(See Figure 5–8.)<br />
Figure 5–8. Volumes Tab Shows Journal Volume Error<br />
• The RAs tab on the management console shows errors for connections between<br />
this volume and the RAs. (See Figure 5–9.)<br />
Figure 5–9. RAs Tab Shows Connection Errors<br />
6872 5688–002 5–11
Solving Storage Problems<br />
• The Groups tab on the management console shows that the system paused the<br />
transfer for the relevant consistency group, as shown in Figure 5–10.<br />
Figure 5–10. Groups Tab Shows Group Paused by System<br />
• The Logs tab on the management console lists a message for event ID 3012. This<br />
message indicates that the RA is unable to access the volume. (See Figure 5–11.)<br />
Figure 5–11. Management Console Messages for the Journal Not Accessible<br />
Problem<br />
Actions to Resolve<br />
Perform the following actions to isolate and resolve the problem:<br />
• Determine whether other volumes from the same storage device are accessible to<br />
the same RAs to rule out a total storage loss. If no volumes are seen by an RA, refer<br />
to “Total Storage Loss in a Geographic Replicated Environment.”<br />
• Verify that this LUN still exists on the storage device and that it is only masked to<br />
the RAs.<br />
• Verify that the volume has read and write permissions on the storage system.<br />
• Verify that the volume, as configured in the management console, has the expected<br />
WWN and LUN.<br />
• For a corrupted journal, check that the system recovers automatically by re-creating<br />
the data structures for the corrupted journal and that the system then initiates a fullsweep<br />
resynchronization. No manual intervention is needed.<br />
5–12 6872 5688–002
Journal Volume Lost Scenarios<br />
Problem Description<br />
Scenarios<br />
Solving Storage Problems<br />
The journal volume is lost and will not be available in some scenarios as described<br />
below.<br />
• Attempt to write data to the Journal volume with the speed higher than the journal<br />
data is distributed to the replication volume will result in Journal data loss. In this<br />
case the Journal volume may be full and attempt to perform write operation on it<br />
creates a problem.<br />
• The user performs the following operations:<br />
− Failover<br />
− Recover production<br />
Actions to Resolve<br />
You can minimize the occurrence of this problem in scenario 1 by carefully configuring<br />
the Journal Lag. It is unavoidable in scenario 2.<br />
Total Storage Loss in a Geographic Replicated<br />
Environment<br />
Problem Description<br />
Symptoms<br />
All volumes belonging to a certain storage target and WWN (or controller, device) have<br />
been lost.<br />
The following symptoms might help you identify this failure:<br />
• The symptoms can be the same as those from any of the volume failure problems<br />
listed previously (or a subset of those symptoms), if the symptoms are relevant to<br />
the volumes that were used on this target. All volumes common to a particular<br />
storage array have failed.<br />
The Volumes tab on the management console shows errors for all volumes. (See<br />
Figure 5–12.)<br />
6872 5688–002 5–13
Solving Storage Problems<br />
Figure 5–12. Management Console Volumes Tab Shows Errors for All Volumes<br />
• No volumes from the relevant target and WWN are accessible to any initiator on the<br />
SAN, as shown on the RAs tab on the management console. (See Figure 5–13.)<br />
Figure 5–13. RAs Tab Shows Volumes That Are Not Accessible<br />
• Multipathing software (such as EMC PowerPath Administrator) reports failed paths<br />
to the storage device, as shown in Figure 5–14.<br />
5–14 6872 5688–002
Figure 5–14. Multipatthing<br />
Software Reports Failed Paths to Storage<br />
Device<br />
Actions to Resolve<br />
6872 5688–002<br />
Perform the followiing<br />
actions to isolate and resolve the problem:<br />
Solving Sto orage Problems<br />
• Verify that the sstorage<br />
device has not experienced a power outage.<br />
Instead, the<br />
device is functioning<br />
normally according to all external indicators.<br />
• Verify that the FFibre<br />
Channel switch and the storage device indicate e an operating<br />
Fibre Channel cconnection<br />
(that is, the relevant LEDs show OK). If the<br />
indicators are<br />
not OK, the prooblem<br />
might be a faulty Fibre Channel port (storage, switch, or patch<br />
panel) or a faultty<br />
Fibre Channel cable.<br />
• Verify that the iinitiator<br />
can be seen from the switch name server. If f not, the problem<br />
could be a Fibree<br />
Channel port or cable problem (as in the preceding g item). Otherwise,<br />
the problem coould<br />
be a misconfiguration of the port on the switch (for ( example, type<br />
or speed could be wrong).<br />
• Verify that the ttarget<br />
WWN is included in the relevant zones (that is s, hosts and RA).<br />
Verify also that the current zoning configuration is the active config guration. If you use<br />
the default zonee,<br />
verify that it is set to permit by default.<br />
• Verify that the rrelevant<br />
LUNs still exist on the storage device and are<br />
masked to the<br />
proper splitters and RAs.<br />
• Verify that volumes<br />
have read and write permissions on the storage<br />
system.<br />
• Verify that thesse<br />
volumes are exposed and managed by the proper r hosts and that<br />
there are no othher<br />
hosts on the SAN that use this volume.<br />
5–15
Solving Storage Problems<br />
Storage Failure on One Site in a Geographic<br />
Clustered Environmment<br />
5–16<br />
In a geographic clusteredd<br />
environment where MSCS is running, if the storage<br />
subsystem<br />
on one site fails, the symmptoms<br />
and resulting actions depend on whether the e quorum<br />
owner resided on the failed<br />
storage subsystem.<br />
To understand the two scenarios<br />
and to follow the actions for both possibilit ties, review<br />
Figure 5–15.<br />
Fiigure<br />
5–15. Storage on Site 1 Fails<br />
68 872 5688–002
Storage Failure on OOne<br />
Site with Quorum Owner on Failed Site<br />
Problem Description<br />
Symptoms<br />
6872 5688–002<br />
In this case, the cluuster<br />
quorum owner as well as the quorum resource e resides on the<br />
failed storage subsyystem.<br />
The quorum and resource<br />
automatically fail over to the node that gains control through<br />
MSCS arbitration. TThis<br />
node resides on the site without the storage failure.<br />
The RAs use the lasst<br />
available image. This action results in a loss of dat ta that has yet to<br />
be replicated. The rresources<br />
cannot fail back to the failed site until the storage<br />
subsystem is restored.<br />
The following sympptoms<br />
might help you identify this failure.<br />
• A node on whicch<br />
the cluster was running might report a delayed write w failure or<br />
similar error.<br />
• The quorum resservation<br />
is lost, and MSCS stops on the cluster nod de that owned the<br />
quorum resourcce.<br />
This action triggers a cluster “regroup” process, which allows<br />
other cluster noodes<br />
to arbitrate for the quorum device. Figure 5–16 6 shows typical<br />
listings for the ccluster<br />
regroup process.<br />
Figuure<br />
5–16. Cluster “Regroup” Process<br />
Solving Sto orage Problems<br />
5–17
Solving Storage Problems<br />
• Cluster nodes located on the failed storage subsystem fail quorum arbitration<br />
because the service cannot provide a reservation on the quorum volume. The<br />
resources fail over to the site without a storage failure. The first cluster node on the<br />
site without the storage failure that successfully completes arbitration of the quorum<br />
device assumes ownership of the cluster.<br />
The following messages illustrate this process.<br />
Cluster Log Entries<br />
INFO Physical Disk : [DiskArb]------- DisksArbitrate -------.<br />
INFO Physical Disk : [DiskArb] DisksOpenResourceFileHandle: Attaching to disk with<br />
signature f6fb216<br />
INFO Physical Disk : [DiskArb] DisksOpenResourceFileHandle: Disk unique id present<br />
trying new attach<br />
INFO Physical Disk : [DiskArb] DisksOpenResourceFileHandle: Retrieving disk number<br />
from ClusDisk registry key<br />
INFO Physical Disk : [DiskArb] DisksOpenResourceFileHandle: Retrieving handle to<br />
PhysicalDrive9<br />
INFO Physical Disk : [DiskArb] DisksOpenResourceFileHandle: Returns success.<br />
INFO Physical Disk : [DiskArb] Arbitration Parameters: ArbAttempts 5,<br />
SleepBeforeRetry 500 ms.<br />
INFO Physical Disk : [DiskArb] Read the partition info to insure the disk is<br />
accessible.<br />
INFO Physical Disk : [DiskArb] Issuing GetPartInfo on signature f6fb216.<br />
INFO Physical Disk : [DiskArb] GetPartInfo completed, status 0.<br />
INFO Physical Disk : [DiskArb] Arbitrate for ownership of the disk by<br />
reading/writing various disk sectors.<br />
INFO Physical Disk : [DiskArb] Successful read (sector 12) [:0]<br />
(0,00000000:00000000).<br />
INFO Physical Disk : [DiskArb] Successful write (sector 11) [USMV-DL580:0]<br />
(0,6ddd5cac:01c6d778).<br />
INFO Physical Disk : [DiskArb] Successful read (sector 12) [:0]<br />
(0,00000000:00000000).<br />
INFO Physical Disk : [DiskArb] Successful write (sector 12) [USMV-DL580:0]<br />
(0,6ddd5cac:01c6d778).<br />
INFO Physical Disk : [DiskArb] Successful read (sector 11) [USMV-DL580:0]<br />
(0,6ddd5cac:01c6d778).<br />
INFO Physical Disk : [DiskArb] Issuing Reserve on signature f6fb216.<br />
INFO Physical Disk : [DiskArb] Reserve completed, status 0.<br />
INFO Physical Disk : [DiskArb] CompletionRoutine starts.<br />
INFO Physical Disk : [DiskArb] Posting request to check reserve progress.<br />
INFO Physical Disk : [DiskArb] ********* IO_PENDING ********** - Request to insure<br />
reserves working is now posted.<br />
WARN Physical Disk : [DiskArb] Assume ownership of the device.<br />
INFO Physical Disk : [DiskArb] Arbitrate returned status 0.<br />
5–18 6872 5688–002
6872 5688–002<br />
• In Cluster Administrator,<br />
the groups that were online on one node change to the<br />
node that wins arbitration, as shown in Figure 5–17.<br />
Figuree<br />
5–17. Cluster Administrator Displays<br />
Solving Sto orage Problems<br />
• Multipathing sooftware,<br />
if present, reports errors on the host server rs of the site for<br />
which the storaage<br />
subsystem failed. Figure 5–18 shows errors for failed f storage<br />
devices.<br />
Figure 5–18. Multipatthing<br />
Software Shows Server Errors for Fai iled Storage<br />
Subsystem<br />
5–19
Solving Storage Problems<br />
Actions to Resolve<br />
Perform the following actions to isolate and resolve the problem:<br />
• Verify that all cluster resources failed over to a node on the site for which the<br />
storage subsystem did not fail and that these resources are online. If the cluster is<br />
running and no additional errors are reported, the problem has probably been isolated<br />
to a total site storage failure.<br />
• Log in to the storage subsystem, and verify that all LUNs are present and configured<br />
properly.<br />
• If the storage subsystem appears to be operating, the problem is most likely<br />
because of a failed SAN switch. See “Total SAN Switch Failure on One Site in a<br />
Geographic Clustered Environment” in Section 6.<br />
• Resolve the failure of the storage subsystem before attempting failback. Once the<br />
storage subsystem is working and the RAs and host can access it, a full initialization<br />
is initiated.<br />
Storage Failure on One Site with Quorum Owner on Surviving<br />
Site<br />
Problem Description<br />
Symptoms<br />
In this case, the cluster quorum owner does not reside on the failed storage subsystem,<br />
but other resources do reside on the failed storage subsystem.<br />
The cluster resources fail over to a site without a failed storage subsystem. The RAs use<br />
the last available image. This action results in a loss of data that has yet to be replicated<br />
(if not synchronous). The resources cannot fail back to the failed site until the storage<br />
subsystem is restored.<br />
The following symptoms might help you identify this failure:<br />
• The cluster marks the data groups containing the physical disk resources as failed.<br />
• Applications dependent on the physical disk resource go offline. Failed resources<br />
attempt to come online on the failed site, but fail. Then the resources fail over to the<br />
site with a valid storage subsystem.<br />
Actions to Resolve<br />
Perform the following actions to isolate and resolve the problem:<br />
• Verify that multipathing software, if present, reports errors on the host servers at the<br />
site with the suspected failed storage subsystem. (See Figure 5–19.)<br />
• Verify that all cluster resources failed over to site 2 in Cluster Administrator. Entries<br />
similar to the following occur in the cluster log for a host at the site with a failed<br />
storage subsystem (thread ID and timestamp removed).<br />
5–20 6872 5688–002
Cluster Log<br />
Solving Storage Problems<br />
Disk reservation lost ..<br />
ERR Physical Disk : [DiskArb] CompletionRoutine: reservation lost! Status 2<br />
Arbitrate for disk ....<br />
INFO Physical Disk : [DiskArb] Arbitration Parameters: ArbAttempts 5,<br />
SleepBeforeRetry 500 ms.<br />
INFO Physical Disk : [DiskArb] Read the partition info to insure the disk is<br />
accessible.<br />
INFO Physical Disk : [DiskArb] Issuing GetPartInfo on signature f6fb211.<br />
ERR Physical Disk : [DiskArb] GetPartInfo completed, status 2.<br />
INFO Physical Disk : [DiskArb] Arbitrate for ownership of the disk by<br />
reading/writing various disk sectors.<br />
ERR Physical Disk : [DiskArb] Failed to read (sector 12), error 2.<br />
INFO Physical Disk : [DiskArb] We are about to break reserve.<br />
INFO Physical Disk : [DiskArb] Issuing BusReset on signature f6fb211.<br />
Give up after 5 re-tries ...<br />
INFO Physical Disk : [DiskArb] We are about to break reserve.<br />
INFO Physical Disk : [DiskArb] Issuing BusReset on signature f6fb211.<br />
INFO Physical Disk : [DiskArb] BusReset completed, status 0.<br />
INFO Physical Disk : [DiskArb] Read the partition info from the disk to insure<br />
disk is accessible.<br />
INFO Physical Disk : [DiskArb] Issuing GetPartInfo on signature f6fb211.<br />
ERR Physical Disk : [DiskArb] GetPartInfo completed, status 2.<br />
ERR Physical Disk : [DiskArb] Failed to write (sector 12), error 2.<br />
ERR Physical Disk : Online, arbitration failed. Error: 2.<br />
INFO Physical Disk : Online, setting ResourceState 4 .<br />
Control goes offline at failed site...<br />
INFO [FM] FmpDoMoveGroup: Entry<br />
INFO [FM] FmpMoveGroup: Entry<br />
INFO [FM] FmpMoveGroup: Moving group 97ac3c3b-6985-44dd-bacd-a26e14966572 to node 4 (4)<br />
INFO [FM] FmpOfflineResource: Disk R: depends on Data1. Shut down first.<br />
INFO Unisys <strong>SafeGuard</strong> 30m Control : KfResourceOffline: Resource 'Data1' going<br />
offline.<br />
After trying other nodes at site move to remote site ...<br />
INFO [FM] FmpMoveGroup: Take group 97ac3c3b-6985-44dd-bacd-a26e14966572 request to remote<br />
node 4<br />
Move succeeds ...<br />
INFO [FM] FmpMoveGroup: Exit group , status = 0<br />
INFO [FM] FmpDoMoveGroup: Exit, status = 0<br />
INFO [FM] FmpDoMoveGroupOnFailure: FmpDoMoveGroup returns 0<br />
INFO [FM] FmpDoMoveGroupOnFailure Exit.<br />
INFO [GUM] s_GumUpdateNode: dispatching seq 5720 type 0 context 9<br />
INFO [FM] GUM update group 97ac3c3b-6985-44dd-bacd-a26e14966572, state 0<br />
INFO [FM] New owner of Group 97ac3c3b-6985-44dd-bacd-a26e14966572 is 2, state 0, curstate<br />
0.<br />
• Log in to the failed storage subsystem and determine whether the storage reports<br />
failed or missing disks. If the storage subsystem appears to be fine, the problem is<br />
most likely because of a SAN switch failure. See “Total SAN Switch Failure on One<br />
Site in a Geographic Clustered Environment” in Section 6.<br />
• Once the storage for the site that failed is back online, a full sweep is initiated.<br />
Check that the messages “Starting volume sweep“ and “Starting full sweep “ are<br />
displayed as an Events Notice.<br />
6872 5688–002 5–21
Solving Storage Problems<br />
5–22 6872 5688–002
Section 6<br />
Solving SAN Connectivity Problems<br />
This section lists symptoms that usually indicate problems with connections to the<br />
storage subsystem. Table 6–1 lists symptoms and possible problems indicated by the<br />
symptom. The problems and their solutions are described in this section. The graphics,<br />
behaviors, and examples in this section are similar to what you observe with your<br />
system but might differ in some details.<br />
In addition to the symptoms listed, you might receive e-mail messages or SNMP traps<br />
for possible problems. Also, messages similar to e-mail notifications might be displayed<br />
on the management console. If you do not see the messages, they might have already<br />
dropped off the display. Review the management console logs for messages that have<br />
dropped off the display.<br />
Table 6–1. Possible SAN Connectivity Problems<br />
Symptoms Possible Problem<br />
The system pauses the transfer. If the<br />
volume is accessible to another RA, a<br />
switchover occurs, and the relevant groups<br />
start running on the new RA.<br />
The relevant message appears in the event<br />
log.<br />
The link to the volume from the<br />
disconnected RA or RAs shows an error.<br />
The volume is accessible to the splitters<br />
that are attached to it.<br />
The system pauses the transfer for the<br />
relevant groups.<br />
If the volume is not accessible, the<br />
management console shows an error for<br />
the splitter. If a replication volume is not<br />
accessible, the splitter connection to that<br />
volume shows an error.<br />
Volume not accessible to RAs<br />
Volume not accessible to <strong>SafeGuard</strong> 30m<br />
splitter<br />
6872 5688–002 6–1
Solving SAN Connectivity Problems<br />
Table 6–1. Possible SAN Connectivity Problems<br />
Symptoms Possible Problem<br />
The system pauses the transfer for the<br />
relevant group or groups. If the connection<br />
with only one of the RAs is lost, the group<br />
or groups can restart the transfer by<br />
means of another RA, beginning with a<br />
short initialization.<br />
The splitter connection to the relevant RAs<br />
shows an error.<br />
The relevant message describes the lost<br />
connection in the event log.<br />
The management console shows a server<br />
down.<br />
Messages on the management console<br />
show that the splitter is down and that the<br />
node fails over.<br />
Multipathing software (such as EMC<br />
PowerPath Administrator) messages report<br />
an error.<br />
Cluster nodes fail and the cluster regroup<br />
process begins.<br />
Applications fail and attempt to restart.<br />
Messages regarding failed physical disks<br />
are displayed on the management console.<br />
The cluster resources fail over to the<br />
remote site.<br />
RAs not accessible to <strong>SafeGuard</strong> 30m<br />
splitter<br />
Server unable to connect with SAN<br />
(See “Server Unable to Connect with<br />
SAN” in Section 9. This problem is not<br />
described in this section.)<br />
Total SAN switch failure on one site in a<br />
geographic clustered environment<br />
6–2 6872 5688–002
Volume Not Accessible to RAs<br />
Problem Description<br />
Symptoms<br />
Solving SAN Connectivity Problems<br />
A volume (repository volume, replication volume, or journal) is not accessible to one or<br />
more RAs, but it is accessible to all other relevant initiators—that is, the splitter.<br />
The following symptoms might help you identify this failure:<br />
• The system pauses the transfer. If the volume is accessible to another RA, a<br />
switchover occurs, and the relevant group or groups start running on the new RA.<br />
• The management console displays failures similar to those in Figure 6–1.<br />
Figure 6–1. Management Console Showing “Inaccessible Volume” Errors<br />
• Warnings and informational messages similar to those shown in Figure 6–2 appear<br />
on the management console. See the table after the figure for an explanation of the<br />
numbered console messages.<br />
Figure 6–2. Management Console Messages for Inaccessible Volumes<br />
6872 5688–002 6–3
Solving SAN Connectivity Problems<br />
Referenc<br />
e No.<br />
The following table explains the numbered messages shown in Figure 6–2.<br />
Event<br />
ID<br />
Description<br />
1 3012 The RA is unable to access the<br />
volume (RA 2, quorum).<br />
2 5049 Splitter writer to RA failed. X<br />
3 4003 For each consistency group, the<br />
surviving site reports a group<br />
consistency problem. The details<br />
show a WAN problem.<br />
4 4044 The group is deactivated indefinitely<br />
by the system.<br />
5 4003 For each consistency group, a minor<br />
problem is reported. The details<br />
show that sides are not linked and<br />
also cannot transfer data.<br />
6 4001 For each consistency group, a minor<br />
problem is reported. The details<br />
show that sides are not linked and<br />
also cannot transfer data.<br />
7 5032 The splitter is splitting to replication<br />
volumes.<br />
E-mail<br />
Immediate<br />
E-mail<br />
Daily<br />
Summary<br />
To see the details of the messages listed on the management console display, you<br />
must collect the logs and then review the messages for the time of the failure.<br />
Appendix A explains how to collect the management console logs, and Appendix E<br />
lists the event IDs with explanations.<br />
• If you review the Windows system event log, you can find messages similar to the<br />
following examples that are based on the testing cases used to generate the<br />
previous management console images:<br />
System Event Log for USMV-SYDNEY Host (Host on Failure Site)<br />
5/28/2008 9:31:53 PM ClusSvc Error Physical Disk Resource 1038 N/A USMV-SYDNEY<br />
Reservation of cluster disk 'Disk Q:' has been lost. Please check your system and disk configuration<br />
5/28/2008 9:31:53 PM Srv Warning None 2012 N/A USMV-SYDNEY While transmitting or receiving<br />
data, the server encountered a network error. Occasional errors are expected, but large amounts of these<br />
indicate a possible error in your network configuration. The error status code is contained within the<br />
returned data (formatted as Words) and may point you towards the problem.<br />
5/28/2008 9:31:54 PM Ftdisk Warning Disk 57 N/A USMV CAS100P2 the system failed to<br />
flush data to the transaction log. Corruption may occur.<br />
5/28/2008 9:32:54 PM Service Control Manager Information None 7035 CLUSTERNET\clusadminUSMV-<br />
SYDNEY The Windows Internet Name Service (WINS) service was successfully sent a stop control.<br />
6–4 6872 5688–002<br />
X<br />
X<br />
X<br />
X<br />
X<br />
X
Solving SAN Connectivity Problems<br />
System Event Log for Usmv-x455 Host (Host on Surviving Site)<br />
5/28/2008 9:32:56 PM ClusSvc Warning Node Mgr 1123 N/A USMV-X455<br />
The node lost communication with cluster node 'USMV-SYDNEY' on network '<strong>Public</strong>'.<br />
5/28/2008 9:32:56 PM ClusSvc Warning Node Mgr 1123 N/A USMV-X455<br />
The node lost communication with cluster node 'USMV-SYDNEY' on network 'Private LAN'.<br />
5/28/2008 9:33:10 PM ClusDisk Error None 1209 N/A USMV-X455<br />
Cluster service is requesting a bus reset for device \Device\ClusDisk0.<br />
5/28/2008 9:33:30 PM ClusSvc Warning Node Mgr 1135 N/A USMV-X455 Cluster node USMV-<br />
SYDNEY was removed from the active server cluster membership. Cluster service may have been<br />
stopped on the node, the node may have failed, or the node may have lost communication with the other<br />
active server cluster nodes.<br />
5/28/2008 9:33:30 PM ClusSvc Information Failover Mgr 1200 N/A USMV-X455<br />
"The Cluster Service is attempting to bring online the Resource Group ""Cluster Group""."<br />
5/28/2008 9:33:34 PM ClusSvc Information Failover Mgr 1201 N/A USMV-X455<br />
"The Cluster Service brought the Resource Group ""Cluster Group"" online."<br />
5/28/2008 9:34:08 PM Service Control Manager Information None 7036 N/A USMV-X455<br />
The Windows Internet Name Service (WINS) service entered the running state.<br />
• If you review the cluster log, you can find messages similar to the following<br />
examples that are based on the testing cases used to generate the previous<br />
management console images:<br />
Cluster Log for USMV-SYDNEY Host (Host on Failure Site)<br />
00000e44.00000380::2008/05/28-21:31:53.841 ERR Physical Disk : [DiskArb]<br />
CompletionRoutine: reservation lost! Status 170 (Error 170: the requested resource is in use)<br />
00000e44.00000380::2008/05/28-21:31:53.841 ERR [RM] LostQuorumResource, cluster service<br />
terminated...<br />
00000e44.00000f0c::2008/05/28-21:31:55.011 ERR Network Name : Unable to<br />
open handle to cluster, status 1753. (Error 1753: there are no more endpoints available from the endpoint<br />
mapper)<br />
00000e44.00000f08::2008/05/28-21:31:55.341 ERR IP Address : WorkerThread:<br />
GetClusterNotify failed with status 6. (Error 6: the handle is invalid)<br />
00000e44.00000f0c::2008/05/28-1:35:56.125 ERR Physical Disk : [DiskArb] Failed to read<br />
(sector 12), error 170.<br />
00000e44.00000f0c::2008/05/28-1:35:56.125 ERR Physical Disk : [DiskArb] Error cleaning<br />
arbitration sector, error 170.<br />
Cluster Log for Usmv-x455 Host (Host on Surviving Site)<br />
0000015c.00000234::2008/05/28-21:31:56.299 INFO [ClMsg] Received interface unreachable event for<br />
node 1 network 2<br />
0000015c.00000234::2008/05/28-21:31:56.299 INFO [ClMsg] Received interface unreachable event for<br />
node 1 network 1<br />
00000688.00000e10::2008/05/28-1:35:10.712 ERR Physical Disk : [DiskArb] Signature of disk<br />
has changed or failed to find disk with id, old signature 0x98f3f0b new signature 0x98f3f0b, status 2.<br />
(Error 2: The system cannot find the file specified)<br />
0000015c.000007c8::2008/05/28-1:35:31.136 WARN [NM] Interface f409cf69-9c30-48f0-8519ad5dd14c3300<br />
is unavailable (node: USMV-SYDNEY, network: Private LAN).<br />
0000015c.000004fc::2008/05/28-1:35:31.136 WARN [NM] Interface 5019923b-d7a1-4886-825f-<br />
207b5938d11e is unavailable (node: USMV-SYDNEY, network: <strong>Public</strong>).<br />
6872 5688–002 6–5
Solving SAN Connectivity Problems<br />
Actions to Resolve the Problem<br />
Perform the following actions to isolate and resolve the problem:<br />
• Verify that the physical connection between the inaccessible RAs and the Fibre<br />
Channel switch is healthy.<br />
• Verify that any disconnected RA appears in the name server of the Fibre Channel<br />
switch. If not, the problem could be because of a bad port on the switch, a bad host<br />
bus adaptor (HBA), or a bad cable.<br />
• Verify that any disconnected RA is present in the proper zone and that the current<br />
zoning configuration is enabled.<br />
• Verify that the correct volume is configured (WWN and LUN). To double-check, enter<br />
the Create Volume command in the management console, and verify that the same<br />
volume does not appear on the list of volumes that are available to be “created.”<br />
• If the volume is not accessible to the RAs but is accessible to a splitter, and the<br />
server on which that splitter is installed is clustered using MSCS, Oracle RAC, or any<br />
other software that uses a reservation method, the problem probably occurs<br />
because the server has reserved the volume.<br />
For more information about the clustered environment installation process, see the<br />
Unisys <strong>SafeGuard</strong> <strong>Solutions</strong> Planning and Installation <strong>Guide</strong> and the Unisys<br />
<strong>SafeGuard</strong> <strong>Solutions</strong> Replication Appliance Administrator's <strong>Guide</strong>.<br />
6–6 6872 5688–002
Solving SAN Connectivity Problems<br />
Volume Not Accessible to <strong>SafeGuard</strong> 30m Splitter<br />
Problem Description<br />
Symptoms<br />
A volume (repository volume, replication volume, or journal) is not accessible to one or<br />
more splitters but is accessible to all other relevant initiators (for example, the RAs).<br />
The following symptoms might help you identify this failure:<br />
• The system pauses the transfer for the relevant groups.<br />
• If the repository volume is not accessible, the management console shows an error<br />
for the splitter. If a replication volume is not accessible, the splitter connection to<br />
that volume shows an error.<br />
• The management console System Status screen and the Splitter Settings screen<br />
show error indications similar to those in Figure 6–3.<br />
Figure 6–3. Management Console Error Display Screen<br />
• Warnings and informational messages similar to those shown in Figure 6–4 appear<br />
on the management console. See the table after the figure for an explanation of the<br />
numbered console messages.<br />
6872 5688–002 6–7
Solving SAN Connectivity Problems<br />
Figure 6–4. Management Console Messages for Volumes Inaccessible to Splitter<br />
6–8 6872 5688–002
Solving SAN Connectivity Problems<br />
The following table explains the numbered messages shown in Figure 6–4.<br />
Reference<br />
No. Event ID Description<br />
1 4008 For each consistency group at the failed site, the<br />
transfer is paused to allow a failover to the<br />
surviving site.<br />
E-mail<br />
Immediate<br />
2 5030 The splitter write operation failed. X<br />
3 4001 For each consistency group, a minor problem is<br />
reported. The details show sides are not linked<br />
and cannot transfer data.<br />
E-mail Daily<br />
Summary<br />
4 4005 Negotiating Transfer Protocol X<br />
5 4016 Transferring the latest snapshot before pausing<br />
the transfer (no data is lost).<br />
6 4007 Pausing Data Transfer X<br />
7 4087 For each consistency group at the failed site,<br />
initialization completes.<br />
8 5032 The splitter is splitting to replication volumes at<br />
the surviving site.<br />
9 5049 Splitter write to RA failed X<br />
10<br />
4086<br />
For each consistency group at the failed site, the<br />
data transfer starts and then the initialization<br />
starts.<br />
11 4104 Group Started Accepting Writes X<br />
12 5015 Splitter is Up X<br />
To see the details of the messages listed on the management console display, you<br />
must collect the logs and then review the messages for the time of the failure.<br />
Appendix A explains how to collect the management console logs, and Appendix E<br />
lists the event IDs with explanations.<br />
6872 5688–002 6–9<br />
X<br />
X<br />
X<br />
X<br />
X
Solving SAN Connectivity Prooblems<br />
6–10<br />
• The multipathing sofftware<br />
(such as EMC PowerPath) on the server at the<br />
failed site<br />
reports disk error as shown in Figure 6–5.<br />
Figure 6–5.<br />
EMC PowerPath Shows Disk Error<br />
• If you review the Windows<br />
system event log, you can find messages sim milar to the<br />
following examples tthat<br />
are based on the testing cases used to generate e the<br />
previous management<br />
console images:<br />
System Event Log foor<br />
USMV-SYDNEY Host (Host on Failure Site e)<br />
5/29/2008 1:35:20 AM EmccpBase<br />
Error None 108 N/A USMV-SYDNEY Volume<br />
6006016011321100158233EDE0B23DB11<br />
is unbound.<br />
5/29/2008 1:35:20 AM EmccpBase<br />
to APM00042302162 is dead.<br />
Error None 100 N/A USMV-SYDNEY Path Bu us 5 Tgt 3 Lun 2<br />
5/29/2008 1:35:20 AM EmccpBase<br />
to APM00042302162 is dead.<br />
Error None 100 N/A USMV-SYDNEY Path Bu us 5 Tgt 0 Lun 2<br />
5/29/2008 1:35:20 AM EmccpBase<br />
to APM00042302162 is dead.<br />
Error None 100 N/A USMV-SYDNEY Path Bu us 3 Tgt 3 Lun 2<br />
5/29/2008 1:35:20 AM EmccpBase<br />
to APM00042302162 is dead.<br />
Error None 100 N/A USMV-SYDNEY Path Bu us 3 Tgt 0 Lun 2<br />
5/29/2008 1:35:20 AM EmccpBase<br />
Error None 104 N/A USMV-SYDNEY All path hs to<br />
6006016011321100158233EDE0B23DB11<br />
are dead.<br />
5/29/2008 1:35:20 AM Srv Error None 2000 N/A USMV-SYDNEY The server's call to t a system<br />
service failed unexpectedly.<br />
5/29/2008 1:36:18 AM Ftdiisk<br />
Warning Disk 57 N/A USMV-SYDNEY The system failed to flush<br />
data to the transaction logg.<br />
Corruption may occur.<br />
5/29/2008 1:36:18 AM Srv Error None 2000 N/A USMV-SYDNEY The server's call to t a system<br />
service failed unexpectedly.<br />
5/29/2008 1:36:18 AM Ntfss<br />
Warning None 50 N/A USMV-SYDNEY {Delayed Write Failed} F Windows<br />
was unable to save all thee<br />
data for the file. The data has been lost. This error may be cause ed by a failure of<br />
your computer hardware oor<br />
network connection. Please try to save this file elsewhere.<br />
68 872 5688–002
Solving SAN Connectivity Problems<br />
5/29/2008 1:36:18 AM Application Popup Information None 26 N/A USMV-SYDNEY<br />
Application popup: Windows - Delayed Write Failed : Windows was unable to save all the data for the file<br />
S:\$BitMap. The data has been lost. This error may be caused by a failure of your computer hardware or<br />
network connection. Please try to save this file elsewhere.<br />
5/29/2008 1:36:19 AM Service Control Manager Information None 7035 CLUSTERNET\clusadmin<br />
USMV-SYDNEY The Windows Internet Name Service (WINS) service was successfully sent a stop<br />
control.<br />
System Event Log for Usmv-x455 Host (Host on Surviving Site)<br />
5/29/2008 1:35:26 AM ClusSvc Warning Node Mgr 1123 N/A USMV-X455 The node lost<br />
communication with cluster node 'USMV-SYDNEY' on network '<strong>Public</strong>'.<br />
5/29/2008 1:35:26 AM ClusSvc Warning Node Mgr 1123 N/A USMV-X455 The node lost<br />
communication with cluster node 'USMV-SYDNEY' on network 'Private LAN'.<br />
5/29/2008 1:35:40 AM ClusDisk Error None 1209 N/A USMV-X455 Cluster service is requesting<br />
a bus reset for device \Device\ClusDisk0.<br />
5/29/2008 1:36:06 AM ClusSvc Warning Node Mgr 1135 N/A USMV-X455 Cluster node USMV-<br />
SYDNEY was removed from the active server cluster membership. Cluster service may have been<br />
stopped on the node, the node may have failed, or the node may have lost communication with the other<br />
active server cluster nodes.<br />
5/29/2008 1:36:06 AM ClusSvc Information Failover Mgr 1200 N/A USMV-X455 "The Cluster<br />
Service is attempting to bring online the Resource Group ""Cluster Group""."<br />
5/29/2008 1:36:10 AM ClusSvc Information Failover Mgr 1201 N/A USMV-X455 "The Cluster<br />
Service brought the Resource Group ""Cluster Group"" online."<br />
5/29/2008 1:36:36 AM Service Control Manager Information None 7035<br />
CLUSTERNET\clusadmin USMV-X455 The Windows Internet Name Service (WINS) service was<br />
successfully sent a start control.<br />
• If you review the cluster log, you can find messages similar to the following<br />
examples that are based on the testing cases used to generate the previous<br />
management console images:<br />
Cluster Log for USMV-SYDNEY Host (Host on Failure Site)<br />
00000d68.00000284::2008/05/29-1:35:21.703 ERR Physical Disk : [DiskArb]<br />
CompletionRoutine: reservation lost! Status 21 (Error 21: the device is not ready)<br />
00000d68.00000284::2008/05/29-1:35:22.713 ERR Physical Disk : [DiskArb]<br />
CompletionRoutine: reservation lost! Status 2 (Error 2: the system cannot find the file specified)<br />
00000d68.00000284::2008/05/29-1:35:22.713 ERR [RM] LostQuorumResource, cluster service<br />
terminated...<br />
00000d68.00000e68::2008/05/29-1:35:23.133 ERR Physical Disk : LooksAlive, error checking<br />
device, error 2.<br />
00000d68.00000e68::2008/05/29-1:35:23.133 ERR Physical Disk : IsAlive, error checking<br />
device, error 2.<br />
00000d68.00000e68::2008/05/29-1:35:23.143 ERR Network Name : Name query request<br />
failed, status 3221225860.<br />
00000d68.00000e68::2008/05/29-1:35:23.143 INFO Network Name : Name SYDNEY-<br />
AUCKLAND failed IsAlive/LooksAlive check, error 22. (Error 22: the device does not recognize the<br />
command)<br />
00000d68.00000cd0::2008/05/29-1:35:23.303 ERR Network Name : Unable to<br />
open handle to cluster, status 1753.<br />
00000d68.00000cd0::2008/05/29-21:33:19.245 ERR Physical Disk : [DiskArb] Failed to read<br />
(sector 12), error 1117. (Error 1117: the request could not be performed because of an I/O device error)<br />
00000d68.00000cd0::2008/05/29-21:33:19.245 ERR Physical Disk : [DiskArb] Error cleaning<br />
arbitration sector, error 1117.<br />
Cluster Log for Usmv-x455 Host (Host on Surviving Site)<br />
0000015c.00000234::2008/05/29-1:35:26.121 INFO [ClMsg] Received interface unreachable event for<br />
node 1 network 2<br />
0000015c.00000234::2008/05/29-1:35:26.121 INFO [ClMsg] Received interface unreachable event for<br />
node 1 network 1<br />
00000688.00000d08::2008/05/29-1:35:40.523 ERR Physical Disk : [DiskArb] GetPartInfo<br />
completed, status 170.<br />
00000688.00000d08::2008/05/29-1:35:40.653 ERR Physical Disk : [DiskArb] Failed to read<br />
(sector 12), error 170.<br />
6872 5688–002 6–11
Solving SAN Connectivity Problems<br />
Actions to Resolve the Problem<br />
Perform the following actions to isolate and resolve the problem:<br />
• Verify that the physical connection between the disconnected splitter or splitters and<br />
the Fibre Channel switch is healthy.<br />
• Verify that any host on which a disconnected splitter resides appears in the name<br />
server of the Fibre Channel switch. If not, the problem could be because of a bad<br />
port on the switch, a bad HBA, or a bad cable.<br />
• Verify that any host on which a disconnected splitter resides is present in the proper<br />
zone and that the current zoning configuration is enabled.<br />
• If a replication volume is not accessible to the splitter at the source site, but appears<br />
as OK in the management console for that splitter, verify that the splitter is not<br />
functioning at the target site (TSP not enabled). During normal replication, the<br />
system prevents target-site splitters from accessing the replication volumes.<br />
RAs Not Accessible to <strong>SafeGuard</strong> 30m Splitter<br />
Problem Description<br />
Symptoms<br />
One or more RAs on a site are not accessible to the splitter through the Fibre Channel.<br />
The following symptoms might help you identify this failure:<br />
• The system pauses the transfer for the relevant groups. If the connection with only<br />
one of the RAs is lost, the groups can restart the transfer by means of another RA,<br />
beginning with a short initialization.<br />
• The splitter connection to the relevant RAs shows an error.<br />
• The management console displays error indicators similar to those in Figure 6–6.<br />
Figure 6–6. Management Console Display Shows a Splitter Down<br />
• Warnings and informational messages similar to those shown in Figure 6–7 appear<br />
on the management console. See the table after the figure for an explanation of the<br />
numbered console messages.<br />
6–12 6872 5688–002
Solving SAN Connectivity Problems<br />
Figure 6–7. Management Console Messages for Splitter Inaccessible to RA<br />
6872 5688–002 6–13
Solving SAN Connectivity Problems<br />
Reference<br />
No.<br />
The following table explains the numbered messages shown in Figure 6–7.<br />
Event<br />
ID<br />
Description E-mail<br />
Immediate<br />
1 4005 The surviving site Negotiating transfer<br />
protocol<br />
2 4008 For each consistency group at the<br />
failed site, the transfer is paused to<br />
allow a failover to the surviving site.<br />
3 5002 The splitter for server USMV-SYDNEY<br />
is unable to access the RA.<br />
4 4105 The failed site stop accepting writes to<br />
the consistency group<br />
5 4008 For each consistency group at the<br />
failed site, the transfer is paused to<br />
allow a failover to the surviving site.<br />
6 5013 Splitter down problem X<br />
7 4087 The synchronization completed<br />
message after the splitter is restored<br />
and replication completes<br />
8 5032 The splitter starts splitting the<br />
replication volumes<br />
9 4001 Group capabilities reporting problem. X<br />
10 5032 The splitter is splitting to replication<br />
volumes<br />
13 5049 The splitter unable to write to the RAs X<br />
14 4086 The original site starts the<br />
synchronization<br />
15 4104 Consistency Group start replicating X<br />
E-mail<br />
Daily<br />
Summary<br />
To see the details of the messages listed on the management console display, you<br />
must collect the logs and then review the messages for the time of the failure.<br />
Appendix A explains how to collect the management console logs, and Appendix E<br />
lists the event IDs with explanations.<br />
• If you review the Windows system event log, you can find messages similar to the<br />
following examples that are based on the testing cases used to generate the<br />
previous management console images:<br />
6–14 6872 5688–002<br />
X<br />
X<br />
X<br />
X<br />
X<br />
X<br />
X<br />
X<br />
X
Solving SAN Connectivity Problems<br />
System Event Log for USMV-SYDNEY Host (Host on Failure Site)<br />
5/29/2008 2:25:20 AM ClusSvc Error Physical Disk Resource 1038 N/A USMV-SYDNEYReservation<br />
of cluster disk 'Disk Q:' has been lost. Please check your system and disk configuration.<br />
5/29/2008 2:25:20 AM Service Control Manager Error None 7034 N/A USMV-SYDNEYThe Cluster<br />
service terminated unexpectedly.<br />
5/29/2008 2:25:50 AM Srv Warning None 2012 N/A USMV-SYDNEY While transmitting or<br />
receiving data, the server encountered a network error. Occasional errors are expected, but large amounts<br />
of these indicate a possible error in your network configuration. The error status code is contained within<br />
the returned data (formatted as Words) and may point you towards the problem.<br />
5/29/2008 2:25:20 AM Ftdisk Warning Disk 57 N/A USMV-SYDNEY<br />
The system failed to flush data to the transaction log. Corruption may occur.<br />
5/29/2008 2:25:21 AM Ntfs Warning None 50 N/A USMV-SYDNEY {Delayed Write Failed}<br />
Windows was unable to save all the data for the file. The data has been lost. This error may be caused by<br />
a failure of your computer hardware or network connection. Please try to save this file elsewhere.<br />
5/29/2008 2:25:32 AM Ftdisk Warning Disk 57 N/A USMV-SYDNEY<br />
The system failed to flush data to the transaction log. Corruption may occur.<br />
5/29/2008 2:25:32 AM Srv Error None 2000 N/A USMV-SYDNEY<br />
The server's call to a system service failed unexpectedly.<br />
5/29/2008 2:25:32 AM ClusSvc Error IP Address Resource 1077 N/A USMV-SYDNEY<br />
The TCP/IP interface for Cluster IP Address '' has failed.<br />
5/29/2008 2:25:32 AM ClusSvc Error Physical Disk Resource 1036 N/A USMV-SYDNEY<br />
Cluster disk resource '' did not respond to a SCSI maintenance command.<br />
5/29/2008 2:25:32 AM ClusSvc Error Network Name Resource 1215 N/A USMV-SYDNEYCluster<br />
Network Name SYDNEY-AUCKLAND is no longer registered with its hosting system. The associated<br />
resource name is ''.<br />
System Event Log for Usmv-x455 Host (Host on Surviving Site)<br />
5/29/2008 2:25:23 AM ClusSvc Warning Node Mgr 1123 N/A USMV-X455<br />
The node lost communication with cluster node 'USMV-SYDNEY' on network '<strong>Public</strong>'.<br />
5/29/2008 2:25:23 AM ClusSvc Warning Node Mgr 1123 N/A USMV-X455<br />
The node lost communication with cluster node 'USMV-SYDNEY' on network 'Private LAN'.<br />
5/29/2008 2:25:37 AM ClusDisk Error None 1209 N/A USMV-X455<br />
Cluster service is requesting a bus reset for device \Device\ClusDisk0.<br />
5/29/2008 2:25:53 AM ClusSvc Warning Node Mgr 1135 N/A USMV-X455 Cluster node USMV-<br />
SYDNEY was removed from the active server cluster membership. Cluster service may have been<br />
stopped on the node, the node may have failed, or the node may have lost communication with the other<br />
active server cluster nodes.<br />
5/29/2008 2:25:53 AM ClusSvc Information Failover Mgr 1200 N/A USMV-X455<br />
"The Cluster Service is attempting to bring online the Resource Group ""Cluster Group""."<br />
5/29/2008 2:25:58 AM ClusSvc Information Failover Mgr 1201 N/A USMV-X455<br />
"The Cluster Service brought the Resource Group ""Cluster Group"" online."<br />
5/28/2008 2:25:35 AM Service Control Manager Information None 7035<br />
CLUSTERNET\clusadmin USMV-X455<br />
The Windows Internet Name Service (WINS) service was successfully sent a start control.<br />
5/29/2008 2:25:37 AM Service Control Manager Information None 7035 NT<br />
AUTHORITY\SYSTEM USMV-X455<br />
The Windows Internet Name Service (WINS) service was successfully sent a continue control.<br />
• If you review the cluster log, you can find messages similar to the following<br />
examples that are based on the testing cases used to generate the previous<br />
management console images:<br />
6872 5688–002 6–15
Solving SAN Connectivity Problems<br />
Cluster Log for USMV-SYDNEY Host (Host on Failure Site)<br />
00000f70.00000d10::2008/05/29-2:25:20.426 ERR Physical Disk : [DiskArb]<br />
CompletionRoutine: reservation lost! Status 31. (Error 31: a device attached to the system is not<br />
functioning)<br />
00000f70.00000d10::2008/05/29-2:25:20.426 ERR [RM] LostQuorumResource, cluster service<br />
terminated...<br />
00000f70.00000e78::2008/05/29-2:25:32.778 ERR Physical Disk : IsAlive, error checking device,<br />
error 995. (Error 995: The I/O operation has been aborted because of either a thread exit or an application<br />
request)<br />
00000f70.00000e78::2008/05/29-2:25:32.778 ERR Physical Disk : LooksAlive, error checking<br />
device, error 31.<br />
00000f70.00000e78::2008/05/29-2:25:32.778 ERR Physical Disk : IsAlive, error checking<br />
device, error 31.<br />
00000f70.00000e78::2008/05/29-2:25:32.778 ERR Network Name : Name query request<br />
failed, status 3221225860.<br />
00000f70.00000b54::2008/05/29-2:25:32.868 ERR Network Name : Unable to open<br />
handle to cluster, status 1753. (Error 1753: there are no more endpoints available from the endpoint<br />
mapper)<br />
00000f70.00000b54::2008/05/29-2:25:33.258 ERR Physical Disk : Terminate, error opening<br />
\Device\Harddisk10\Partition1, error C0000022.<br />
00000f70.00000b54::2008/05/29-2:25:33.528 ERR Physical Disk : [DiskArb] Failed to read<br />
(sector 12), error 170. (Error 170: the requested resource is in use)<br />
00000f70.00000b54::2008/05/29-2:25:33.528 ERR Physical Disk : [DiskArb] Error cleaning<br />
arbitration sector, error 170.<br />
Cluster Log for Usmv-x455 Host (Host on Surviving Site)<br />
0000015c.00000234::2008/05/29-2:25:23.496 INFO [ClMsg] Received interface unreachable event for<br />
node 1 network 2<br />
0000015c.00000234::2008/05/29-2:25:23.496 INFO [ClMsg] Received interface unreachable event for<br />
node 1 network 1<br />
00000688.00000d08::2008/05/29-2:25:37.898 ERR Physical Disk : [DiskArb] GetPartInfo<br />
completed, status 170.<br />
00000688.00000d08::2008/05/29-2:25:37.898 ERR Physical Disk : [DiskArb] Failed to read<br />
(sector 12), error 170.<br />
Actions to Resolve the Problem<br />
Perform the following actions to isolate and resolve the problem:<br />
• Identify which of the components is the problematic one. A problematic component<br />
is likely to have additional errors or problems:<br />
− A problematic RA might not be accessible to other splitters or might not<br />
recognize certain volumes.<br />
− A problematic splitter might not recognize any RAs or the storage subsystem.<br />
• Connect to the storage switch to verify the status of each connection. Ensure that<br />
each connection is configured correctly.<br />
• If you cannot find any additional problems, there is a good chance that the problem is<br />
with the zoning; that is, somehow, the splitters are not exposed to the RAs.<br />
• Verify the physical connectivity of the RAs and the servers (those on which the<br />
potentially problematic splitters reside) to the Fibre Channel switch. For each<br />
connection, verify that it is healthy and appears correctly in the name server, zoning,<br />
and so forth.<br />
• Verify that this is not a temporary situation---for instance, if the RAs were rebooting<br />
or recovering from another failure, the splitter might not yet identify them.<br />
6–16 6872 5688–002
Total SAN Switcch<br />
Failure on One Site in a<br />
Geographic Clusstered<br />
Environment<br />
6872 5688–002<br />
Solving SAN Connec ctivity Problems<br />
A total SAN switch failure implies that cluster nodes and RAs have lost t access to the<br />
storage device thatt<br />
was connected to the SAN on one site. This failure causes the<br />
cluster nodes to losse<br />
their reservation of the physical disks and triggers s an MSCS failover<br />
to the remote site. In a geographic clustered environment where MSCS S is running, if the<br />
connection to a storage<br />
device on one site fails, the symptoms and res sulting actions<br />
depend on whetherr<br />
or not the quorum owner resided on the failed stor rage device.<br />
To understand the ttwo<br />
scenarios and to follow the actions for both pos ssibilities, review<br />
Figure 6–8.<br />
FFigure<br />
6–8. SAN Switch Failure on One Site e<br />
6–17
Solving SAN Connectivity Problems<br />
Cluster Quorum Owner Located on Site with Failed SAN Switch<br />
Problem Description<br />
Symptoms<br />
The following point explains the expected behavior of the MSCS Reservation Manager<br />
when an event of this nature occurs:<br />
• If the cluster quorum owner is located on the site with the failed SAN, the quorum<br />
reservation is lost. This loss causes the cluster nodes to fail and triggers a cluster<br />
“regroup” process. This regroup process allows other cluster nodes participating in<br />
the cluster to arbitrate for the quorum device.<br />
Cluster nodes located on the failed SAN fail quorum arbitration because the failed<br />
SAN is not able to provide a reservation on the quorum volume. The cluster nodes in<br />
the remote location attempt to reserve the quorum device and succeed arbitration of<br />
the quorum. The node that owns the quorum device assumes ownership of the<br />
cluster. The cluster owner brings online the data groups that were owned by the<br />
failed site.<br />
The following symptoms might help you identify this failure:<br />
• All resources fail over to the surviving site (site 2 in this case) and come online<br />
successfully. Cluster nodes fail at the source site. If the consistency groups are<br />
configured asynchronously, this failover results in loss of data. The failover is fully<br />
automated and does not require additional downtime. The RAs cannot replication<br />
data until the SAN is operational.<br />
• Failures are reported on the server and the management console. Replication<br />
stopped on all consistency groups.<br />
• The management console displays error indications similar to those in Figure 6–9.<br />
Figure 6–9. Management Console Display with Errors for Failed SAN Switch<br />
• Warnings and informational messages similar to those shown in Figure 6–10 appear<br />
on the management console. See the table after the figure for an explanation of the<br />
numbered console messages.<br />
6–18 6872 5688–002
Solving SAN Connectivity Problems<br />
Figure 6–10. Management Console Messages for Failed SAN Switch<br />
6872 5688–002 6–19
Solving SAN Connectivity Problems<br />
Reference<br />
No.<br />
The following table explains the numbered messages shown in Figure 6–10.<br />
Event<br />
ID<br />
Description<br />
1 3012 The RA is unable to access the<br />
volume.<br />
E-mail<br />
Immediate<br />
2 5002 RA unable to access splitter X<br />
3 4001 The surviving site reports of the<br />
Group Capabilities problem<br />
4 4008 The Surviving site pauses the data<br />
transfer<br />
5 5013 The original site reporting the<br />
splitter down status<br />
6 4003 For each consistency group, the<br />
surviving site reports a group<br />
consistency problem. The details<br />
show a WAN problem.<br />
7 3014 The RA is unable to access the<br />
repository volume.<br />
8 4044 The group is deactivated indefinitely<br />
by the system.<br />
9 4007 The system is pausing data transfer<br />
on the surviving site (Quorum ---<br />
South).<br />
E-mail<br />
Daily<br />
Summary<br />
10 4086 Synchronization started message X<br />
11 4000 Group capabilities OK message X<br />
12 5032 The splitter starts splitting X<br />
To see the details of the messages listed on the management console display, you<br />
must collect the logs and then review the messages for the time of the failure.<br />
Appendix A explains how to collect the management console logs, and Appendix E<br />
lists the event IDs with explanations.<br />
• If you review the Windows system event log, you can find messages similar to the<br />
following examples that are based on the testing cases used to generate the<br />
previous management console images:<br />
6–20 6872 5688–002<br />
X<br />
X<br />
X<br />
X<br />
X<br />
X<br />
X<br />
X
Solving SAN Connectivity Problems<br />
System Event Log for USMV-SYDNEY Host (Host on Failure Site)<br />
5/29/2008 05:15:31 PM Application Popup Information None 26 N/A USMV-SYDNEY<br />
Application popup: Windows - Delayed Write Failed : Windows was unable to save all the data for the file<br />
Q:\. The data has been lost. This error may be caused by a failure of your computer hardware or network<br />
connection. Please try to save this file elsewhere.<br />
5/29/2008 05:15:31 PM Ftdisk Warning Disk 57 N/A USMV-SYDNEY The system failed to<br />
flush data to the transaction log. Corruption may occur.<br />
5/29/2008 05:15:31 PM Ftdisk Warning Disk 57 N/A USMV-SYDNEY The system failed to<br />
flush data to the transaction log. Corruption may occur.<br />
System Event Log for USMV-AUCKLAND Host (Host on Surviving Site)<br />
5/29/2008 05:13:33 PM ClusSvc Error Physical Disk Resource 1038 N/A USMV-SYDNEY<br />
Reservation of cluser disk 'Disk Q:' has been lost. Please check your system and disk configuration.<br />
5/29/2008 05:13:33 PM Service Control Manager Error None 7031 N/A USMV-SYDNEY<br />
The Cluster Service terminated unexpectedly. It has done this 2 time(s). The following corrective action<br />
will be taken in 120000 milliseconds: Restart the service.<br />
5/29/2008 05:15:31 PM Application Popup Information None 26 N/A USMV-SYDNEY<br />
Application popup: Windows - Delayed Write Failed : Windows was unable to save all the data for the file<br />
Q:\$Mft. The data has been lost. This error may be caused by a failure of your computer hardware or<br />
network connection. Please try to save this file elsewhere.<br />
5/29/2008 05:15:31 PM Ftdisk Warning Disk 57 N/A USMV-SYDNEY The system failed to<br />
flush data to the transaction log. Corruption may occur.<br />
• If you review the cluster log, you can find messages similar to the following<br />
examples that are based on the testing cases used to generate the previous<br />
management console images:<br />
Cluster Log for USMV-SYDNEY Host (Host on Failure Site)<br />
00001130.00001354::2008/5/29-17:14:33.712 ERR Physical Disk : [DiskArb]<br />
CompletionRoutine: reservation lost! Status 170 (Error 170: the requested resource is in use)<br />
00001130.00001354::2008/5/29-17:14:33.712 ERR [RM] LostQuorumResource, cluster service<br />
terminated...<br />
00001130.00001744::2008/5/29-17:15:31.733 ERR Physical Disk : [DiskArb] Failed to read<br />
(sector 12), error 170.<br />
00001130.00001744::2008/5/29-17:15:31.733 ERR Physical Disk : [DiskArb] Error cleaning<br />
arbitration sector, error 170.<br />
00001130.00001744::2008/5/29-17:15:31.733 ERR Network Name : Unable to open<br />
handle to cluster, status 1753. (Error 1753: there are no more endpoints available from the endpoint<br />
mapper)<br />
00001130.00000d3c::2008/5/29-17:15:31.733 ERR IP Address : WorkerThread:<br />
GetClusterNotify failed with status 6. (Error 6: the handle is invalid)<br />
6872 5688–002 6–21
Solving SAN Connectivity Problems<br />
Cluster Log for USMV-AUCKLAND Host (Host on Surviving Site)<br />
00000668.00000d90::2008/5/29-17:14:35.120 INFO [ClMsg] Received interface unreachable event for<br />
node 2 network 1<br />
00000668.00000d90::2008/5/29-17:14:35.120 INFO [ClMsg] Received interface unreachable event for<br />
node 2 network 2<br />
00000bb8.00000d0c::2008/5/29-17:14:49.706 ERR Physical Disk : [DiskArb] GetPartInfo<br />
completed, status 170.<br />
00000bb8.00000d0c::2008/5/29-17:14:49.706 ERR Physical Disk : [DiskArb] Failed to read<br />
(sector 12), error 170.<br />
Actions to Resolve the Problem<br />
To resolve this situation, diagnose the SAN switch failure.<br />
Cluster Quorum Owner Not on Site with Failed SAN Switch<br />
Problem Description<br />
Symptoms<br />
The following points explain the expected behavior of the MSCS Reservation Manager<br />
when an event of this nature occurs:<br />
• If a SAN failure occurs and the cluster nodes do not own the quorum resource, the<br />
state of the cluster services on these nodes is not affected.<br />
• The cluster nodes remain as active cluster members; however, the data groups<br />
containing the <strong>SafeGuard</strong> 30m Control instance and the physical disk resources on<br />
these nodes are marked as failed, and any applications dependent on them are taken<br />
offline. These resources first try to restart, and then eventually fail over to the<br />
surviving site.<br />
The following symptoms might help you identify this failure:<br />
• Applications fail and attempt to restart.<br />
• The data groups containing the <strong>SafeGuard</strong> 30m Control instance and the physical<br />
disk resources on these nodes are marked as failed, and any applications dependent<br />
on them are taken offline. These resources first try to restart, and then eventually fail<br />
over to the surviving site. The cluster nodes remain as active cluster members.<br />
• The management console displays error indications similar to those in Figure 6–9.<br />
• Warnings and informational messages similar to those shown in Figure 6–11 appear<br />
on the management console. See the table after the figure for an explanation of the<br />
numbered console messages.<br />
6–22 6872 5688–002
Solving SAN Connectivity Problems<br />
Figure 6–11. Management Console Messages for Failed SAN Switch with Quorum<br />
Owner on Surviving Site<br />
6872 5688–002 6–23
Solving SAN Connectivity Problems<br />
Reference<br />
No.<br />
The following table explains the numbered messages shown in Figure 6–11.<br />
Event ID<br />
Description<br />
1 5002 The RA is unable to access<br />
the splitter.<br />
2 3012 The RA is unable to access<br />
the volume (RA 2, Quorum).<br />
3 4003 For each consistency group,<br />
the surviving site reports a<br />
group consistency problem.<br />
The details show a WAN<br />
problem.<br />
4 3014 The RA is unable to access<br />
the repository volume<br />
(RA2).<br />
5 4009 The system is pausing data<br />
transfer on the failure site<br />
6 4044 The group is deactivated<br />
indefinitely by the system.<br />
E-mail<br />
Immediate<br />
E-mail<br />
Daily<br />
Summary<br />
To see the details of the messages listed on the management console display, you<br />
must collect the logs and then review the messages for the time of the failure.<br />
Appendix A explains how to collect the management console logs, and Appendix E<br />
lists the event IDs with explanations.<br />
• If you review the Windows system event log, you can find messages similar to the<br />
following examples that are based on the testing cases used to generate the<br />
previous management console images:<br />
System Event Log for USMV-SYDNEY Host (Host on Failure Site)<br />
5/29/2008 5:14:24 PM ClusDisk Error None<br />
a bus reset for device \Device\ClusDisk0.<br />
1209 N/A USMV-AUCKLAND Cluster service is requesting<br />
5/29/2008 5:14:38 PM ClusSvc Warning Node Mgr 1123 N/A USMV- AUCKLAND The node lost<br />
communication with cluster node 'USMV-SYDNEY' on network 'Private LAN'.<br />
5/29/2008 5:14:39 PM ClusSvc Information Node Mgr 1122 N/A USMV- AUCKLAND The node<br />
(re)established communication with cluster node 'USMV-SYDNEY' on network 'Private LAN'.<br />
6–24 6872 5688–002<br />
X<br />
X<br />
X<br />
X<br />
X<br />
X
Solving SAN Connectivity Problems<br />
System Event Log for Usmv-Auckland Host (Host on Surviving Site)<br />
5/29/2008 5:14:38 PM ClusSvc Warning Node Mgr 1123 N/A USMV- AUCKLAND The node lost<br />
communication with cluster node 'USMV-SYDNEY' on network 'Private LAN'.<br />
5/29/2008 5:14:39 PM ClusSvc Information Node Mgr 1122 N/A USMV- AUCKLAND The node<br />
(re)established communication with cluster node 'USMV-SYDNEY' on network 'Private LAN'.<br />
• If you review the cluster log, you can find messages similar to the following<br />
examples that are based on the testing cases used to generate the previous<br />
management console images:<br />
Cluster Log for Usmv USMV-SYDNEY Host (Host on Failure Site)<br />
00001524.00000360::2008/5/29-17:14:56.750 ERR Physical Disk : [DiskArb] GetPartInfo<br />
completed, status 170.<br />
00001524.00000360::2008/5/29-17:14:56.750 ERR Physical Disk : [DiskArb] Failed to read<br />
(sector 12), error 170.<br />
00001524.000017e4::2008/5/29-17-15:22.899 ERR IP Address : WorkerThread:<br />
GetClusterNotify failed with status 6.<br />
Cluster Log for USMV-AUCKLAND Host (Host on Surviving Site)<br />
00000bb8.00000c5c::2008/5/29-17:14:14.596 ERR IP Address : WorkerThread:<br />
GetClusterNotify failed with status 6.<br />
00000bb8.0000026c::2008/5/29-17:14:24.188 ERR Physical Disk : [DiskArb] GetPartInfo<br />
completed, status 170.<br />
00000bb8.0000026c::2008/5/29-17:14:24.188 ERR Physical Disk : [DiskArb] Failed to read<br />
(sector 12), error 170.<br />
Actions to Resolve the Problem<br />
To resolve this situation, diagnose the SAN switch failure.<br />
6872 5688–002 6–25
Solving SAN Connectivity Problems<br />
6–26 6872 5688–002
Section 7<br />
Solving Network Problems<br />
This section lists symptoms that usually indicate networking problems. Table 7–1 lists<br />
symptoms and possible problems indicated by the symptom. The problems and their<br />
solutions are described in this section. The graphics, behaviors, and examples in this<br />
section are similar to what you observe with your system but might differ in some<br />
details.<br />
In addition to the symptoms listed, you might receive e-mail messages or SNMP traps<br />
for possible problems. Also, messages are displayed on the management console similar<br />
to the e-mail messages. If you do not see the messages, they might have already<br />
dropped off the display. Review the management console logs for messages that have<br />
dropped off the display.<br />
Table 7–1. Possible Networking Problems with Symptoms<br />
Symptom Possible Problem<br />
The cluster groups with the failed network<br />
connection fail over to the next preferred<br />
node. If only one node is configured at the<br />
site with the failure, replication direction<br />
changes and applications run on the<br />
backup site.<br />
If the NIC is teamed, no failover occurs and<br />
no symptoms are obvious.<br />
The networks on the Cluster Administrator<br />
screen show an error.<br />
Host system and application event log<br />
messages contain error or warning<br />
messages.<br />
Clients on site 2 are not able to access<br />
resources associated with the IP resource<br />
located on site 1.<br />
<strong>Public</strong> communication between the two<br />
sites fails, only allowing local cluster public<br />
communication between cluster nodes and<br />
local clients.<br />
The networks on the Cluster Administrator<br />
screen show an error.<br />
<strong>Public</strong> NIC failure on a cluster node in a<br />
geographic clustered environment<br />
<strong>Public</strong> or client WAN failure in a geographic<br />
clustered environment<br />
6872 5688–002 7–1
Solving Network Problems<br />
Table 7–1. Possible Networking Problems with Symptoms<br />
Symptom Possible Problem<br />
You cannot access the management<br />
console or initiate an SSH session through<br />
PuTTY using the management IP address<br />
of the remote site.<br />
Management console log indicates that the<br />
WAN data links to the RAs are down.<br />
All consistency groups show the transfer<br />
status as “Paused by system.”<br />
On the management console, all<br />
consistency groups show the transfer<br />
status switching between “Paused by<br />
system” and “initializing/active.” All<br />
groups appear unstable over the WAN<br />
connection.<br />
The networks on the Cluster Administrator<br />
screen show an error.<br />
You cannot access the management<br />
console using the management IP address<br />
of the remote site.<br />
The cluster is no longer accessible from<br />
nodes except from one surviving node.<br />
Unable to reach DNS server.<br />
Unable to communicate to NTP server.<br />
Unable to reach mail server.<br />
The management console shows errors for<br />
the WAN or for RA data links.<br />
The management console logs show RA<br />
communication errors.<br />
Management network failure in a<br />
geographic clustered environment<br />
Replication network failure in a geographic<br />
clustered environment<br />
Temporary WAN failures<br />
Private cluster network failure in a<br />
geographic clustered environment<br />
Total communication failure in a<br />
geographic clustered environment<br />
Port information<br />
7–2 6872 5688–002
<strong>Public</strong> NIC Failuure<br />
on a Cluster Node in a<br />
Geographic Clusstered<br />
Environment<br />
Problem Description<br />
6872 5688–002<br />
If a public network interface card (NIC) of a cluster node failed, the clus ster node of the<br />
failed public NIC cannot<br />
access clients. The cluster node of the failed NIC N can participate<br />
in the cluster as a mmember<br />
because it can communicate over the privat te cluster<br />
network. Other clusster<br />
nodes are not affected by this error.<br />
The MSCS software<br />
detects a failed network and the cluster resources s fail over to the<br />
next preferred nodee.<br />
All cluster groups used for replication that contain a virtual IP<br />
address for the faileed<br />
network connection succeed to fail over to the ne ext preferred<br />
node. However, thee<br />
Unisys <strong>SafeGuard</strong> 30m Control resources cannot fail f back to the<br />
node with a failed ppublic<br />
network because they cannot communicate with w the site<br />
management IP adddress<br />
of the RAs.<br />
Note: A teamed ppublic<br />
network interface does not experience this pr roblem and<br />
therefore is the reccommended<br />
configuration.<br />
Figure 7–1 illustratees<br />
this failure.<br />
Solving Net twork Problems<br />
Figgure<br />
7–1. <strong>Public</strong> NIC Failure of a Cluster Node<br />
7–3
Solving Network Problems<br />
Symptoms<br />
The following symptoms might help you identify this failure:<br />
• All cluster groups used for replication that contain a virtual IP address for the failed<br />
network connection fail over to the next preferred node.<br />
• If no other node exists at the same site, replication direction changes and the<br />
application run at the backup site.<br />
• If you review the host system event log, you can find messages similar to the<br />
following examples:<br />
Windows System Event Log Messages on Host Server<br />
Type: error<br />
Source: ClusSvc<br />
EventID: 1077, 1069<br />
Description: The TCP/IP interface for Cluster IP Address “xxx” has failed.<br />
Type: error<br />
Source: ClusSvc<br />
EventID: 1069<br />
Description: Cluster resource ‘xxx’ in Resource Group ‘xxx’ failed.<br />
Type: error<br />
Source: ClusSvc<br />
EventID: 1127<br />
Description: The interface for cluster node ‘xxx’ on network ‘xxx’ failed. If the condition persists, check<br />
the cabling connecting the node to the network. Next, check for hardware or software errors in nodes’s<br />
network Adapter.<br />
• If you attempt to move a cluster group to the node with the failing public NIC, the<br />
event 2002 message is displayed in the host application event log.<br />
Application Event Log Message on Host Server<br />
Type: warning<br />
Source: 30mControl<br />
Event Category: None<br />
EventID: 2002<br />
Date : 05/30/2008<br />
Time: 11:12:02 AM<br />
User : N/A\<br />
Computer: USMV-DL580<br />
Description: Online resource failed. RA CLI command failed because of a network communication error or<br />
invalid IP address.<br />
Action: Verify the network connection between the system and the site management IP Address<br />
specified for the resource. Ping each site management IP Address specified for the specified resource.<br />
Note: The preceding information can also be viewed in the cluster log.<br />
7–4 6872 5688–002
6872 5688–002<br />
• The managemeent<br />
console display and management console logs do d not show any<br />
errors.<br />
• When the publiic<br />
NIC fails on a node that does not use teaming, the e Cluster<br />
Administrator ddisplays<br />
an error indicator similar to Figure 7–2. If the e public NIC<br />
interface is teammed,<br />
you do not see error messages in the Cluster Administrator.<br />
Figure 7–2. Pubblic<br />
NIC Error Shown in the Cluster Adminis strator<br />
Actions to Resolve thhe<br />
Problem<br />
Perform the followiing<br />
actions to isolate and resolve the problem:<br />
Solving Net twork Problems<br />
1. In the Cluster AAdministrator,<br />
verify that the public interface for all nodes<br />
is in an<br />
“Up” state. If mmultiple<br />
nodes at a site show public connections failed<br />
in the Cluster<br />
Administrator, pphysically<br />
check the network switch for connection errors.<br />
If the private neetwork<br />
also shows errors, physically check the netw work switch for<br />
connection erroors.<br />
2. Inspect the NICC<br />
link indicators on the host and, from a client, use th he Ping command<br />
to verify the physical<br />
IP address of the adapter (not the virtual IP ad ddress).<br />
3. Isolate a NIC orr<br />
cabling issue by moving cables at the network swit tch and at the NIC.<br />
4. Replace the NICC<br />
in the host if necessary. No configuration of the re eplaced NIC is<br />
necessary.<br />
5. Move the cluster<br />
resources back to the original node after the reso olution of the<br />
failure.<br />
7–5
Solving Network Problems<br />
<strong>Public</strong> or Client WAN Failure in a Geographic<br />
Clustered Environment<br />
Problem Description<br />
When the public or client WAN fails, some clients cannot access virtual IP networks that<br />
are associated with the cluster. The WAN components that comprise this failure might<br />
be two switches that are possibly on different subnets using gateways. This failure<br />
results from connectivity issues. The MSCS cluster would detect and fail the associated<br />
node if the failure resulted from an adapter failure or media failure to the adapter.<br />
Instead, cluster groups do not fail and the public LAN shows an “unreachable for this<br />
failure” mode.<br />
<strong>Public</strong> communication between the two sites failed, only allowing local cluster public<br />
communication between cluster nodes and local clients. The cluster node state does not<br />
change on either site because all cluster nodes are able to communicate with the private<br />
cluster network.<br />
All resources remain online and no cluster group errors are reported in the Cluster<br />
Administrator. Clients on the remote site cannot access resources associated with the IP<br />
resource located on the local site until the public or client network is again operational.<br />
Depending on the cause of the failure and the network configuration, the <strong>SafeGuard</strong> 30m<br />
Control might fail to move a cluster group because the management network might be<br />
the same physical network as the public network. Whether this failure to move the<br />
group occurs or not depends on how the RAs are physically wired to the network.<br />
7–6 6872 5688–002
Symptoms<br />
6872 5688–002<br />
Figure 7–3 illustratees<br />
this scenario.<br />
Figure 7–3. <strong>Public</strong> or Client WAN Failure<br />
The following symmptoms<br />
might help you identify this failure:<br />
Solving Net twork Problems<br />
• Clients on site 2 are not able to access resources associated with the t IP resource<br />
located on site 1.<br />
• <strong>Public</strong> communnication<br />
between the two sites displays as “unreach hable” allowing<br />
local cluster public<br />
communication between cluster nodes and loca al clients.<br />
• When the publiic<br />
cluster network fails, the Cluster Administrator dis splays an error<br />
indicator similar<br />
to Figure 7–4.<br />
All private netwwork<br />
connections show as “unreachable” when the problem is a WAN<br />
issue.<br />
If only two of thhe<br />
connections show as failed (and the nodes are ph hysically located at<br />
the same site), the issue is probably local to the site.<br />
If only one connnection<br />
failed, the issue is probably a host network adapter.<br />
a<br />
7–7
Solving Network Problems<br />
7–8<br />
Figure 7–4. Cluster Administrator<br />
Showing <strong>Public</strong> LAN Network Error E<br />
• If you review the sysstem<br />
event log, messages similar to the following ex xamples are<br />
displayed:<br />
Event Type : Warning<br />
Event Source : ClusSvc<br />
Event Category: Node Mggr<br />
Event ID: 1123<br />
Date : 05/30/2008<br />
Time: 9:49:34 AM<br />
User : N/A<br />
Computer: USMV-WEST22<br />
Description:<br />
The node lost communicaation<br />
with cluster node 'USMV-EAST2' on network '<strong>Public</strong> LAN'.<br />
Event Type: Warning<br />
Event Source: ClusSvc<br />
Event Category: Node Mggr<br />
Event ID: 1126<br />
Date : 05/30/2008<br />
Time: 9:49:36 AM<br />
User : N/A<br />
Computer: USMV-WEST22<br />
Description:<br />
The interface for cluster nnode<br />
'USMV-WEST2' on network '<strong>Public</strong> LAN' is unreachable by at a least one<br />
other cluster node attacheed<br />
to the network. the server cluster was not able to determine the t location of<br />
the failure. Look for additional<br />
entries in the system event log indicating which other nodes s have lost<br />
communication with nodee<br />
USMV-WEST2. If the condition persists, check the cable connec cting the node<br />
to the network. Next, cheeck<br />
for hardware or software errors in the node's network adapter.<br />
Finally, check<br />
for failures in any other neetwork<br />
components to which the node is connected such as hubs,<br />
switches, or<br />
bridges.<br />
68 872 5688–002
Solving Network Problems<br />
Event Type: Warning<br />
Event Source: ClusSvc<br />
Event Category: Node Mgr<br />
Event ID: 1130<br />
Date : 05/30/2008<br />
Time: 9:49:36 AM<br />
User : N/A<br />
Computer: USMV-WEST2<br />
Description:<br />
Cluster network '<strong>Public</strong> network is down. None of the available nodes can communicate using this<br />
network. If the condition persists, check for failures in any network components to which the nodes are<br />
connected such as hubs, switches, or bridges. Next, check the cables connecting the nodes to the<br />
network. Finally, check for hardware or software errors in the adapters that attach the nodes to the<br />
network.<br />
• A cluster group containing a <strong>SafeGuard</strong> 30m Control resource might fail to move to<br />
another node when the management network has network components common to<br />
the public network. (Refer to “Management Network Failure in a Geographic<br />
Clustered Environment.”)<br />
• Symptoms might include those in “Management Network Failure in a Geographic<br />
Clustered Environment” when these networks are physically the same network.<br />
Refer to this topic if the clients at one site are not able to access the IP resources at<br />
another site.<br />
• The management console logs might display the messages in the following table<br />
when this connection fails and is then restored.<br />
Event<br />
ID<br />
Description<br />
3023 For each RA at the site, this console log<br />
message is displayed:<br />
Error in LAN link to RA. (RA )<br />
3022<br />
When the LAN link is restored, a<br />
management console log displays:<br />
LAN link to RA restored. (RA)<br />
E-mail<br />
Immediate<br />
E-mail<br />
Daily<br />
Summary<br />
6872 5688–002 7–9<br />
X<br />
X
Solving Network Problems<br />
Actions to Resolve the Problem<br />
Note: Typically, a network administrator for the site is required to diagnose which<br />
network switch, gateway, or connection is the cause of this failure.<br />
Perform the following actions to isolate and resolve the problem:<br />
1. In the Cluster Administrator, view the network properties of the public and private<br />
network.<br />
The private network should be operational with no failure indications.<br />
The public network should display errors. Refer to the previous symptoms to identify<br />
that this is a WAN issue. If the error is limited to one host, the problem might be a<br />
host network adapter. See “Cluster Node <strong>Public</strong> NIC Failure in a Geographic<br />
Clustered Environment.”<br />
2. Check for network problems using a method such as isolating the failure to the<br />
network switch or gateway by pinging from the cluster node to the gateway at each<br />
site.<br />
3. Use the Installation Manager site connectivity IP diagnostic from the RAs to the<br />
gateway at each site by performing the following steps. (For more information, see<br />
Appendix C.)<br />
a. Log on to an RA with user ID as boxmgmt and password as boxmgmt.<br />
b. On the Main Menu, type 3 (Diagnostics) and press Enter.<br />
c. On the Diagnostics menu, type 1 (IP diagnostics) and press Enter.<br />
d. On the IP Diagnostics menu, type 1 (Site connectivity tests) and press Enter.<br />
e. When asked to select a target for the tests, type 5 (Other host) and press<br />
Enter.<br />
f. Enter the IP address for the gateway that you want to test.<br />
g. Repeat steps a through f for each RA.<br />
4. Isolate the site by determining which gateway or network switch failed. Use<br />
standard network methods such as pinging to make the determination.<br />
7–10 6872 5688–002
Management Neetwork<br />
Failure in a Geograp phic<br />
Clustered Enviroonment<br />
Problem Description<br />
Symptoms<br />
6872 5688–002<br />
When the managemment<br />
network fails in a geographic clustered environ nment, you cannot<br />
access the manageement<br />
console for the affected site. The replication environment e<br />
is not<br />
affected. If you try tto<br />
move a cluster group to the site with the failed management<br />
m<br />
network, the move fails.<br />
Figure 7–5 illustratees<br />
this scenario.<br />
Figure 7–5. Management Network Failure<br />
The following sympptoms<br />
might help you identify this failure:<br />
Solving Net twork Problems<br />
• The indicators ffor<br />
the onboard management network adapter of the e RA are not<br />
illuminated.<br />
• Network switchh<br />
port lights show that no link exists with the host adapter.<br />
7–11
Solving Network Problems<br />
• You cannot access the management console or initiate a SSH session through<br />
PuTTY using the management IP address of the failed site from remote site. You can<br />
access the management console from a client local to the site. If you cannot access<br />
the management IP address from either site, see Section 8, “Solving Replication<br />
Appliance (RA) Problems.”<br />
• A cluster move operation to the site with the failed management network might fail.<br />
The event ID 2002 message is displayed in the host application event log.<br />
Application Event Log Message on Host Server<br />
Type : warning<br />
Source : 30mControl<br />
Event Category: None<br />
EventID : 2002<br />
Date : 05/30/2008<br />
Time : 2:46:29 PM<br />
User : N/A<br />
Computer : USMV-SYDNEY<br />
Description : Online resource failed. RA CLI command failed because of a network communication<br />
error or invalid IP address.<br />
Action : Verify the network connection between the system and the site management IP Address<br />
specified for the resource. Ping each site management IP Address mentioned for the specified resource.<br />
Note: The preceding information can also be viewed in the cluster log.<br />
• If the management console was open with the IP address of the failed site, the<br />
message “Connection with RA was lost, please check RA and network settings” is<br />
displayed. The management console display shows “not connected,” and the<br />
components have a question mark “Unknown” status as illustrated in Figure 7–6.<br />
7–12 6872 5688–002
Solving Network Problems<br />
Figure 7–6. Management Console Display: “Not Connected”<br />
• The management console log displays a message for event 3023 as shown in<br />
Figure 7–7.<br />
Figure 7–7. Management Console Message for Event 3023<br />
6872 5688–002 7–13
Solving Network Problems<br />
• The management console log messages might appear as in the following table.<br />
Event<br />
ID<br />
Description<br />
3023 For each RA at the site, this console log<br />
message is displayed:<br />
Error in LAN link to RA. (RA )<br />
3022<br />
When the LAN link is restored, a<br />
management console log displays:<br />
LAN link to RA restored. (RA )<br />
Actions to Resolve the Problem<br />
E-mail<br />
Immediate<br />
E-mail<br />
Daily<br />
Summary<br />
Note: Typically, a network administrator for the site is required to diagnose which<br />
network switch, gateway, or connection is the cause of this failure.<br />
Perform the following actions to isolate and resolve the problem:<br />
1. Ping from the cluster node to the RA box management IP address at the same site.<br />
Repeat this action for the other site. If the local connections are working at both<br />
sites, the problem is with the WAN connection such as a network switch or gateway<br />
connection.<br />
2. If one site from step 1 fails, ping from the cluster node to the gateway of that site. If<br />
the ping completes, then proceed to step 3.<br />
3. Use the Installation Manager site connectivity IP diagnostic from the RAs to the<br />
gateway at each site by performing the following steps. (For more information, see<br />
Appendix C.)<br />
a. Log in to an RA as user boxmgmt with the password boxmgmt.<br />
b. On the Main Menu, type 3 (Diagnostics) and press Enter.<br />
c. On the Diagnostics menu, type 1 (IP diagnostics) and press Enter.<br />
d. On the IP Diagnostics menu, type 1 (Site connectivity tests) and press Enter.<br />
e. When asked to select a target for the tests, type 5 (Other host) and press<br />
Enter.<br />
f. Enter the IP address for the gateway that you want to test.<br />
g. Repeat steps a through f for each RA.<br />
4. Isolate the site by determining which gateway failed. Use standard network methods<br />
such as pinging to make the determination.<br />
7–14 6872 5688–002<br />
X<br />
X
Replication Netwwork<br />
Failure in a Geograph hic<br />
Clustered Enviroonment<br />
Problem Description<br />
6872 5688–002<br />
This type of event ooccurs<br />
when the RA cannot replicate data to the rem mote site because<br />
of a replication netwwork<br />
(WAN) failure. Because this error is transparen nt to MSCS and<br />
the cluster nodes, ccluster<br />
resources and nodes are not affected. Each cluster c node<br />
continues to run, annd<br />
data transactions sent to their local cluster disk are<br />
completed.<br />
Figure 7–8 illustratees<br />
this failure.<br />
Figure 7–8. Replication Network Failure<br />
Solving Net twork Problems<br />
The RA cannot replicate<br />
data while the WAN is down. During this failur re, the RA keeps a<br />
record of data writtten<br />
to local storage. Once the WAN is restored, the RA updates the<br />
replication volumess<br />
on the remote site.<br />
During the replicatioon<br />
network failure, the RAs prevent the quorum and d data resources<br />
from failing over to the remote site. This behavior differs from a total co ommunication<br />
failure or a total sitee<br />
failure in which the data groups are allowed to fail over. The quorum<br />
group is never allowwed<br />
to fail over automatically when the RAs cannot communicate c<br />
over<br />
the WAN.<br />
7–15
Solving Network Problems<br />
Symptoms<br />
Notes:<br />
• If the management network has also failed, see “Total Communication Failure in a<br />
Geographic Clustered Environment” later in this section.<br />
• If all RAs at a site have failed, see “Failure of All RAs at One Site” in Section 8.<br />
If the administrator issues a move-group operation from the Cluster Administrator for a<br />
data or quorum group, the cluster accepts failover only to another node within the same<br />
site. Group failover to the remote site is not allowed, and the resource group fails back<br />
to a node on the source site.<br />
Although automatic failover is not allowed, the administrator can perform a manual<br />
failover to the remote site. Performing a manual failover results in a loss of data. The<br />
administrator chooses an available image for the failover.<br />
Important considerations for this type of failure are as follow:<br />
• This type of failure does not have an immediate effect on the cluster service or the<br />
cluster nodes. The quorum group cannot fail over to the remote site and goes back<br />
online at the source site.<br />
• Only local failovers are permitted. Remote failovers require that the administrator<br />
perform the manual failover process.<br />
• The <strong>SafeGuard</strong> 30m Control resource and the data consistency groups cannot fail<br />
over to the remote site while the WAN is down; they go back online at the source<br />
site.<br />
• Only one site has up-to-date data. Replication does not occur until the WAN is<br />
restored.<br />
• If the administrator manually chooses to use remote data instead of the source data,<br />
data loss occurs.<br />
• Once the WAN is restored, normal operation continues; however, the groups might<br />
initiate a long resynchronization.<br />
The following symptoms might help you identify this failure:<br />
• The management console display shows errors similar to the image in Figure 7–9.<br />
This image shows the dialog box displayed after clicking the red Errors in the right<br />
column. The More Info message box is displayed with messages similar to those in<br />
the figure but appropriate for your site. If only one RA is down, see Section 8 for<br />
resolution actions. Notice in the figure that all RA data links at the site are down.<br />
7–16 6872 5688–002
Figure 7–9. Management Console Display: WAN Down<br />
Solving Network Problems<br />
This figure also shows the Groups tab and the messages that the data consistency<br />
groups and the quorum group are “Paused by system.” If the groups are not paused<br />
by the system, a switchover might have occurred. See Section 8 for more<br />
information. If all groups are not paused, see Section 5, “Solving Storage Problems.”<br />
• Warnings and informational messages similar to those shown in Figure 7–10 appear<br />
on the management console when the WAN is down. See the table after the figure<br />
for an explanation of the numbered console messages.<br />
Figure 7–10. Management Console Log Messages: WAN Down<br />
The following table explains the numbers in Figure 7–10. You might also see the<br />
events in the table denoted by an asterisk (*) in the management console log.<br />
6872 5688–002 7–17
Solving Network Problems<br />
Reference<br />
No./Legend<br />
Event<br />
ID<br />
Description<br />
* 3001 The RA is currently experiencing a problem<br />
communicating with its cluster. The details<br />
explain that an event 3000 means that the RA<br />
functionality will be restored.<br />
* 3000 The RA is successfully communicating with its<br />
cluster. In this case, the RA communicates by<br />
means of the management link.<br />
1 4001 For each consistency group on the Auckland<br />
and the Sydney sites, the transfer is paused.<br />
2 4008 For each quorum group on the Auckland and<br />
the Sydney sites, the transfer is paused.<br />
* 4043 For each group on the Auckland and Sydney<br />
sites, the “group site is deactivated” message<br />
might appear with the detail showing the<br />
reason for the switchover. The RA attempts to<br />
switch over to resolve the problem.<br />
3 4001 The event is repeated after the switchover<br />
attempt.<br />
E-mail<br />
Immediate<br />
E-mail<br />
Daily<br />
Summary<br />
• If you review the management console RAs tab, the data link column lists errors for<br />
all RAs, as shown in Figure 7–11. The data link is the replication link between peer<br />
RAs. Notice that the WAN link shows OK because the RAs can still communicate<br />
over the management link. There is no column for the management link.<br />
Figure 7–11. Management Console RAs Tab: All RAs Data Link Down<br />
• If you review the host application event log, no messages appear for this failure<br />
unless a data resource move-group operation is attempted. If this move-group<br />
operation is attempted, then messages similar to the following are listed:<br />
Application event log<br />
Event Type : Warning<br />
Event Source : 30mControl<br />
Event Category: None<br />
Event ID : 1119<br />
Date : 5/30/2008<br />
Time : 3:27:49 PM<br />
User : N/A<br />
Computer : USMV-SYDNEY<br />
7–18 6872 5688–002<br />
X<br />
X<br />
X<br />
X<br />
X<br />
X
Description : Online resource failed.<br />
Cannot complete transfer for auto failover (7).<br />
The following could cause this error:<br />
1. Wan is down.<br />
2. Long resynchronization might be in progress.<br />
The resource might have to be brought online manually.<br />
Solving Network Problems<br />
RA Version: 3.0(g.60)<br />
Resource name: Data1<br />
RA CLI command: UCLI -ssh -l plugin -pw **** -superbatch 172.16.25.50 initiate_failover group=Data1<br />
active_site=Sydney cluster_owner=USMV-SYDNEY<br />
• If you review the system event log, a message similar to the following example is<br />
displayed:<br />
System Event Log<br />
Event Type : Error<br />
Event Source : ClusSvc<br />
Event Category: Failover Mgr<br />
Event ID : 1069<br />
Date : 5/30/2008<br />
Time : 3:27:50 PM<br />
User : N/A<br />
Computer : USMV-SYDNEY<br />
Description : Cluster resource 'Data1' in Resource Group 'Group 0' failed.<br />
Note: Data1 would change to the Quorum drive if the quorum was moved.<br />
• If you review the cluster log, you can see an error if a data or a quorum move-group<br />
operation is attempted. Messages similar to the following are listed:<br />
Cluster Log for the Node to which the Move Was Attempted<br />
Key messages<br />
00000d4c.00000910::2008/05/30-15:27:22.077 INFO Physical Disk : [DiskArb]-------<br />
DisksArbitrate -------.<br />
………………..<br />
00000d4c.00000910::2008/05/30-15:27:35.608 ERR Physical Disk : [DiskArb] Failed to write<br />
(sector 12), error 170.<br />
00000d4c.00000910::2008/05/30-15:27:35.608 INFO Physical Disk : [DiskArb] Arbitrate returned<br />
status 170.<br />
Cluster Log for the Node to which the Data Group Move Was Attempted<br />
00000e60.00000940::2008/05/30-15:53:38.470 INFO Unisys <strong>SafeGuard</strong> 30m Control :<br />
KfResourceTerminate: Resource 'Data1' terminated. AbortOnline=1 CancelConnect=0<br />
terminateProcess=0.<br />
0000099c.00000dd4::2008/05/30-15:53:38.470 INFO [CP] CppResourceNotify for resource Data1<br />
0000099c.00000dd4::2008/05/30-15:53:38.470 INFO [FM] RmTerminateResource: a16fc059-e4d3-4bc8a15a-6440e9b2f976<br />
is now offline<br />
0000099c.00000dd4::2008/05/30-15:53:38.470 WARN [FM] Group failure for group . Create thread to take offline and move<br />
6872 5688–002 7–19
Solving Network Problems<br />
Actions to Resolve the Problem<br />
Note: Typically, a network administrator for the site is required to diagnose which<br />
network switch, gateway, or connection is the cause of this failure.<br />
Perform the following actions to isolate and resolve the problem:<br />
1. On the management console, observe that a WAN error occurred for all RAs and that<br />
the data link is in error for all RAs. If that is not the case, see Section 8 for resolution<br />
actions.<br />
2. Use the Installation Manager site connectivity IP diagnostic from the RAs to the<br />
gateway at each site by performing the following steps. (For more information, see<br />
Appendix C.)<br />
a. Log in to an RA as user boxmgmt with the password boxmgmt.<br />
b. On the Main Menu, type 3 (Diagnostics) and press Enter.<br />
c. On the Diagnostics menu, type 1 (IP diagnostics) and press Enter.<br />
d. On the IP Diagnostics menu, type 1 (Site connectivity tests) and press Enter.<br />
e. When asked to select a target for the tests, type 5 (Other host) and press<br />
Enter.<br />
f. Enter the IP address for the gateway that you want to test.<br />
g. Repeat steps a through f for each RA.<br />
3. Isolate the site by determining which network switch or gateway failed. Use<br />
standard network methods such as pinging to make the determination.<br />
4. In some cases, the WAN connection might appear to be down because a firewall is<br />
blocking ports. See “Port Information” later in this section.<br />
5. If all RAs at both sites can connect to the gateway, the problem is related to the link.<br />
In this case, check the connectivity between subnets by pinging between machines<br />
on the same subnet (not RAs) and between a non-RA machine at one site and an RA<br />
at the other site.<br />
6. Verify that no routing problems exist between the sites.<br />
7. Optionally, follow the recovery actions to manually move cluster and data resource<br />
groups to the other site if necessary. This action results in a loss of data. Do not<br />
attempt this manual recovery unless the WAN failure has affected applications.<br />
If you choose to manually move groups, refer to Section 4 for the procedures.<br />
Once you observe on the management console that the WAN error is gone, verify<br />
that the consistency groups are resynchronizing.<br />
If a move-group operation is issued to the other site while the group is<br />
resynchronizing, the command fails with a return code 7 (long resync in progress)<br />
and move back to the original node.<br />
7–20 6872 5688–002
Temporary WAN Failures<br />
Problem Description<br />
Symptoms<br />
All applications are unaffected. The target image is not up-to-date.<br />
Solving Network Problems<br />
On the management console, messages showing the transfer between sites switch<br />
between the “paused by system” and “initializing/active.” All groups appear<br />
unstable over the WAN connection.<br />
Actions to Resolve the Problem<br />
Perform the following actions to isolate and resolve this problem:<br />
1. If the connection problem is temporary but reoccurs, check for a problematic<br />
network such as a high percentage of packet loss because of bad network<br />
connections, insufficient bandwidth that is causing an overloaded network, and so<br />
on.<br />
2. Verify that the bandwidth allocated to this link is reasonable and that no<br />
unreasonable external or internal (consistency group bandwidth policy) limits are<br />
causing an overloaded network.<br />
6872 5688–002 7–21
Solving Network Problems<br />
Private Cluster Nettwork<br />
Failure in a Geograph hic<br />
Clustered Environmment<br />
Problem Description<br />
7–22<br />
When the private clusterr<br />
network fails, the cluster nodes are able to commu unicate with<br />
the public cluster networrk<br />
if the cluster public address is set for all communication.<br />
No<br />
cluster resources fail oveer,<br />
and current processing on the cluster nodes cont tinues.<br />
Clients do not experiencee<br />
any impact by this failure.<br />
Figure 7–12 illustrates thhis<br />
scenario.<br />
Figuree<br />
7–12. Private Cluster Network Failure<br />
Unisys recommends thatt<br />
the public cluster network be set for “All communications”<br />
and<br />
the private cluster LAN bbe<br />
set for “internal cluster communications only…” You Y can<br />
verify these settings in thhe<br />
“Networks” properties section within Cluster Administrator.<br />
See “Checking the Clustter<br />
Setup” in Section 4.<br />
If the public cluster netwwork<br />
was not set for “All communications” but instead<br />
was set<br />
for “Client access only,” the following symptoms occur:<br />
• All nodes except the node that owned the quorum stop MSCS. This action<br />
is<br />
completed to prevennt<br />
a “split brain” situation.<br />
• All resources move tto<br />
the surviving node.<br />
68 872 5688–002
Symptoms<br />
The following symptoms might help you identify this failure:<br />
Solving Network Problems<br />
• When the private cluster network fails, the Cluster Administrator displays an error<br />
indicator similar to Figure 7–13.<br />
All private network connections show a status of “Unknown” when the problem is a<br />
WAN issue.<br />
If only two of the connections failed (and the nodes are physically located at the<br />
same site), the issue is probably local to the site.<br />
If only one connection failed, the issue is probably a host network adapter.<br />
Figure 7–13. Cluster Administrator Display with Failures<br />
• On the cluster nodes at both sides, the system event log contains entries from the<br />
cluster service similar to the following:<br />
Event Type : Warning<br />
Event Source : ClusSvc<br />
Event Category: Node Mgr<br />
Event ID : 1123<br />
Date : 5/30/2008<br />
Time : 4:03:10 PM<br />
User : N/A<br />
6872 5688–002 7–23
Solving Network Problems<br />
Computer<br />
Description:<br />
: USMV-SYDNEY<br />
The node lost communication with cluster node 'USMV-AUCKLAND' on network 'Private'.<br />
Event Type : Warning<br />
Event Source : ClusSvc<br />
Event Category: Node Mgr<br />
Event ID : 1126<br />
Date : 5/30/2008<br />
Time : 4:03:12 AMP<br />
User : N/A<br />
Computer<br />
Description:<br />
: USMV-SYDNEY<br />
The interface for cluster node 'USMV-AUCKLAND' on network 'Private' is unreachable by at least one<br />
other cluster node attached to the network. The server cluster was not able to determine the location of<br />
the failure. Look for additional entries in the system event log indicating which other nodes have lost<br />
communication with node USMV-AUCKLAND. If the condition persists, check the cable connecting the<br />
node to the network. Then, check for hardware or software errors in the node's network adapter. Finally,<br />
check for failures in any other network components to which the node is connected such as hubs,<br />
switches, or bridges.<br />
Event Type : Warning<br />
Event Source : ClusSvc<br />
Event Category: Node Mgr<br />
Event ID : 1130<br />
Date : 5/30/2008<br />
Time : 4:03:12 PM<br />
User : N/A<br />
Computer<br />
Description:<br />
: USMV-SYDNEY<br />
Cluster network 'Private’ is down. None of the available nodes can communicate using this network. If<br />
the condition persists, check for failures in any network components to which the nodes are connected<br />
such as hubs, switches, or bridges. Next, check the cables connecting the nodes to the network. Finally,<br />
check for hardware or software errors in the adapters that attach the nodes to the network.<br />
7–24 6872 5688–002
Actions to Resolve the Problem<br />
Solving Network Problems<br />
Note: Typically, a network administrator for the site is required to diagnose which<br />
network switch, gateway, or connection is the cause of this failure.<br />
Perform the following actions to isolate and resolve the problem:<br />
1. In the Cluster Administrator, view the network properties of the public and private<br />
network.<br />
The public network should be operational with no failure indications.<br />
The private network should display errors. Refer to the previous symptoms to<br />
identify that this is a WAN issue. If the error is limited to one host, the problem<br />
might be a host network adapter. See “<strong>Public</strong> NIC Failure on a Cluster Node in a<br />
Geographic Clustered Environment” for action to resolve a host network problem.<br />
2. Check for network problems using methods such as isolating the failure to the<br />
network switch or gateway with the problem.<br />
6872 5688–002 7–25
Solving Network Problems<br />
Total Communicattion<br />
Failure in a Geographic c<br />
Clustered Environmment<br />
Problem Description<br />
7–26<br />
A total communication faailure<br />
implies that the cluster nodes and RAs are no longer able<br />
to communicate with eacch<br />
other over the public and private network interfac ces.<br />
Figure 7–14 illustrates this<br />
failure.<br />
Figurre<br />
7–14. Total Communication Failure<br />
When this failure occurs, , the cluster nodes on both sites detect that the clus ster<br />
heartbeat has been brokeen.<br />
After six missed heartbeats, the cluster nodes go<br />
into a<br />
“regroup” process to determine<br />
which node takes ownership of all cluster re esources.<br />
This process consists of checking network interface states and then arbitrati ing for the<br />
quorum device.<br />
During the network interrface<br />
detection phase, all nodes perform a network interface<br />
check to determine that the node is communicating through at least one net twork<br />
interface dedicated for cllient<br />
access, assuming the network interface is set for f “All<br />
communications” or “Cliient<br />
access only.” If this process determines that the<br />
node is not<br />
communicating through aany<br />
viable network, the cluster node voluntarily stop ps cluster<br />
service and drops out of the quorum arbitration process. The remaining node es then<br />
attempt to arbitrate for thhe<br />
quorum device.<br />
68 872 5688–002
Symptoms<br />
Solving Network Problems<br />
Quorum arbitration succeeds on the site that originally owned the quorum consistency<br />
group and fails on the nodes that did not own the quorum consistency group. Cluster<br />
service then shuts itself down on the nodes where quorum arbitration fails.<br />
In Microsoft Windows 2000 environments, MSCS does not check for network interface<br />
availability during the regroup process and starts the quorum arbitration process<br />
immediately after a regroup process is initiated—that is, after six missed heartbeats.<br />
Once the cluster has determined which nodes are allowed to remain active in the<br />
cluster, the cluster node attempts to bring online all data groups previously owned by the<br />
other cluster nodes. The <strong>SafeGuard</strong> 30m Control resource and its associated dependent<br />
resources will come online.<br />
During this total communication failure, replication is “Paused by system.” An extended<br />
outage requires a full volume sweep. Refer to Section 4 for more information.<br />
The following symptoms might help you identify this failure:<br />
• The management console shows a WAN error; all groups are paused. The other site<br />
shows a status of “Unknown.” Figure 7–15 illustrates one site.<br />
Figure 7–15. Management Console Display Showing WAN Error<br />
6872 5688–002 7–27
Solving Network Problems<br />
• The RAs tab on the management console lists errors as shown in Figure 7–16.<br />
Figure 7–16. RAs Tab for Total Communication Failure<br />
• Warnings and informational messages similar to those shown in Figure 7–17 appear<br />
on the management console. See the table after the figure for an explanation of the<br />
numbered console messages.<br />
Figure 7–17. Management Console Messages for Total Communication Failure<br />
7–28 6872 5688–002
Reference<br />
No.<br />
The following table explains the numbered messages in Figure 7–17.<br />
Event ID<br />
Description<br />
1 4001 For each consistency group, a group<br />
capabilities minor problem is reported. The<br />
details indicate that a WAN problem is<br />
suspected on both RAs.<br />
2 4008 For each consistency group on the West and<br />
the East sites, the transfer is paused. The<br />
details indicate a WAN problem is<br />
suspected.<br />
3 3021 For each RA at each site, the following error<br />
message is reported:<br />
Error in WAN link to RA at other site<br />
(RA x)<br />
4 1008 The following message is displayed:<br />
User action succeeded. The details indicate<br />
that a failover was initiated. This message<br />
appears when the groups are moved by the<br />
<strong>SafeGuard</strong> Control resource to the surviving<br />
cluster node.<br />
Solving Network Problems<br />
E-mail<br />
Immediate<br />
E-mail<br />
Daily<br />
Summary<br />
• All cluster resources appear online after successfully failing over to the surviving<br />
node.<br />
• The cluster service stops on all nodes except the surviving node.<br />
• From the surviving node, the host system event log has entries similar to the<br />
following:<br />
Event Type : Warning<br />
Event Source : ClusSvc<br />
Event Category: Node Mgr<br />
Event ID : 1123<br />
Date : 6/1/2008<br />
Time : 12:58:55 PM<br />
User : N/A<br />
Computer : USMV-WEST2<br />
Description:<br />
The node lost communication with cluster node 'USMV-EAST2' on <strong>Public</strong> network.<br />
Event Type : Warning<br />
Event Source : ClusSvc<br />
Event Category: Node Mgr<br />
Event ID : 1123<br />
Date : 6/1/2008<br />
6872 5688–002 7–29<br />
X<br />
X<br />
X<br />
X
Solving Network Problems<br />
Time : 12:58:55 PM<br />
User : N/A<br />
Computer : USMV-WEST2<br />
Description:<br />
The node lost communication with cluster node 'USMV-EAST2' on Private network.<br />
Event Type : Warning<br />
Event Source : ClusSvc<br />
Event Category: Node Mgr<br />
Event ID : 1135<br />
Date : 6/1/2008<br />
Time : 12:58:16 PM<br />
User : N/A<br />
Computer : USMV-WEST2<br />
Description:<br />
Cluster node USMV-EAST2 was removed from the active server cluster membership. Cluster service may<br />
have been stopped on the node, the node may have failed, or the node may have lost communication<br />
with the other active server cluster nodes.<br />
Event Type : Information<br />
Event Source : ClusSvc<br />
Event Category: Failover Mgr<br />
Event ID : 1200<br />
Date : 6/1/2008<br />
Time : 12:58:21 PM<br />
User : N/A<br />
Computer :<br />
Description:<br />
USMV-WEST2<br />
The Cluster Service is attempting to bring online the Resource Group "Group 1".<br />
Event Type : Information<br />
Event Source : ClusSvc<br />
Event Category: Failover Mgr<br />
Event ID : 1201<br />
Date : 6/1/2008<br />
Time : 1:02:54 PM<br />
User : N/A<br />
Computer :<br />
Description:<br />
USMV-WEST2<br />
The Cluster Service brought the Resource Group "Group 1" online.<br />
7–30 6872 5688–002
Solving Network Problems<br />
• From the surviving node, the private and public network connections show an<br />
exclamation mark “Unknown” status as shown in Figures 7–18 and 7–19.<br />
Figure 7–18. Cluster Administrator Showing Private Network Down<br />
Figure 7–19. Cluster Administrator Showing <strong>Public</strong> Network Down<br />
6872 5688–002 7–31
Solving Network Problems<br />
Actions to Resolve the Problem<br />
Note: Typically, a network administrator for the site is required to diagnose which<br />
network switch, gateway, or connection is the cause of this failure.<br />
Perform the following actions to isolate and resolve the problem:<br />
1. When you observe on the management console that a WAN error occurred on site 1<br />
and on site 2, call the other site to verify that each management console is available<br />
and shows a WAN down because of the failure. If only one site can access the<br />
management console, the problem is probably not a total WAN failure but rather a<br />
management network failure. In that case, see “Management Network Failure in a<br />
Geographic Clustered Environment.”<br />
2. In the Cluster Administrator, verify that only one node is active in the cluster.<br />
3. View the network properties of the public and private network.<br />
The display should show an “Unknown” status for the private and public network.<br />
4. Check for network problems using methods such as isolating the failure to the<br />
network switch or gateway by pinging from the cluster node to the gateway at each<br />
site.<br />
Port Information<br />
Problem Description<br />
Symptoms<br />
Communications problems might occur because of firewall settings that prevent all<br />
necessary communication.<br />
The following symptoms might help you identify this problem:<br />
• Unable to reach the DNS server.<br />
• Unable to communicate to the NTP server.<br />
• Unable to reach the mail server.<br />
• The RAs tab shows RA data link errors.<br />
• The management console shows errors for the WAN.<br />
• The management console logs show RA communications errors.<br />
7–32 6872 5688–002
Actions to Resolve<br />
Solving Network Problems<br />
Perform the port diagnostics from each of the RAs by following the steps given in<br />
Appendix C.<br />
The following tables provide port information that you can use in troubleshooting the<br />
status of connections.<br />
Port Numbers<br />
Table 7–2. Ports for Internet Communication<br />
Protocol or Protocols<br />
21 FTP 192.61.61.78<br />
443 Used for remote maintenance<br />
(TCP)<br />
Unisys Product <strong>Support</strong><br />
IP Address<br />
129.225.216.130<br />
The following tables list ports used for communication other than Internet<br />
communication.<br />
Table 7–3. Ports for Management LAN<br />
Communication and Notification<br />
Port Numbers Protocol or Protocols<br />
21 Default FTP port (needed for collecting system<br />
information)<br />
22 Default SSH and communications between RAs<br />
25 Default outgoing mail (SMTP) e-mail alerts from<br />
the RA are configured.<br />
80 Web server for management (TCP)<br />
123 Default NTP port<br />
161 Default SNMP port<br />
443 Secure Web server for management (TCP)<br />
514 Syslog (UDP)<br />
1097 RMI (TCP)<br />
1099 RMI (TCP)<br />
4401 RMI (TCP)<br />
4405 Host-to-RA kutils communications (SQL<br />
commands) and KVSS (TCP)<br />
7777 Automatic host information collection<br />
6872 5688–002 7–33
Solving Network Problems<br />
The ports listed in Table 7–4 are used for both the management LAN and WAN.<br />
Table 7–4. Ports for RA-to-RA Internal<br />
Communication<br />
Port Numbers Protocol or Protocols<br />
23 telnet<br />
123 NTP (UDP)<br />
1097 RMI (TCP)<br />
1099 RMI (TCP)<br />
4444 TCP<br />
5001 TCP (default iperf port for performance<br />
measuring between RAs)<br />
5010 Management server (UDP, TCP)<br />
5020 Control (UDP, TCP)<br />
5030 RMI (TCP)<br />
5040 Replication (UDP, TCP)<br />
5060 Mpi_perf (TCP)<br />
5080 Connectivity diagnostics tool<br />
7–34 6872 5688–002
Section 8<br />
Solving Replication Appliance (RA)<br />
Problems<br />
This section lists symptoms that usually indicate problems with one or more Unisys<br />
<strong>SafeGuard</strong> 30m replication appliances (RAs). The problems include hardware failures.<br />
The graphics, behaviors, and examples in this section are similar to what you observe<br />
with your system but might differ in some details.<br />
For problems relating to RAs, gather the RA logs and ask the following questions:<br />
• Are any errors displayed on the management console?<br />
• Is the issue constant? Is the issue a one-time occurrence? Does the issue occur at<br />
intervals?<br />
• What are the states of the consistency groups?<br />
• What is the timeframe in which the problem occurred?<br />
• When was the first occurrence of the problem?<br />
• What actions were taken as a result of the problem or issue?<br />
• Were any recent changes made in the replication environment? If so, what?<br />
Table 8–1 lists symptoms and possible causes for the failure of a single RA on one site<br />
with a switchover as a symptom. Table 8–2 lists symptoms and possible causes for the<br />
failure of a single RA on one site without switchover symptoms. Table 8–3 lists<br />
symptoms and other possible problems regarding multiple RA failures. Each problem and<br />
the actions to resolve it are described in this section.<br />
In addition to the symptoms listed, you might receive e-mail messages or SNMP traps<br />
for possible problems. Also, messages similar to e-mail notifications might be displayed<br />
on the management console. If you do not see the messages, they might have already<br />
dropped off the display. Review the management console logs for messages that have<br />
dropped off the display.<br />
6872 5688–002 8–1
Solving Replication Appliance (RA) Problems<br />
Table 8–1. Possible Problems for Single RA Failure with a<br />
Switchover<br />
Symptoms Possible Problem<br />
The management console shows RA<br />
failure.<br />
Single RA failure<br />
Possible Contributing Causes to Single RA Failure with a Switchover<br />
The system frequently pauses transfer<br />
for all consistency groups.<br />
If you log in to the failed RA as the<br />
boxmgmt user, a message is displayed<br />
explaining that the reboot regulation<br />
limit has been exceeded.<br />
The management console shows<br />
repeated events that report an RA is<br />
up followed by an RA is down.<br />
The link indicator lights on all host bus<br />
adapters (HBAs) are not illuminated.<br />
The port indicator lights on the Fibre<br />
Channel switch no longer show a link<br />
to the RA.<br />
Port errors occur or there is no target<br />
when running the SAN diagnostics.<br />
The management console shows RA<br />
failure with details pointing to a<br />
problem with the repository volume.<br />
The link indicator lights on the HBA or<br />
HBAs are not illuminated.<br />
The port indicator lights on the<br />
network switch or hub no longer show<br />
a link to the RA.<br />
Reboot regulation failover<br />
Failure of all SAN Fibre Channel HBAs on one RA<br />
Onboard WAN network adapter failure<br />
(Or failure of the optional gigabit Fibre Channel<br />
WAN network adapter)<br />
8–2 6872 5688–002
Solving Replication Appliance (RA) Problems<br />
Table 8–2. Possible Problems for Single RA Failure Wthout a<br />
Switchover<br />
Symptoms Possible Problem<br />
The link indicators lights on the onboard<br />
management network adapter are not<br />
illuminated.<br />
The failure light for the hard disk<br />
indicates a failure.<br />
An error message that appears during a<br />
boot operation indicates failure of one of<br />
the internal disks.<br />
The link indicator lights on the HBA are<br />
not illuminated.<br />
The port indicator lights on the Fibre<br />
Channel switch no longer show a link to<br />
the RA.<br />
For one of the ports on the relevant RA,<br />
errors appear when running the SAN<br />
diagnostics.<br />
Onboard management network adapter<br />
failure<br />
Single hard-disk failure<br />
Port failure of a single SAN Fibre Channel<br />
HBA on one RA<br />
Table 8–3. Possible Problems for Multiple RA Failures with<br />
Symptoms<br />
Symptoms Possible Problem<br />
Replication has stopped on all groups.<br />
MSCS fails over groups to the other<br />
site, or MSCS fails on all nodes.<br />
The management console displays a<br />
WAN error to the other site.<br />
Replication has stopped on all groups.<br />
MSCS fails over groups to the other<br />
site, or MCSC fails on all nodes.<br />
The management console displays a<br />
WAN error to the other site.<br />
Failure of all RAs on one site<br />
All RAs on one site are not attached<br />
6872 5688–002 8–3
Solving Replication Appliance (RA) Problems<br />
Single RA Failures<br />
Problem Description<br />
When an RA fails, a switchover might occur. In some cases, a switchover does not<br />
occur. See “Single RA Failures With Switchover” and “Single RA Failures Without<br />
Switchover.”<br />
Understanding Management Console Access<br />
If the RA that failed had been running site control—that is, the RA owned the virtual<br />
management IP network—and a switchover occurs, the virtual IP address moves to the<br />
new RA.<br />
If you attempt to connect to the management console using one of the static<br />
management IP addresses of the RAs, a connection error occurs if the RA does not have<br />
site control. Thus, you should use the site management IP address to connect to the<br />
management console.<br />
At least one RA (either RA 1 or RA 2) must be attached to the RA cluster for the<br />
management console to function.<br />
If the RA that failed was running site control and a switchover does not occur (such as<br />
with an onboard management network connection failure), the management console<br />
might not be accessible. Also, attempts to log in using PuTTY fail if you use the<br />
boxmgmt log-in account. When an RA does not have site control, you can always log in<br />
using PuTTY and the boxmgmt log-in account.<br />
You cannot determine which RA owns site control unless the management console is<br />
accessible. The site control RA is designated at the bottom of the display as follows:<br />
Another situation in which you cannot log in to the management console is when the<br />
user account has been locked. In this case, follow these steps:<br />
1. Log in interactively using PuTTY with another unlocked user account.<br />
2. Enter unlock_user.<br />
3. Determine whether any users are listed, and follow the messages to unlock the<br />
locked user accounts.<br />
8–4 6872 5688–002
6872 5688–002<br />
Figure 8–1 illustratees<br />
a single RA failure.<br />
Single RA Failure wwith<br />
Switchover<br />
Solving Replication Appliance e (RA) Problems<br />
Figure 8–1. Single RA Failure<br />
In this case, a single<br />
RA fails, and there is an automatic switchover to a surviving RA on<br />
the same site. Any groups that had been running on the failed RA run on o a surviving RA<br />
at the same site.<br />
Each RA handles thhe<br />
replicating activities of the consistency groups for r which it is<br />
designated as the ppreferred<br />
RA. The consistency groups that are affect ted are those that<br />
were configured wiith<br />
the failed RA as the preferred RA. Thus, whenever<br />
an RA becomes<br />
inoperable, the handling<br />
of the consistency groups for that RA switches s over<br />
automatically to thee<br />
functioning RAs in the same RA cluster.<br />
During the RA switchover<br />
process, the server applications do not experience<br />
any I/O<br />
failures. In a geograaphic<br />
clustered environment, MSCS is not aware of the RA failure,<br />
and all application aand<br />
replication operations continue to function norma ally. However,<br />
performance mightt<br />
be affected because the I/O load on the surviving RAs R is now<br />
increased.<br />
8–5
Solving Replication Appliance (RA) Problems<br />
Symptoms<br />
Failures of an RA that cause a switchover are as follows:<br />
• RA hardware issues (such as memory, motherboard, and so forth)<br />
• Reboot regulation failover<br />
• Failure of all SAN Fibre Channel HBAs on one RA<br />
• Onboard WAN network adapter failure (or failure of the optional gigabit Fibre Channel<br />
WAN network adapter)<br />
The following symptoms might help you identify this failure:<br />
• The RA does not boot.<br />
From a power-on reset, the BIOS display shows the BIOS information, RAID adapter<br />
utility prompt, logical drives found, and so forth. The display is similar to the<br />
information shown in Figure 8–2.<br />
Figure 8–2. Sample BIOS Display<br />
Once the RA initializes, the log-in screen is displayed.<br />
Note: Because status messages normally scroll on the screen, you might need to<br />
press Enter to see the log-in screen.<br />
• The management console system status shows an RA failure. (See Figure 8–3.)<br />
To display more information about the error, click the red error in the right column.<br />
The More Info dialog box is displayed with a message similar to the following:<br />
RA 1 in West is down<br />
8–6 6872 5688–002
Solving Replication Appliance (RA) Problems<br />
Figure 8–3. Management Console Display Showing RA Error and RAs Tab<br />
• The RAs tab on the management console shows information similar to that in<br />
Figure 8–3, specifically<br />
− The RA status for RA 1 on the West site shows an error.<br />
− The peer RA on the East site (RA 1) shows a data link error.<br />
− Each RA on the East site shows a WAN connection failure.<br />
− The surviving RA at the failed site (West) does not show any errors.<br />
• Warnings and informational messages similar to those shown in Figure 8–4 appear<br />
on the management console when an RA fails and a switchover occurs. See the<br />
table after the figure for an explanation of the numbered console messages. In your<br />
environment, the messages pertain only to the groups configured to use the failed<br />
RA as the preferred RA.<br />
6872 5688–002 8–7
Solving Replication Appliance (RA) Problems<br />
Figure 8–4. Management Console Messages for Single RA Failure with Switchover<br />
Reference<br />
No.<br />
The following table explains the numbered messages shown in Figure 8–4.<br />
Event<br />
ID<br />
Description E-mail<br />
Immediate<br />
1 3023 At the same site, the other RA reports a<br />
problem getting to the LAN of the failed RA.<br />
2 3008 The site with the failed RA reports that the RA is<br />
probably down.<br />
3 2000 The management console is now running on RA<br />
2.<br />
4 4001 For each consistency group, a minor problem is<br />
reported. The details show that the RA is down<br />
or not a cluster member.<br />
5 4008 For each consistency group, the transfer is<br />
paused at the surviving site to allow a<br />
switchover. The details show the reason for the<br />
pause as switchover.<br />
E-mail Daily<br />
Summary<br />
8–8 6872 5688–002<br />
X<br />
X<br />
X<br />
X<br />
X
Reference<br />
No.<br />
Event<br />
ID<br />
Solving Replication Appliance (RA) Problems<br />
Description E-mail<br />
Immediate<br />
6 4041 For each consistency group at the same site,<br />
the groups are activated at the surviving RA.<br />
This probably means that a switchover to RA 2<br />
at the failed site was successful.<br />
7 5032 For each consistency group at the failed site, the<br />
splitter is again splitting.<br />
8 3021 A WAN link error is reported from each RA at<br />
the surviving site regarding the failed RA at the<br />
other site.<br />
9 4010 For each consistency group at the failed site, the<br />
transfer is started.<br />
10 4086 For each consistency group at the failed site, an<br />
initialization is performed.<br />
11 4087 For each consistency group at the failed site,<br />
the initialization completes.<br />
E-mail Daily<br />
Summary<br />
12 3007 The failed RA (RA 1) is now restored. X<br />
To see the details of the messages listed on the management console display, you must<br />
collect the logs and then review the messages for the time of the failure. Appendix A<br />
explains how to collect the management console logs, and Appendix E lists the event<br />
IDs with explanations.<br />
Actions to Resolve the Problem<br />
The following list summarizes the actions you need to perform to isolate and resolve the<br />
problem:<br />
• Check the LCD display on the front panel of the RA. See “LCD Status Messages” in<br />
Appendix B for more information.<br />
If the LCD display shows an error, run the RA diagnostics. See Appendix B for more<br />
information.<br />
• Check all indicator lights on the rear panel of the RA.<br />
• Review the symptoms and actions in the following topics:<br />
− Reboot Regulation<br />
− Onboard WAN Network Adapter Failure<br />
• If you determine that the failed RA must be replaced, contact the Unisys service<br />
representative for a replacement RA.<br />
After you receive the replacement RA, follow the steps in Appendix D to install and<br />
configure it.<br />
6872 5688–002 8–9<br />
X<br />
X<br />
X<br />
X<br />
X<br />
X
Solving Replication Appliance (RA) Problems<br />
The following procedure provides a detailed description of the actions to perform:<br />
1. Remove the front bezel of the RA and look at the LCD display. During normal<br />
operation, the illuminated message should identify the system.<br />
If the LCD display flashes amber, the system needs attention because of a problem<br />
with power supplies, fans, system temperature, or hard drives.<br />
Figure 8–5 shows the location of the LCD display.<br />
Figure 8–5. LCD Display on Front Panel of RA<br />
If an error message is displayed, check Table B–1. For example, the message E0D76<br />
indicates a drive failure. (Refer to “Single Hard Disk Failure” in this section.)<br />
If the message code is not listed in the Table B–1, run the RA diagnostics, (see<br />
Appendix B).<br />
2. Check the indicators at the rear of the RA as described in the following steps and<br />
visually verify that all are working correctly.<br />
Figure 8–6 illustrates the rear panel of the RA.<br />
Note: The network connections on the rear panel labeled 1 and 2 in the following<br />
illustration might appear different on your RA. The connection labeled 1 is always the RA<br />
replication network, and the connection labeled 2 is always the RA management<br />
network. Pay special attention to the labeling when checking the network connections.<br />
8–10 6872 5688–002
6872 5688–002<br />
Solving Replication Appliance e (RA) Problems<br />
Figure 88–6.<br />
Rear Panel of RA Showing Indicators<br />
• Ping each netwwork<br />
connection (management network and replicatio on network), and<br />
visually verify thhat<br />
the LEDs on either side of the cable on the back k panel are<br />
illuminated. Figure<br />
8–7 shows the location of these LEDs.<br />
If the LEDs are off, the network is not connected. The green LED is<br />
lit if the network<br />
is connected too<br />
a valid link partner on the network. The amber LED D blinks when<br />
network data iss<br />
being sent or received.<br />
If the managemment<br />
network LEDs indicate a problem, refer to “Onboard<br />
Management NNetwork<br />
Adapter Failure” in this section.<br />
If the replication<br />
network LEDs indicate a problem, refer to “Onboa ard WAN Network<br />
Adapter Failure”<br />
in this section.<br />
Figure 8–7. Location of Network LEDs<br />
• Check that the green LEDs for the SAN Fibre Channel HBAs are illu uminated as<br />
shown in Figuree<br />
8–8.<br />
8–11
Solving Replication Appliance (RA) Problems<br />
Figure 8–8. Location of SAN Fibre Channel HBA LEDs<br />
The following table explains the LED patterns and their meanings. If the LEDs<br />
indicate a problem, refer to the two topics for SAN Fibre Chanel HBA failures in this<br />
section.<br />
Green LED Amber LED Activity<br />
On On Power<br />
On Off Online<br />
Off On Signal acquired<br />
Off Flashing Loss of synchronization<br />
Flashing Flashing Firmware error<br />
Reboot Regulation<br />
Problem Description<br />
After frequent, unexplained reboots or restarts of the replication process, the RA<br />
automatically detaches from the RA cluster.<br />
When installing the RAs, you can enable or disable this reboot regulation feature. The<br />
factory default is for the feature to be enabled so that reboot regulation is triggered<br />
whenever a specified number of reboots or failures occur within the specified time<br />
interval.<br />
The two parameters available for the reboot regulation feature are the number of reboots<br />
(including internal failures) and the time interval. The default value for the number of<br />
reboots is 10, and the default value for the time interval is 2 hours.<br />
Only Unisys personnel should change these values. Use the Installation Manager to<br />
change the parameter values or disable the feature. See the Unisys <strong>SafeGuard</strong> <strong>Solutions</strong><br />
Replication Appliance Installation <strong>Guide</strong> for information about using the Installation<br />
Manager tools to make these changes.<br />
8–12 6872 5688–002
Symptoms<br />
The following symptoms might help you identify this failure:<br />
Solving Replication Appliance (RA) Problems<br />
• Frequent transfer pauses for all consistency groups that have the same preferred<br />
RA.<br />
• If you log in to the RA as the boxmgmt user, the following message is displayed:<br />
Reboot regulation limit has been exceeded<br />
• Several messages might be displayed on the Logs tab of the management console<br />
as an RA reboots to try to correct a problem. These messages are listed in<br />
Table 8–4.<br />
Table 8–4. Management Console Messages Pertaining to Reboots<br />
Reference<br />
No./Legend<br />
Event<br />
ID<br />
* 3008 The RA appears to be down.<br />
The RA might attempt to<br />
perform a reboot to correct<br />
the problem.<br />
* 3023 Error in LAN link (as RA<br />
reboots).<br />
* 3021 Error in WAN link (as RA<br />
reboots).<br />
* 3007 The RA is up (the reboot<br />
completes).<br />
* 3022 The LAN link is restored (the<br />
reboot has completed).<br />
* 3020 The WAN link at other site is<br />
restored (the reboot has<br />
completed).<br />
Description E-mail<br />
Immediate<br />
E-mail Daily<br />
Summary<br />
When any of these messages appear multiple times in a short time period, they<br />
might indicate an RA that has continuously rebooted and might have reached the<br />
reboot regulation limit.<br />
Actions to Resolve the Problem<br />
Perform the following actions to isolate and resolve the problem:<br />
1. Collect the RA logs before you attempt to resolve the problem. See Appendix A for<br />
information about collecting logs.<br />
2. To determine whether the hardware is faulty, run the RA diagnostics described in<br />
Appendix B.<br />
3. If the problem remains, submit the RA logs to Unisys for analysis.<br />
6872 5688–002 8–13<br />
X<br />
X<br />
X<br />
X<br />
X<br />
X
Solving Replication Appliance (RA) Problems<br />
4. Once the problem is corrected, the RA automatically attaches to the RA cluster after<br />
a power-on reset. If necessary, reattach the RA to the RA cluster manually by<br />
following these steps:<br />
a. Log in as boxmgmt to the RA through an SSH session using PuTTY.<br />
b. At the prompt, type 4 (Cluster operations) and press Enter.<br />
c. At the prompt, type 1 (Attach to cluster) to attach the RA to the cluster.<br />
d. At the prompt, type Q (Quit).<br />
Failure of All SAN Fibre Channel Host Bus Adapters (HBAs<br />
Problem Description<br />
Symptoms<br />
All SAN Fibre Channel HBAs or adapter ports on the RA fail. This scenario is unlikely<br />
because the RA has redundant ports that are located on different physical adapters. A<br />
SAN connectivity problem is more likely.<br />
Note: A single redundant path does not show errors on the management console<br />
display. See “Port Failure on a Single SAN Fibre Channel HBA on One RA.”<br />
The following symptoms might help you identify this failure:<br />
• The link indicator lights on all SAN Fibre Channel HBAs are not illuminated. (Refer to<br />
Figure 8–8 for the location of these LEDs.)<br />
• The port indicator lights on the Fibre Channel switch no longer show a link to the RA.<br />
• Port errors occur or no target appears when running the Installation Manager SAN<br />
diagnostics.<br />
• Information on the Volumes tab of the management console is inconsistent or<br />
periodically changing.<br />
• The management console shows failures for RAs, storage, and hosts. (See<br />
Figure 8–9.)<br />
8–14 6872 5688–002
Solving Replication Appliance (RA) Problems<br />
Figure 8–9. Management Console Display: Host Connection with RA Is<br />
Down<br />
If you click the red error indication for RAs in the right column, the message is<br />
RA 2 in East can’t access repository volume<br />
If you click the red error indication for storage in the right column, the following<br />
messages are displayed:<br />
If you click the red error indication in the right column for splitters, the message is<br />
ERROR: USMV-EAST2's connection with RA2 is down<br />
• Warnings and informational messages similar to those shown in Figure 8–10 appear<br />
on the management console when an RA fails with this type of problem. See the<br />
table after the figure for an explanation of the numbered console messages.<br />
Also, refer to Figure 8–4 and the table that explains the messages for information<br />
about an RA failure with a generic switchover.<br />
Refer to Table 8–4 for other messages that might occur whenever an RA reboots to<br />
try to correct the problem.<br />
6872 5688–002 8–15
Solving Replication Appliance (RA) Problems<br />
Figure 8–10. Management Console Messages for Failed RA (All SAN HBAs Fail)<br />
8–16 6872 5688–002
Reference<br />
No.<br />
Solving Replication Appliance (RA) Problems<br />
The following table explains the numbered messages shown in Figure 8–10. You<br />
might also see the messages denoted with an asterisk (*).<br />
Event<br />
ID<br />
Description<br />
1 3014 The RA is unable to access the<br />
repository volume (RA 2).<br />
2 4003 For each consistency group that had<br />
the failed RA as the preferred RA, a<br />
group consistency problem is<br />
reported. The details show a<br />
repository volume problem.<br />
3 3012 The RA is unable to access volumes<br />
(all volumes for repository, journal, and<br />
data are listed).<br />
4 4086 Initialization started (RA 1, Quorum ---<br />
West).<br />
5 4087 Initialization complete (RA 1, Quorum -<br />
West). The group has completed the<br />
switchover.<br />
E-mail<br />
Immediate<br />
E-mail<br />
Daily<br />
Summary<br />
To see the details of the messages listed on the management console display, you<br />
must collect the logs and then review the messages for the time of the failure.<br />
Appendix A explains how to collect the management console logs, and Appendix E<br />
lists the event IDs with explanations.<br />
Actions to Resolve the Problem<br />
Perform the following actions to isolate and resolve the problem:<br />
1. Refer to Section 6, “Solving SAN Connectivity Problems,” to determine whether the<br />
problem is described there.<br />
2. If you determine that the SAN Fibre Channel HBA failed and must be replaced,<br />
contact a Unisys service representative for a replacement adapter.<br />
3. Once the replacement adpter is received, perform the following steps to replace the<br />
failed HBA:<br />
a. Open a PuTTY session using the IP address of the RA and log in as<br />
boxmgmt/boxmgmt.<br />
Appendix C provides additional information about the Installation Manager<br />
diagnostics.<br />
b. On the Main menu, type 3 (Diagnostics) and press Enter.<br />
c. On the Diagnostics menu, type 2 (Fibre Channel diagnostics) and press<br />
Enter.<br />
d. On the Fibre Channel Diagnostics menu, type 4 (View Fibre Channel<br />
details) and press Enter.<br />
6872 5688–002 8–17<br />
X<br />
X<br />
X<br />
X<br />
X
Solving Replication Appliance (RA) Problems<br />
Information similar to the following is displayed:<br />
>>Site1 Box 1>>3<br />
Port 0<br />
wwn = 50012482001c6fb0<br />
node_wwn = 50012482001c6fb1<br />
Port id = 0x20100<br />
operating mode = point to point<br />
speed<br />
Port 1<br />
= 2 GB<br />
---------------------------------wwn<br />
= 50012482001ce3c4<br />
node_wwn = 50012482001ce3c5<br />
Port id = 0x10100<br />
operating mode = point to point<br />
speed = 2 GB<br />
e. Write down the port information.<br />
f. On the Fibre Channel Diagnostics menu, type B (Back) and press Enter.<br />
g. On the Diagnostics menu, type B (Back) and press Enter.<br />
h. On the Main Menu, type 4 (Cluster operations) and press Enter.<br />
i. On the Cluster Operations menu, type 2 (Detach from cluster) and press<br />
Enter.<br />
j. Shut down the RA.<br />
k. Replaced the failed adapter with the replacement and then boot the RA.<br />
Note: The replacement adapter does not require any settings to be changed.<br />
l. Repeat steps a through d, and again view the Fibre Channel details to see the<br />
new WWN for the replaced HBA.<br />
m. Using the management of the SAN switch, make the modifications to the zoning<br />
as needed to replace the failed WWN with the new WWN.<br />
n. Use the new WWN to configure the storage.<br />
o. On the Fibre Channel Diagnostics menu, type 1 (SAN diagnostics) and<br />
press Enter. (Refer to steps a through c to access the Fibre Channel<br />
Diagnostics menu.)<br />
When you select the SAN diagnostics option, the system conducts automatic<br />
tests that are designed to identify the most common problems encountered in<br />
the configuration of SAN environments.<br />
Once the tests complete, a message is displayed confirming the successful<br />
completion of SAN diagnostics, or a report is displayed that details any critical<br />
configuration problems.<br />
p. Once no problems are reported from the SAN diagnostics, type B (Back) and<br />
press Enter.<br />
q. On the Fibre Channel Diagnostics menu, type B (Back) and press Enter.<br />
8–18 6872 5688–002
Solving Replication Appliance (RA) Problems<br />
r. On the Diagnostics menu, type B (Back) and press Enter.<br />
s. On the Main Menu, type 4 (Cluster operations) and press Enter.<br />
t. On the Cluster Operations menu, type 1 (Attach to cluster) and press Enter.<br />
This action reattaches the RA, which automatically reboots and restarts<br />
replication.<br />
Note: The replacement Fibre Channel HBA does not need any configuration changes.<br />
Failure of Onboard WAN Adapter or Failure of Optional Gigabit<br />
Fibre Channel WAN Adapter<br />
Problem Description<br />
Symptoms<br />
The onboard WAN adapter failed. This capability serves the replication network.<br />
Notes:<br />
• The gigabit Fibre Channel WAN adapter is an optional component found in some<br />
environments. When this board fails, the symptoms are the same as those observed<br />
when the onboard WAN adapter fails. In that case, the indicator lights pertain to the<br />
gigabit Fibre Channel WAN board instead of the onboard capability.<br />
• The actions to resolve the problem are similar once you isolate the board as the<br />
problem. That is, contact a Unisys service representative for a replacement part.<br />
The following symptoms might help you identify this failure:<br />
• Transfer between sites pauses temporarily for all consistency groups for which this<br />
is the preferred RA while an RA switchover occurs.<br />
• Applications continue to run. High loads might occur because of reduced total<br />
throughput capacity.<br />
• The link indicators on the onboard WAN adapter might not be illuminated. (See<br />
Figure 8–6 for the location of the connector for the replication network WAN.<br />
Figure 8–7 illustrates the LEDs.)<br />
• The port lights on the network switch might indicate that there is no link to the<br />
onboard WAN adapter.<br />
• The management console shows a WAN data link failure for RA 1. The More<br />
information for this error provides the message: “RA-x WAN data link is down.” (See<br />
Figure 8–11.)<br />
6872 5688–002 8–19
Solving Replication Appliance (RA) Problems<br />
Figure 8–11. Management Console Showing WAN Data Link Failure<br />
• The RAs tab on the management console (Figure 8–11) shows an error for the same<br />
RA at each site, indicating that the connectivity between them has been lost.<br />
• Warnings and informational messages similar to those shown in Figure 8–4 for an<br />
RA failure are displayed for this failure. Refer to the table after Figure 8–4 for<br />
descriptions of the messages. For this failure, the details of event ID 4001 show a<br />
WAN data path problem.<br />
Actions to Resolve the Problem<br />
Perform the following actions to isolate and resolve the problem:<br />
• Isolate the problem to the onboard WAN adapter by performing the actions in<br />
“Replication Network Failure in a Geographic Clustered Environment” in<br />
Section 7.<br />
• If you determine that the motherboard must be replaced, contact a Unisys service<br />
representative for a replacement part.<br />
• Contact the Unisys <strong>Support</strong> Center for the appropriate BIOS for the replacement<br />
part.<br />
Note: The replacement motherboard might not have the disk controller set for<br />
RAID1 (mirroring). Check the setting and change it if necessary.<br />
• In rare cases, you might need to obtain a replacement RA from a Unisys service<br />
representative. After you receive the replacement RA, follow the steps in Appendix<br />
D to install and configure it.<br />
8–20 6872 5688–002
Solving Replication Appliance (RA) Problems<br />
Single RA Failures Without a Switchover<br />
Problem Description<br />
Some failures that might occur on an RA do not cause a switchover. These failures are<br />
• Port failure on a single SAN Fibre Channel HBA on one RA<br />
• Onboard management network adapter failure<br />
• Single hard disk failure<br />
Port Failure on a Single SAN Fibre Channel HBA on One RA<br />
Problem Description<br />
Symptoms<br />
One SAN Fibre Channel HBA port on the RA failed.<br />
The following symptoms might help you identify this failure:<br />
• The Logs tab on the management console displays a message for event ID 3030—<br />
Warning RA switched path to storage. (RA , Volumes )—only if the<br />
connection failed during an I/O operation.<br />
• The link indicator lights on the SAN Fibre Channel HBA are not illuminated. (Refer to<br />
Figure 8–8 for the location of these LEDs.)<br />
• The port indicator lights on the Fibre Channel switch no longer show a link to the RA.<br />
• For one port on the relevant RA, errors occur when running the Installation Manager<br />
SAN diagnostics. See Appendix C for information about these diagnostics.<br />
Actions to Resolve the Problem<br />
Perform the following actions to isolate and resolve the problem:<br />
1. If you determine that the SAN Fibre Channel HBA failed and must be replaced,<br />
contact a Unisys service representative for a replacement part.<br />
2. Once the replacement adapter is received, perform the following steps to replace<br />
the failed HBA:<br />
a. Open a PuTTY session using the IP address of the RA, and log in as<br />
boxmgmt/boxmgmt.<br />
Appendix C provides additional information about the Installation Manager<br />
diagnostics.<br />
b. On the Main menu, type 3 (Diagnostics) and press Enter.<br />
c. On the Diagnostics menu, type 2 (Fibre Channel diagnostics) and press<br />
Enter.<br />
d. On the Fibre Channel Diagnostics menu, type 4 (View Fibre Channel<br />
details) and press Enter.<br />
6872 5688–002 8–21
Solving Replication Appliance (RA) Problems<br />
Information similar to the following is displayed:<br />
>>Site1 Box 1>>3<br />
Port 0<br />
wwn = 50012482001c6fb0<br />
node_wwn = 50012482001c6fb1<br />
Port id = 0x20100<br />
operating mode = point to point<br />
speed<br />
Port 1<br />
= 2 GB<br />
---------------------------------wwn<br />
= 50012482001ce3c4<br />
node_wwn = 50012482001ce3c5<br />
Port id = 0x10100<br />
operating mode = point to point<br />
speed = 2 GB<br />
e. Write down the port information.<br />
f. On the Fibre Channel Diagnostics menu, type B (Back) and press Enter.<br />
g. On the Diagnostics menu, type B (Back) and press Enter.<br />
h. On the Main Menu, type 4 (Cluster operations) and press Enter.<br />
i. On the Cluster Operations menu, type 2 (Detach from cluster) and press<br />
Enter.<br />
j. Shut down the RA.<br />
k. Replaced the failed adapter with the replacement and then boot the RA.<br />
Note: The replacement adapter does not require any settings to be changed.<br />
l. Repeat steps a through d and again view the Fibre Channel details to see the<br />
new WWN for the replaced HBA.<br />
m. Using the management of the SAN switch, make the modifications to the zoning<br />
as needed to replace the failed WWN with the new WWN.<br />
n. Use the new WWN to configure the storage.<br />
o. On the Fibre Channel Diagnostics menu, type 1 (SAN diagnostics) and<br />
press Enter. (Refer to steps a through c to access the Fibre Channel<br />
Diagnostics menu.)<br />
When you select the SAN diagnostics option, the system conducts automatic<br />
tests that are designed to identify the most common problems encountered in<br />
the configuration of SAN environments.<br />
Once the tests complete, a message is displayed confirming the successful<br />
completion of SAN diagnostics, or a report is displayed that details any critical<br />
configuration problems.<br />
p. Once no problems are reported from the SAN diagnostics, type B (Back) and<br />
press Enter.<br />
q. On the Fibre Channel Diagnostics menu, type B (Back) and press Enter.<br />
8–22 6872 5688–002
Solving Replication Appliance (RA) Problems<br />
r. On the Diagnostics menu, type B (Back) and press Enter.<br />
s. On the Main Menu, type 4 (Cluster operations) and press Enter.<br />
t. On the Cluster Operations menu, type 1 (Attach to cluster) and press Enter.<br />
This action reattaches the RA, which automatically reboots and restarts<br />
replication.<br />
Note: The replacement Fibre Channel HBA does not need any configuration changes.<br />
Onboard Management Network Adapter Failure<br />
Problem Description<br />
Symptoms<br />
The onboard management network adapter failed.<br />
The following symptoms might help you identify this failure:<br />
• On the management console, the system status and RA status do not display any<br />
error indications.<br />
• The link indicators on the onboard management network adapter are not illuminated.<br />
(See Figure 8–6 for the location of the connector for the onboard management<br />
network adapter. Figure 8–7 illustrates the LEDs.)<br />
• If RA site control was running on the failed RA, you cannot access the management<br />
console or if the management console was open, a banner is displayed showing<br />
“not connected.”<br />
• If RA site control was not running on the failed RA, you can access the management<br />
console.<br />
• You cannot determine which RA owns site control unless the management console<br />
is accessible. The RA site control is designated at the bottom of the display as<br />
follows:<br />
• See “Management Network Failure in a Geographic Clustered Environment” in<br />
Section 7 for additional symptoms.<br />
• The Logs tab on the management console might display a message for event ID<br />
3023—Error in LAN link to RA (RA1)—for this failure.<br />
6872 5688–002 8–23
Solving Replication Appliance (RA) Problems<br />
Actions to Resolve the Problem<br />
Perform the following actions to isolate and resolve the problem:<br />
• Isolate the problem to the onboard management network adapter by performing the<br />
actions in “Management Network Failure in a Geographic Clustered Environment” in<br />
Section 7.<br />
• If you determine the motherboard must be replaced, contact a Unisys service<br />
representative for a replacement part.<br />
• Contact the Unisys <strong>Support</strong> Center for the appropriate BIOS for the replacement<br />
part.<br />
Note: The replacement motherboard might not have the disk controller set for<br />
RAID1 (mirroring). Check the setting and change it if necessary.<br />
• In rare cases, you might need to obtain a replacement RA from a Unisys service<br />
representative. After you receive the replacement RA, follow the steps in Appendix<br />
D to install and configure it.<br />
Single Hard Disk Failure<br />
Problem Description<br />
Symptoms<br />
One of the mirrored internal hard disks for the RA failed.<br />
The following symptoms might help you identify this failure:<br />
• The failure light for a hard disk indicates a failure. Figure 8–12 illustrates the location<br />
of the LEDs for hard disks in the RA.<br />
8–24 6872 5688–002
Solving Replication Appliance (RA) Problems<br />
Figure 8–12. Location of Hard Drive LEDs<br />
• An error message that appears during boot indicates failure of one of the internal<br />
disks.<br />
• The LCD display on the front panel of the RA indicates a drive failure. This error code<br />
is E0D76 as shown in Figure 8–5.<br />
Actions to Resolve the Problem<br />
Perform the following actions to isolate and resolve the problem:<br />
• If the drive failed, you must replace the hard drive. Contact a Unisys service<br />
representative for a replacement part.<br />
• Install the new drive; resynchronization occurs automatically.<br />
Do not power off or reboot the RA while resynchronization is taking place.<br />
Failure of All RAs at One Site<br />
Problem Description<br />
If all RAs fail on one site, replication stops and the data that are currently changing on the<br />
remote site are marked for synchronization. Once the RAs are restored, synchronization<br />
occurs through a full \-sweep operation.<br />
This type of failure is unlikely unless the power source fails.<br />
6872 5688–002 8–25
Solving Replication Appliance (RA) Problems<br />
Symptoms<br />
The following symptoms might help you identify this failure:<br />
• Transfer is paused for all consistency groups.<br />
• Depending on the environment and group settings, applications that were running on<br />
the failed site might stop.<br />
• If the quorum resource belonged to a node at the failed site, MCSC might fail.<br />
• The symptoms for this failure are similar to a total site failure and a network failure<br />
on both the management network and WAN. Because the WAN link is functioning,<br />
the difference is that the following are true:<br />
− Neither site can access the management console using the site management IP<br />
address of the site with the failed RAs.<br />
− Both sites can access the management console using the site management IP<br />
address of the site with the functioning RAs.<br />
Communicate with the administrator at the other site to determine whether that site<br />
can access the management console. Both sites should see a display similar to<br />
Figure 8–13.<br />
Figure 8–13. Management Console Showing All RAs Down<br />
Actions to Resolve the Problem<br />
Perform the following actions to isolate and resolve the problem:<br />
1. Restore power to the failed RAs.<br />
2. If recovery of applications is needed prior to restoring the RAs, see the recovery<br />
topics in Section 3 for geographic replication environments and in Section 4 for<br />
geographic clustered environments.<br />
8–26 6872 5688–002
All RAs Are Not Attached<br />
Problem Description<br />
Symptoms<br />
Solving Replication Appliance (RA) Problems<br />
If all RAs at a site are not attached, connection to the management console is not<br />
available. Also, you cannot access the RA using a PuTTY session and the site<br />
management IP address. You cannot log into the RA using the RA management IP<br />
address and the admin user account. The RA that runs site control is assigned a virtual IP<br />
address that is the site management IP address. Either RA 1 or RA 2 must be attached<br />
to the cluster to have an RA cluster with site control running.<br />
The following symptoms might help you identify this failure:<br />
• You cannot log in to the management console using the site management IP<br />
addresses of the failed sites.<br />
• You cannot initiate an SSH session through PuTTY using the admin account to either<br />
RA management IP address or the site management IP address.<br />
• From the management console of the other site, the WAN appears to be down. (See<br />
Figure 8–11.)<br />
Actions to Resolve the Problem<br />
Perform the following actions to isolate and resolve the problem:<br />
1. Ping the RA using the management IP address. If the ping is not successful, refer to<br />
“Management Network Failure in a Geographic Clustered Environment” in<br />
Section 7. If the ping completes successfully, continue with steps 2 through 5.<br />
2. Log in as boxmgmt to each RA management IP address through an SSH session<br />
using PuTTY. (See “Using the SSH Client” in Appendix C for more information.) If<br />
this is not successful, the RA is probably not attached.<br />
3. To verify that the RA is not attached, follow these steps:<br />
a. Log in as boxmgmt to the RA.<br />
b. At the prompt, type 4 (Cluster operations) and press Enter.<br />
Note: The “reboot regulation limit has been exceeded” message is displayed<br />
when you log in as boxmgmt. In that case, see “Reboot Regulation” in this<br />
section.<br />
c. At the prompt, type 2 (Detach from cluster) and press Enter.<br />
Do not type y to detach. If the RA was not attached, a message is displayed<br />
stating that it is not detached.<br />
6872 5688–002 8–27
Solving Replication Appliance (RA) Problems<br />
Note: Either RA 1 or RA 2 must be attached to have a cluster. RAs 3 through 8<br />
cannot become cluster masters.<br />
4. If the RA is not attached, then type B (Back) and press Enter.<br />
5. At the prompt, type 1 (Attach to cluster) to attach the RA to the cluster.<br />
6. At the prompt, type Q (Quit).<br />
7. Once the RA is attached, log in as admin to the management console and also<br />
initiate a SSH session to the management IP address to ensure that both are<br />
operational.<br />
8. At the management console, click the RAs tab and check that all connections are<br />
working.<br />
8–28 6872 5688–002
Section 9<br />
Solving Server Problems<br />
This section lists symptoms that usually indicate problems with one or more servers.<br />
The problems listed in this section include hardware failure problems. Table 9–1 lists<br />
symptoms and possible problems indicated by the symptom. The problems and their<br />
solutions are described in this section. The graphics, behaviors, and examples in this<br />
section are similar to what you observe with your system but might differ in some<br />
details.<br />
In addition to the symptoms listed, you might receive e-mail messages or SNMP traps<br />
for any of the possible problems or causes. Also, messages similar to e-mail notifications<br />
are displayed on the management console. If you do not see the messages, they might<br />
have already dropped off the display. Review the management console logs for<br />
messages that have dropped off the display.<br />
Table 9–1. Possible Server Problems with Symptoms<br />
Symptom Possible Problem<br />
The management console shows a server<br />
down.<br />
Messages on the management console<br />
show the splitter is down and that the<br />
node fails over.<br />
Multipathing software (such as EMC<br />
PowerPath Administrator) messages report<br />
errors. (This symptom might occur if the<br />
server is unable to connect with the SAN<br />
or if the server HBA fails.)<br />
Host logs and RA log timestamps are not<br />
synchronized.<br />
Cluster node failure (hardware or software)<br />
in geographic clustered environment<br />
possibly resulting from<br />
• Windows server reboot<br />
• Unexpected server shutdown because<br />
of a bug check<br />
• Server crash or restart<br />
• Server unable to connect with SAN<br />
• Server HBA failure<br />
Infrastructure (NTP) server failure<br />
Applications are down. Server failure (hardware or software) in<br />
geographic replication environment<br />
possibly resulting from<br />
• Windows server reboot<br />
• Unexpected server shutdown because<br />
of a bug check<br />
• Server crash or restart<br />
• Server unable to connect with SAN<br />
• Server HBA failure<br />
6872 5688–002 9–1
Solving Server Problems<br />
Cluster Node Failure<br />
(Hardware or Software) in i a<br />
Geographic Clusteered<br />
Environment<br />
Problem Description<br />
9–2<br />
MSCS uses several hearrtbeat<br />
mechanisms to detect whether a node is still actively<br />
responding to cluster acttivities.<br />
MSCS assumes a cluster node has failed wh hen the<br />
cluster node no longer reesponds<br />
to heartbeats that are broadcast over the pu ublic\private<br />
cluster networks and whhen<br />
a SCSI reservation is lost on the quorum volume e.<br />
Figure 9–1 illustrates thiss<br />
failure.<br />
Figure 9–1. Cluster Node Failure<br />
If the server that crashedd<br />
was the MSCS leader (quorum owner), another clu uster node<br />
(the challenger) tries to bbecome<br />
leader and arbitrate for the quorum device. Because the<br />
failed server is no longerr<br />
the quorum device owner in the reservation manag ger, the<br />
arbitration by the challenger<br />
instantly succeeds.<br />
If the challenger node is from the same site as the failed server, arbitration in nstantly<br />
succeeds, and no failoveer<br />
of the quorum device to the remote site is required.<br />
If the challenger node is from the remote site, the RA reverses the replicatio on direction<br />
of the quorum consistency<br />
group. Once failover completes, the challenger arbitration<br />
is<br />
completed.<br />
68 872 5688–002
Solving Server Problems<br />
When a nonleader MSCS node fails, the data groups move to the remaining MSCS local<br />
or remote nodes, depending on preferred ownership settings. From the perspective of<br />
the RA, this situation is equivalent to a user-initiated move of the data groups. That is,<br />
the <strong>SafeGuard</strong> 30m Control resource on the node that tries to bring the group online<br />
sends a command to fail over the group to its site. If the group fails over to a cluster<br />
node on the same site, failover occurs instantly. Otherwise, a consistency group failover<br />
is initiated to the remote site. The <strong>SafeGuard</strong> 30m Control resource does not come<br />
online until the consistency group has completed failover.<br />
Possible Subset Scenarios<br />
The symptoms of a server failure vary based on the reasons that the server went down.<br />
Five different scenarios are described as subsets of this type of failure:<br />
• Windows Server Reboot<br />
• Unexpected Server Shutdown Because of a Bug Check<br />
• Server Crash or Restart<br />
• Server Unable to Connect with SAN<br />
• Server HBA Failure<br />
One of the first things to determine in troubleshooting a server failure is whether the<br />
failure was an unexpected event (a “crash”) or an orderly event such as an operator<br />
reboot. When the server crashes, you usually see a “blue screen” and do not have<br />
access to messages. Once the server comes up again, then you can view messages<br />
regarding the reason it crashed. These messages help diagnose the reason for the initial<br />
shutdown or failure.<br />
In an orderly event, the Windows event log is stopped, and you can view events that<br />
point to the reason for the reboot or restart.<br />
Windows Server Reboot<br />
Problem Description<br />
The consistency groups fail over to another local node or to the other site because a<br />
server fails or goes down. In this scenario, the shutdown is an orderly event and thus<br />
causes the Windows event log service to stop.<br />
6872 5688–002 9–3
Solving Server Problems<br />
Symptoms<br />
The following symptoms might help you identify this failure:<br />
• The management console display shows a server failure similar to that shown in<br />
Figure 9–2.<br />
Figure 9–2. Management Console Display with Server Error<br />
• Warning and informational messages similar to those shown in Figure 9–3 appear on<br />
the management console when a server fails. See the table after the figure for an<br />
explanation of the numbered console messages.<br />
9–4 6872 5688–002
Solving Server Problems<br />
Figure 9–3. Management Console Messages for Server Down<br />
6872 5688–002 9–5
Solving Server Problems<br />
Reference<br />
No.<br />
The following table explains the numbered messages shown in Figures 9–3.<br />
Event<br />
ID<br />
Description<br />
1 5008 The source site reports that server<br />
USMV-CAS100P2 performed an<br />
orderly shutdown.<br />
2 4062 The surviving site accesses the<br />
latest image of the consistency<br />
group during the failover.<br />
3 5032 For each consistency group that<br />
moves to a surviving node, the<br />
splitter is again splitting.<br />
4 4008 For each consistency group that<br />
moves to a surviving node, the<br />
transfer is paused. In the details of<br />
this message, the reason for the<br />
pause is given.<br />
5 1008 The Unisys <strong>SafeGuard</strong> 30m Control<br />
resource successfully issued an<br />
initiate_failover command.<br />
6 4086 For each consistency group that<br />
moves to asurviving node, data<br />
transfer starts and then a quick<br />
initialization starts.<br />
7 4087 For each consistency group that<br />
moves to a surviving node,<br />
initialization completes.<br />
E-mail<br />
Immediate<br />
E-mail<br />
Daily<br />
Summary<br />
To see the details of the messages listed on the management console display, you<br />
must collect the logs and then review the messages for the time of the failure.<br />
Appendix A explains how to collect the management console logs, and Appendix E<br />
lists the event IDs with explanations.<br />
• If you review the system event logs, you can find messages similar to the following<br />
examples that are based on the testing cases used to generate the previous<br />
management console images.<br />
System Event Log for Usmv-Cas100p2 Host (Failure Host on Site 1)<br />
6/01/2008 16:19:13 PM EventLog Information None 6006 N/A USMV-WEST2 The Event log<br />
service was stopped.<br />
6/01/2008 16:19:48 PM EventLog Information None 6009 N/A USMV-WEST2 Microsoft (R)<br />
Windows (R) 5.02. 3790 Service Pack 1 Multiprocessor Free.<br />
6/01/2008 16:19:48 PM EventLog Information None 6005 N/A USMV-USMV-WEST2. The Event<br />
log service was started.<br />
9–6 6872 5688–002<br />
X<br />
X<br />
X<br />
X<br />
X<br />
X<br />
X
Solving Server Problems<br />
System Event Log for Usmv-x455 Host (Surviving Host on Site 2)<br />
6/01/2008 16:19:15 PM ClusSvc Warning Node Mgr 1123 N/A USMV-EAST2 The node lost<br />
communication with cluster node 'USMV-WEST2' on network '<strong>Public</strong>'.<br />
6/01/2008 16:19:15 PM ClusSvc Warning Node Mgr 1123 N/A USMV-EAST2 The node lost<br />
communication with cluster node 'USMV-WEST2' on network 'Private'.<br />
6/01/2008 16:19:56 PM ClusSvc Warning Node Mgr 1135 N/A USMV-EAST2 Cluster node<br />
USMV-WEST2 was removed from the active server cluster membership. Cluster service may have been<br />
stopped on the node, the node may have failed, or the node may have lost communication with the other<br />
active server cluster nodes.<br />
• If you review the cluster log, you can find messages similar to the following<br />
examples that are based on the failed node owning the quorum used to generate the<br />
previous management console images:<br />
Cluster Log for Usmv-West2 Host (Failure Host on Site 1)<br />
0000089c.00000a54:: 2008/05/25-10:31:42.107 ERR [GUM]GumUpdateRemoteNode: Failed to get<br />
completion status for async RPC call,status 1115.(Error 1115: A system shutdown is in progress)<br />
0000089c.00000a54::2008/05/25-10:31:42.107 ERR [GUM] GumSendUpdate: Update on node 2 failed<br />
with 1115 when it must succeed<br />
0000089c.00000a54:: 2008/05/25-10:31:42.107 ERR [GUM] GumpCommFailure 1115 communicating<br />
with node 20000089c.00000a54:: 2008/05/25-10:31:42.107 ERR [NM] Banishing node 1 from active<br />
cluster membership.<br />
0000089c.00000a54:: 2008/05/25-10:31:42.107 ERR [RGP] Node 1: REGROUP WARNING: reload failed.<br />
0000089c.00000a54:: 2008/05/25-10:31:42.107 ERR [NM] Halting this node due to membership or<br />
communications error. Halt code = 1.<br />
0000089c.00000a54:: 2008/05/25-10:31:42.107 ERR [CS] Halting this node to prevent an inconsistency<br />
within the cluster. Error status = 5890. (Error 5890: An operation was attempted that is incompatible with<br />
the current membership state of the node)<br />
0000091c.00000fe4:: 2008/05/25-10:31:42.107 ERR [RM] LostQuorumResource, cluster service<br />
terminated...<br />
Cluster Log for Usmv-East2 Host (Surviving Host on Site 2)<br />
00000268.00000c38::2008/05/25-10:31:42.107 INFO [ClMsg] Received interface unreachable event for<br />
node 1 network 2<br />
00000268.00000c38::2008/05/25-10:31:42.107 INFO [ClMsg] Received interface unreachable event for<br />
node 1 network 1<br />
00000268.00000b70::2008/05/25-10:31:42.107 WARN [NM] Communication was lost with interface<br />
374359a2-5782-4b1d-a863-07f84f8c97d9 (node: USMV-WEST2, network: private)<br />
00000268.00000b70::2008/05/25-10:31:42.107 INFO [NM] Updating local connectivity info for network<br />
afe1f350-f66a-460a-a526-6f58987b911d.<br />
00000268.00000b70::2008/05/25-10:31:42.107 INFO [NM] Started state recalculation timer (2400ms) for<br />
network afe1f350-f66a-460a-a526-6f58987b911d (private)<br />
00000268.00000b70::2008/05/25-10:31:42.107 WARN [NM] Communication was lost with interface<br />
15b9fbe1-c05f-4e90-b937-17fdc27c133e (node: USMV-WEST2, network: public)<br />
00000268.00000b70::2008/05/25-10:31:42.107 INFO [NM] Updating local connectivity info for network<br />
9d905035-8105-4c87-a5bc-ce82e49e764a.<br />
00000268.00000b70::2008/05/25-10:31:42.107 INFO [NM] Started state recalculation timer (2400ms) for<br />
network 9d905035-8105-4c87-a5bc-ce82e49e764a (public)<br />
00000268.000005d0::2008/05/25-10:31:39.733 INFO [NM] We own the quorum resource..<br />
6872 5688–002 9–7
Solving Server Problems<br />
Actions to Resolve the Problem<br />
Perform the following actions to isolate and resolve the problem:<br />
• Check for event 5008 in the management console logs. If this event is replaced by<br />
event 5013, the host probably crashed. See “Unexpected Server Shutdown Because<br />
of a Bug Check” and “Server Crash or Restart.”<br />
• Review the cluster log and check for the system shutdown message as shown in<br />
the preceding examples. Determine whether the quorum resource moved by<br />
checking the surviving nodes for the message “We own the quorum resource.”<br />
• Review the Windows system event log messages and determine whether or not the<br />
server failure was a crash or an orderly event.<br />
In this case, based on the example messages, the Windows system event log<br />
shows that the system started the reboot or shutdown in an orderly manner at<br />
6:19:13 p.m. (message 6006). Because the event log service was shut down, the<br />
events that follow show that the event log service restarted.<br />
For an orderly event, often an operator shuts down the system for some planned<br />
reason.<br />
• If the event log messages do not point to an orderly event, then review<br />
“Unexpected Server Shutdown Because of a Bug Check” and “Server Crash or<br />
Restart” as possible scenarios that fit the circumstances.<br />
Unexpected Server Shutdown Because of a Bug Check<br />
Problem Description<br />
Symptoms<br />
The consistency groups fail over to another local node or to the other site because a<br />
server fails or shuts down unexpectedly and then reboots after the “blue screen” event.<br />
The following symptoms might help you identify this failure:<br />
• The management console display shows a server failure similar to that shown in<br />
Figure 9–2.<br />
• Warning and informational messages similar to those shown in Figure 9–4 appear on<br />
the management console when a server fails. See the table after the figure for an<br />
explanation of the numbered console messages.<br />
9–8 6872 5688–002
Solving Server Problems<br />
Figure 9–4. Management Console Messages for Server Down for Bug Check<br />
6872 5688–002 9–9
Solving Server Problems<br />
Reference<br />
No.<br />
The following table explains the numbered messages shown in Figure 9–4.<br />
Event<br />
ID<br />
Description<br />
1 5013 The splitter for the server USMV-<br />
WEST2 is down unexpectedly.<br />
2 4008 For each consistency group, the<br />
transfer is paused at the source (down)<br />
site. In the details of this message, the<br />
reason for the pause is given.<br />
3 5002 The splitter for server USMV-WEST2 is<br />
unable to access the RA unexpectedly.<br />
4 4008 For each consistency group, the<br />
transfer is paused at the surviving site<br />
to allow a switchover. In the details of<br />
this message, the reason for the pause<br />
is given.<br />
5 4062 The surviving site accesses the latest<br />
image of the consistency group during<br />
the failover.<br />
6 5032 For each consistency group at the<br />
surviving site, the splitter is splitting to<br />
the replication volumes.<br />
7 5002 The RA at the source (down) site<br />
cannot access the splitter for server<br />
USMV-WEST2.<br />
8 4010 For each consistency group at the<br />
source site, the transfer is started.<br />
9 4086 For each consistency group at the<br />
source site, data transfer starts and<br />
then initialization starts.<br />
10 4087 For each consistency group at the<br />
source site, initialization completes.<br />
E-mail<br />
Immediate<br />
E-mail<br />
Daily<br />
Summary<br />
To see the details of the messages listed on the management console display, you<br />
must collect the logs and then review the messages for the time of the failure.<br />
Appendix A explains how to collect the management console logs, and Appendix E<br />
lists the event IDs with explanations.<br />
• If you review the Windows system event logs after the system reboots, you can find<br />
messages similar to the following examples that are based on the testing cases<br />
used to generate the previous management console images.<br />
9–10 6872 5688–002<br />
X<br />
X<br />
X<br />
X<br />
X<br />
X<br />
X<br />
X<br />
X
System Log for Usmv-West2 Host (Failure Host on Site 1)<br />
Solving Server Problems<br />
6/01/2008 18:12:42 PM EventLog Error None 6008 N/A USMV-WEST2 The previous system<br />
shutdown at 18:02:42 PM on 6/01/2008 was unexpected.<br />
6/01/2008 18:12:42 PM EventLog Information None 6009 N/A USMV-WEST2 Microsoft (R)<br />
Windows (R) 5.02. 3790 Service Pack 1 Multiprocessor Free.<br />
6/01/2008 18:12:42 PM EventLog Information None 6005 N/A USMV-WEST2 The Event log<br />
service was started.<br />
6/01/2008 18:12:42 PM Save Dump Information None 1001 N/A USMV-WEST2 The<br />
computer has rebooted from a bugcheck. The bugcheck was: 0x0000007e (0xffffffffc0000005,<br />
0xe000015f97c8a664, 0xe000015f9e52be68, 0xe000015f9e52afb0). A dump was saved in:<br />
C:\WINDOWS\MEMORY.DMP.<br />
System Log for Usmv-East2 Host (Surviving Host on Site 2)<br />
6/01/2008 18:02:42 PM ClusSvc Warning Node Mgr 1123 N/A USMV-EAST2 The node lost<br />
communication with cluster node 'USMV-WEST2' on network '<strong>Public</strong>'.<br />
6/01/2008 18:02:42 PM ClusSvc Warning Node Mgr 1123 N/A USMV-EAST2 The node lost<br />
communication with cluster node 'USMV-WEST2' on network 'Private'.<br />
6/01/2008 18:02:42 PM ClusDisk Error None 1209 N/A USMV-EAST2 Cluster service is requesting<br />
a bus reset for device\Device\ClusDisk0.<br />
6/01/2008 18:02:42 PM ClusSvc Warning Node Mgr 1135 N/A USMV-EAST2 Cluster node<br />
USMV-WEST2 was removed from the active server cluster membership. Cluster service may have been<br />
stopped on the node, the node may have failed, or the node may have lost communication with the other<br />
active server cluster nodes.<br />
• If you review the cluster log, you can find messages similar to the following<br />
examples that are based on the testing cases used to generate the previous<br />
management console images:<br />
Cluster Log for Usmv-West2 Host (Failure Host on Site 1)<br />
For this error situation, no entries appear in the cluster log.<br />
Cluster Log for Usmv-East2 Host (Surviving Host on Site 2)<br />
000007e0.00000138::2008/06/01-18:02:42.104 INFO [ClMsg] Received interface unreachable event for<br />
node 1 network 2<br />
000007e0.00000138:: 2008/06/01-18:02:42.104 INFO [ClMsg] Received interface unreachable event for<br />
node 1 network 1<br />
000007e0.00000124:: 2008/06/01-18:02:42.104 WARN [NM] Communication was lost with interface<br />
5019923b-d7a1-4886-825f-207b5938d11e (node: USMV-WEST2, network: <strong>Public</strong>)<br />
000007e0.00000124:: 2008/06/01-18:02:42.104 WARN [NM] Communication was lost with interface<br />
f409cf69-9c30-48f0-8519-ad5dd14c3300 (node: B)<br />
000001c0.00000664:: 2008/06/01-18:02:42.507 ERR Physical Disk : [DiskArb] GetPartInfo<br />
completed, status 170. (Error 170: the request resource is in use)<br />
000001c0.00000664:: 2008/06/01-18:02:42.507 ERR Physical Disk : [DiskArb] Failed to read<br />
(sector 12), error 170.<br />
000001c0.00000664:: 2008/06/01-18:02:42.507 INFO Physical Disk : [DiskArb] We are about to<br />
break reserve.<br />
000007e0.00000a0c:: 2008/06/01-18:02:42.881 INFO [NM] We own the quorum resource.<br />
6872 5688–002 9–11
Solving Server Problems<br />
Actions to Resolve the Problem<br />
Perform the following actions to isolate and resolve the problem:<br />
1. Review the Windows application event log messages to determine the cause of the<br />
unexpected event.<br />
In this case, based on the four example messages, the first Windows system event<br />
log shows event 6008 in which the system unexpectedly shut down; it was not a<br />
reboot.<br />
Then event 6009 is typically displayed as a reboot message. This event occurs<br />
regardless of the reason for the reboot. The same is true for event 6005.<br />
The Save Dump event 1001 shows that a memory dump was saved. Based on this<br />
message, consult the Microsoft Knowledge Base regarding bug checks.<br />
(http://support.microsoft.com/). Search for bug check 0x0000007e, or stop<br />
error 0x0000007e and replace the stop number with the one displayed.<br />
2. Once you have the appropriate Knowledge Base article from the Microsoft site,<br />
follow the recommendations in the article to resolve the issue.<br />
3. If the information from the Knowledge Base article does not solve resolve the<br />
problem, collect and save the memory dump file and then submit it to the Unisys<br />
<strong>Support</strong> Center.<br />
Server Crash or Restart<br />
Problem Description<br />
Symptoms<br />
When the server goes down for whatever reason and then restarts in a geographic<br />
clustered environment, the consistency groups fail over to the other site and then fail<br />
over to the original site once the server is restarted.<br />
The following symptoms might help you identify his failure:<br />
• The management console display shows a server failure similar to that shown in<br />
Figure 9–2.<br />
• Warnings and informational messages similar to those shown in Figure 9–4 appear<br />
on the management console when the server fails. See the table after that figure for<br />
an explanation of the numbered console messages.<br />
• If you review the Windows system event log, you can find messages similar to the<br />
following examples that are based on the testing cases used to generate the<br />
management console images for Figures 9–2 and 9–4:<br />
9–12 6872 5688–002
System Log for Usmv-West2 Host (Failure Host on Site 1)<br />
Solving Server Problems<br />
6/01/2008 18:42:39 PM EventLog Error None 6008 N/A USMV-WEST2 The previous system<br />
shutdown at 18:05:55 PM on 6/01/2008 was unexpected.<br />
6/01/2008 18:42:39 PM EventLog Information None 6009 N/A USMV-WEST2 Microsoft (R)<br />
Windows (R) 5.02. 3790 Service Pack 2 Multiprocessor Free.<br />
6/01/2008 18:42:39 PM EventLog Information None 6005 N/A USMV-WEST2 The Event log<br />
service was started.<br />
System Log for Usmv-East2 Host (Surviving Host on Site 2)<br />
6/01/2008 18:05:55 PM ClusSvc Warning Node Mgr 1123 N/A USMV-EAST2 The node lost<br />
communication with cluster node 'USMV-WEST2' on network '<strong>Public</strong>'.<br />
6/01/2008 18:05:55 PM ClusSvc Warning Node Mgr 1123 N/A USMV-EAST2 The node lost<br />
communication with cluster node 'USMV-WEST2' on network 'Private'.<br />
6/01/2008 18:05:55 PM ClusDisk Error None 1209 N/A USMV-EAST2 Cluster service is requesting<br />
a bus reset for device \Device\ClusDisk0.<br />
6/01/2008 18:05:55 PM ClusSvc Warning Node Mgr 1135 N/A USMV-EAST2 Cluster node<br />
USMV-WEST2 was removed from the active server cluster membership. Cluster service may have been<br />
stopped on the node, the node may have failed, or the node may have lost communication with the other<br />
active server cluster nodes.<br />
• If you review the cluster log, you can find messages similar to the following<br />
examples that are based on the testing cases used to generate the management<br />
console images for Figures 9–2 and 9–4:<br />
Cluster Log for Usmv-West2 Host (Failure Host on Site 1)<br />
For this error situation, no entries appear in the cluster log.<br />
Cluster Log for Usmv-East2 Host (Surviving Host on Site 2)<br />
000007e0.00000138::2008/06/01-18:05:55.102 INFO [ClMsg] Received interface unreachable event for<br />
node 1 network 2<br />
000007e0.00000138:: 2008/06/01-18:05:55.102 INFO [ClMsg] Received interface unreachable event for<br />
node 1 network 1<br />
000007e0.00000124:: 2008/06/01-18:05:55.102 WARN [NM] Communication was lost with interface<br />
5019923b-d7a1-4886-825f-207b5938d11e (node: USMV-WEST2, network: <strong>Public</strong>)<br />
000007e0.00000124:: 2008/06/01-18:05:55.102 WARN [NM] Communication was lost with interface<br />
f409cf69-9c30-48f0-8519-ad5dd14c3300 (node: USMV-WEST2, network: Private LAN)<br />
000001c0.00000168:: 2008/06/01-18:05:55.504 ERR Physical Disk : [DiskArb] GetPartInfo<br />
completed, status 170. (Error 170: the requested resource is in use)<br />
000001c0.00000168:: 2008/06/01-18:05:55.504 ERR Physical Disk : [DiskArb] Failed to read<br />
(sector 12), error 170.<br />
000001c0.00000168:: 2008/06/01-18:05:55.504 INFO Physical Disk : [DiskArb] We are about to<br />
break reserve.<br />
000007e0.00000764:: 2008/06/01-18:05:55.079 INFO [NM] We own the quorum resource.<br />
6872 5688–002 9–13
Solving Server Problems<br />
Actions to Resolve the Problem<br />
Perform the following actions to isolate and resolve the problem:<br />
1. Run the Microsoft Product <strong>Support</strong> MPS Report Utility to gather system information.<br />
(See “Using the MPS Report Utility” in Appendix A.)<br />
2. Submit the MPS report to the Unisys <strong>Support</strong> Center.<br />
Server Unable to Connect with SAN<br />
Problem Description<br />
Symptoms<br />
The server is unable to connect to the SAN.<br />
The following symptoms might help you identify this failure:<br />
• The management console display shows a server failure similar to that shown in<br />
Figure 9–5.<br />
Figure 9–5. Management Console Display Showing LA Site Server Down<br />
To display more information about the error, click on More in the right column. A<br />
message similar to the following is displayed:<br />
ERROR: Splitter USMV-WEST2 is down<br />
• Warnings and informational messages similar to those shown in Figure 9–6 appear<br />
on the management console when the server fails. See the table after the figure for<br />
an explanation of the numbered console messages.<br />
9–14 6872 5688–002
Solving Server Problems<br />
Figure 9–6. Management Console Images Showing Messages for Server Unable to<br />
Connect to SAN<br />
Reference<br />
No.<br />
The following table explains the numbered messages in Figure 9–6.<br />
Event<br />
ID<br />
Description<br />
1 5013 The splitter for the server USMV-WEST2 is<br />
down.<br />
2 4008 For each consistency group at the failed site,<br />
the transfer is paused to allow a failover to<br />
the surviving site.<br />
3 4008 For each consistency group, the transfer is<br />
paused at the surviving site to allow a failover.<br />
In the details of this message, the reason for<br />
the pause is given.<br />
4 5002 The splitter for the server USMV-WEST2 is<br />
unable to access the RA.<br />
5 4010 The consistency groups on the original failed<br />
site start data transfer.<br />
6 4086 For each consistency group at the failed site,<br />
data transfer starts and then initialization<br />
starts.<br />
7 4087 For each consistency group at the failed site,<br />
data transfer completes.<br />
E-mail<br />
Immediate<br />
E-mail<br />
Daily<br />
Summary<br />
• The multipathing software (EMC PowerPath Administrator) flashes a red X on the<br />
right side of the toolbar.<br />
6872 5688–002 9–15<br />
X<br />
X<br />
X<br />
X<br />
X<br />
X<br />
X
Solving Server Problems<br />
• The PowerPath Administrator Console reports failures similar to those shown in<br />
Figure 9–7.<br />
Figure 9–7. PowerPath Administrator Console Showing Failures<br />
• If you review the server system event log, you can find error messages similar to the<br />
following examples that are based on the testing cases used to generate the<br />
previous management console images.<br />
Type : warning<br />
Source : Ftdisk<br />
EventID : 57<br />
Description : The system failed to flush data to the transaction log. Corruption may occur.<br />
Type : error<br />
Source : Emcpbase<br />
EventID : 100<br />
Description : Path Bus x Tgt y LUN z to APMxxxx is dead<br />
The event 100 will appear numerous times for each bus, target and LUN.<br />
Actions to Resolve the Problem<br />
Perform the following actions to isolate and resolve the problem:<br />
1. At the server, run a tool such as the PowerPath Administrator that might aid in<br />
diagnosing the problem.<br />
2. Log in to the storage software and determine whether problems are reported. If so,<br />
use the information for that software to correct the problems.<br />
Something might have happened to the volume, or the zoning configuration on the<br />
switch might have been changed. Also, a connection issue could exist such as a<br />
fabric switch or storage cable failure.<br />
9–16 6872 5688–002
Solving Server Problems<br />
3. If the problem is not limited to one server, run the Installation Manager Fibre<br />
Channel diagnostics. Appendix C explains how to run the Installation Manager<br />
diagnostics and provides information about the various diagnostic capabilities.<br />
4. If the problem still appears at the host, an adapter with multiple ports might have<br />
failed. Replace the Fibre Channel adapter in the host if the storage, zoning, and<br />
cabling appear correct. Ensure that the storage and zoning are corrected to use the<br />
new WWN as necessary. (See “Server HBA Failure” for resolution actions.)<br />
Server HBA Failure<br />
Problem Description<br />
Symptoms<br />
One HBA in the server failed on a host that has multiple paths to storage.<br />
The following symptoms might help you identify this failure:<br />
• The multipathing software (such as EMC PowerPath Administrator) flashes a red X<br />
on the right side of the toolbar.<br />
• The PowerPath Administrator console reports failures similar to those shown in<br />
Figure 9–8.<br />
Figure 9–8. PowerPath Administrator Console Showing Adapter Failure<br />
6872 5688–002 9–17
Solving Server Problems<br />
• If you review the server system event log, you can find error messages similar to the<br />
following example:<br />
Actions to Resolve<br />
Type : error<br />
Source : Emcpbase<br />
EventID : 100<br />
Description:<br />
Path Bus x Tgt y LUN z to APMxxxx is dead<br />
The event 100 will appear numerous times for each target and LUN.<br />
To replace an HBA in the server, perform the following steps:<br />
1. Run Emulex HBAnywhere and record the WWNs in use by the server.<br />
2. Shut down the server.<br />
3. Replace the failed HBA and then boot the server.<br />
4. Run Emulex HBAnywhere and record the new WWN.<br />
5. Using the SAN switch management modify the zoning as needed to replace the<br />
failed WWN with new WWN.<br />
6. If manual discovery was used for the storage, update the configuration to use the<br />
new WWN.<br />
Infrastructure (NTP) Server Failure<br />
Problem Description<br />
Symptoms<br />
The replication environment is not affected by an NTP server failure. Timestamps of log<br />
entries are affected.<br />
The following symptoms might help you identify the failure:<br />
• When comparing log entries of a failover, the host application log and the<br />
management console entries are not synchronized.<br />
• You are unable to run the synchronization diagnostics as described in the Unisys<br />
<strong>SafeGuard</strong> <strong>Solutions</strong> Replication Appliance Installation <strong>Guide</strong>.<br />
Actions to Resolve the Problem<br />
To resolve an NTP server failure, perform the following steps:<br />
1. Temporarily change the cluster mode for a data consistency group to MSCS<br />
manual (for a group replicating from the source site to the target site).<br />
2. Perform a move-group operation on a cluster group that contains a Unisys <strong>SafeGuard</strong><br />
Control resource to a node at the target site.<br />
3. View the management console log for event 1009 as shown in Figure 9–9.<br />
9–18 6872 5688–002
6872 5688–002<br />
4. View the host aapplication<br />
event log for event 1115, as follows:<br />
Event Type :<br />
Event Source :<br />
Event Category :<br />
Event ID :<br />
Date :<br />
Time :<br />
User :<br />
Computer<br />
Description:<br />
:<br />
Online resource fai<br />
Group is not a MSC<br />
Action: Verify throu<br />
Or if doing manual<br />
Figure 9–9. Event 1009 Display<br />
Warning<br />
30mControl<br />
None<br />
1115<br />
9/10/2006<br />
12:09:04 PM<br />
N/A<br />
USMV-EAST2<br />
Resource name: Daata1<br />
RA CLI command: UCLI -ssh -l plugin -pw **** -superbatch 172.16.7.60 initiate_ _failover group=Data1<br />
active_site=East cluster_owner=USMV-EAST2<br />
5. Compare the timestamps.<br />
If the time betwween<br />
the timestamps is not within a couple of minut tes, the host and<br />
RAs are not synnchronized.<br />
6. Use the Installaation<br />
Manager site connectivity IP diagnostic by perf forming the<br />
following stepss.<br />
(For more information, see Appendix C.)<br />
a. Log in to ann<br />
RA as user boxmgmt with the password boxmg gmt.<br />
b. On the Maain<br />
Menu, type 3 (Diagnostics) and press Enter.<br />
Solving Server S Problems<br />
led.<br />
CS auto-data group (5).<br />
ugh the Management Console that the Global cluster mode is set t to MSCS auto-data.<br />
recovery, ensure an image has been selected.<br />
c. On the Diaagnostics<br />
menu, type 1 (IP diagnostics) and press Enter.<br />
9–19
Solving Server Problems<br />
d. On the IP Diagnostics menu, type 1 (Site connectivity tests) and press Enter.<br />
e. When asked to select a target for the tests, type 5 (Other host) and press<br />
Enter.<br />
f. Enter the IP address for the NTP server that you want to test.<br />
Note: In step e, you must specify 5 (Other host) and 4 (NTP Server). This<br />
choice is because site 2 does not specify an NTP server in the configuration, and<br />
the test will fail if you use 4 (NTP Server).<br />
7. If the NTP server fails, check that the NTP service on the NTP server is functioning<br />
correctly.<br />
8. Use the Installation Manager port diagnostics IP diagnostic to ensure that no ports<br />
are blocked. (For more information about running port diagnostics, see Appendix C.)<br />
9. Check that the NTP server specified for the host is the same NTP server specified<br />
for the RAs at site 1. (If you want to view the RA configuration settings, use the<br />
Installation Manager Setup View capability. For information about that capability,<br />
refer to the Unisys <strong>SafeGuard</strong> <strong>Solutions</strong> Replication Appliance Installation <strong>Guide</strong>.)<br />
10. Repeat steps 1 through 5 choosing a group that will move a group from the target<br />
site to the source site.<br />
Server Failure (Hardware or Software) in a<br />
Geographic Replication Environment<br />
Problem Description<br />
When a server goes down in a geographic replication environment, the circumstances<br />
and Windows event log messages are similar to those for the server failure in a<br />
geographic clustered environment. That is, the five subset scenarios previously<br />
presented apply as far as the event log messages and actions to resolve are concerned.<br />
The primary difference is that the main symptom of the server failure in this environment<br />
is that the user applications fail.<br />
Refer to the previous five subset scenarios for more details.<br />
9–20 6872 5688–002
Section 10<br />
Solving Performance Problems<br />
This section lists symptoms that usually indicate performance problems. Table 10–1 lists<br />
symptoms and possible problems indicated by the symptom. The problems and their<br />
solutions are described in this section. This section also includes a general discussion of<br />
high-load event. The graphics, behaviors, and examples in this section are similar to what<br />
you observe with your system but might differ in some details.<br />
The management console provides graphs that you can use to evaluate performance.<br />
For more information, see the Unisys <strong>SafeGuard</strong> <strong>Solutions</strong> Replication Appliance<br />
Administrator’s <strong>Guide</strong>.<br />
In addition to the symptoms listed, you might receive e-mail messages or SNMP traps<br />
for the possible problems. Also, messages similar to e-mail notifications are displayed on<br />
the management console. If you do not see the messages, they might have already<br />
dropped off the display. Review the management console logs for messages that have<br />
dropped off the display.<br />
Table 10–1. Possible Performance Problems with Symptoms<br />
Symptom Possible Problem<br />
The initialization progression indicator (%)<br />
in the management interface progresses<br />
significantly slower than expected.<br />
Initialization completes after a significantly<br />
longer period of time than expected.<br />
The event log indicates that the disk<br />
manager has reported high load conditions<br />
for a specific consistency group or groups.<br />
A consistency group or groups start to<br />
initialize. This initialization can occur once<br />
or multiple times, depending on the<br />
circumstances.<br />
Slow initialization<br />
High-load (disk manager)<br />
6872 5688–002 10–1
Solving Performance Problems<br />
Table 10–1. Possible Performance Problems with Symptoms<br />
Symptom Possible Problem<br />
The event log indicates that the distributor<br />
has reported high load conditions for a<br />
specific consistency group or groups.<br />
A consistency group or groups start to<br />
initialize. This initialization can occur once<br />
or multiple times, depending on the<br />
circumstances.<br />
Applications are offline for a lengthy period<br />
during changes in the replication direction.<br />
Slow Initialization<br />
Problem Description<br />
Symptoms<br />
High load (distributor)<br />
Failover time lengthens<br />
Initialization of a consistency group or groups takes longer than expected.<br />
Progression of initialization is reported through the management console in percentages.<br />
You might notice that the percentage for a group has not progressed in a long time or<br />
progresses at a slow rate. This progression might or might not be normal depending on<br />
several factors.<br />
For some groups, it might be natural to take a long time to advance to the next<br />
percentage. One percent of 10 TB is much larger than one percent of 100 GB; therefore,<br />
larger groups would take longer to advance in initialization.<br />
The following symptoms might help you identify this failure:<br />
• The initialization progression indicator (%) in the management interface progresses<br />
significantly slower than expected.<br />
• Initialization completes after a significantly longer period of time than expected.<br />
10–2 6872 5688–002
Actions to Resolve the Problem<br />
Perform the following actions to isolate and resolve the problem:<br />
Solving Performance Problems<br />
• Verify the bandwidth of the connection between sites using the Installation Manager<br />
network diagnostic tools to test the WAN speed while there is no traffic over the<br />
WAN. Appendix C explains how to run these diagnostics.<br />
• Use the Installation Manager Fibre Channel diagnostic tools or customer<br />
storage/SAN diagnostic tools to test the performance of the source and target<br />
storage LUNs to ensure that all storage LUNs are capable of handling the observed<br />
load. Appendix C explains how to run the Installation Manager diagnostics.<br />
If storage performance on either site is poor, the replication system could be limited<br />
in its ability to read from the replication volumes on the source site or to write to the<br />
journal volume on the remote site. Poor storage performance reduces the maximum<br />
speed at which the RAs can initialize.<br />
• Verify that no bandwidth limitation exists on the relevant group or groups properties.<br />
• Use the event log to verify that no other events occurred during initialization—for<br />
example, high load conditions, WAN disconnections, or storage disconnections—that<br />
could have caused the initialization to restart.<br />
• Diagnosis of these types of problems is usually specific to the environment. Collect<br />
RA logs and submit a service request to Unisys support if the cause of slow<br />
initialization cannot be determined through the actions given above. See Appendix A<br />
for information about collecting logs.<br />
General Description of High-Load Event<br />
A high-load event reports that, at the time of the event, a bottleneck existed in the<br />
replication process. To keep track of the changes being made during the bottleneck, the<br />
replication goes into “marking mode” and records the location of all changed data on the<br />
source replication volume until the activity causing the bottleneck has subsided.<br />
The three possible points at which a bottleneck might occur are<br />
• Between the host and RA—Disk Manager<br />
Of the three points for a bottleneck to occur, this point is the rarest to cause the<br />
bottleneck. This type of bottleneck occurs when the host is writing to the storage<br />
device faster than the RA can handle.<br />
• The WAN<br />
This type of bottleneck occurs when the host is writing to the storage device faster<br />
than the RAs can replicate over the available bandwidth. For example, a host is<br />
writing to the storage device during peak hours at a rate of 60 Mbps. The RAs<br />
compress this data down to 15 Mbps. The available bandwidth is 10 Mbps. Clearly,<br />
during peak hours, the bandwidth is not sufficient to support the write rate;<br />
therefore, during peak hours, a number of high load events occur.<br />
6872 5688–002 10–3
Solving Performance Problems<br />
• The remote storage—Distributor<br />
This type of bottleneck occurs when the storage device containing the journal<br />
volume on the remote site cannot keep up with the speed that the data is being<br />
replicated to the remote site. To avoid this situation, configure the journal volume on<br />
the fastest possible LUNs using the fastest RAID and the most disk spindles. Also,<br />
use multiple journal volumes located on different physical disks in the storage array<br />
or use separate disk subsystems in the same consistency group so that the<br />
replication can perform an additional layer of striping. The replication stripes the<br />
images across these multiple journal volumes.<br />
High-Load (Disk Manager) Condition<br />
Problem Description<br />
Symptoms<br />
The disk manager reports high-load conditions.<br />
The following symptoms might help you identify this failure:<br />
• The event log indicates that the disk manager reported high load conditions for a<br />
specific consistency group or groups (event ID 4019).<br />
• A consistency group or groups start to initialize. This initialization can occur once or<br />
multiple times, depending on the circumstances.<br />
Actions to Resolve<br />
Perform the following actions to isolate and resolve the problem:<br />
• Use the Installation Manager network diagnostic tools to test the WAN speed while<br />
there is no traffic over the WAN. Appendix C explains how to run these diagnostics.<br />
• Analyze the performance data for the consistency groups on the RA to ensure that<br />
the incoming write rate is not outside the limits of the available bandwidth or the<br />
capabilities of the RA.<br />
• High loads can occur naturally during traffic peaks or during periods of high external<br />
activity on the WAN. If the high load events occur infrequently or can be associated<br />
with a temporal peak, consider this behavior as normal.<br />
• Diagnosis of these types of problems is usually specific to the environment. Collect<br />
RA logs and submit a service request to the Unisys <strong>Support</strong> Center if the high load<br />
events occur frequently and you cannot resolve the problem through the actions<br />
previously listed. See Appendix A for information about collecting logs.<br />
10–4 6872 5688–002
High-Load (Distributor) Condition<br />
Problem Description<br />
Symptoms<br />
The distributor reports high-load conditions.<br />
The following symptoms might help you identify this failure:<br />
Solving Performance Problems<br />
• The event log indicates that the distributor reported high load conditions for a<br />
specific consistency group or groups.<br />
• A consistency group or groups start to initialize. This initialization can occur once or<br />
multiple times, depending on the circumstances.<br />
Actions to Resolve the Problem<br />
Perform the following actions to isolate and resolve the problem:<br />
• Use the Installation Manager Fibre Channel diagnostic tools or customer storage or<br />
SAN diagnostic tools to test the performance of the target-site storage LUNs.<br />
Appendix C explains how to run the Installation Manager diagnostics.<br />
• Analyze the WAN performance of the consistency group or groups, and ensure that<br />
loads are not too high for handling by the target-site storage devices.<br />
• High loads can occur naturally during traffic peaks. If the high-load events occur<br />
infrequently or can be associated with a temporal peak, consider this behavior as<br />
normal.<br />
• Diagnosis of these types of problems is usually specific to the environment. Collect<br />
RA logs and submit a service request to the Unisys <strong>Support</strong> Center if the high-load<br />
events occur frequently and you cannot resolve the problem through the actions<br />
previously listed. See Appendix A for information about collecting logs.<br />
Failover Time Lengthens<br />
Problem Description<br />
Symptoms<br />
Prior to changing the replication direction, the images must be distributed to the targetsite<br />
volumes. The applications are not available during this process.<br />
Applications are offline for a lengthy period during changes to the replication direction.<br />
Actions to Resolve the Problem<br />
Refer to the Unisys <strong>SafeGuard</strong> <strong>Solutions</strong> Planning and Installation <strong>Guide</strong> for more<br />
information on pending timeouts.<br />
6872 5688–002 10–5
Solving Performance Problems<br />
10–6 6872 5688–002
Appendix A<br />
Collecting and Using Logs<br />
Whenever a failure occurs, you might need to collect and analyze log information to<br />
assist in diagnosing the problem. This appendix presents information on the following<br />
tasks:<br />
• Collecting RA logs<br />
• Collecting server (host) logs<br />
• Analyzing RA log collection files<br />
• Analyzing server (host) logs<br />
• Analyzing intelligent fabric switch logs<br />
Collecting RA Logs<br />
When you collect logs from one RA, you automatically collect logs from all other RAs and<br />
from the servers. Occasionally, you might need to collect logs from the servers (hosts)<br />
manually. Refer to “Collecting Server (Host) Logs” later in this appendix for more<br />
information.<br />
Each time you complete a log collection, the files are saved for a maximum of 7 days.<br />
The length of time the files remain available depends on the size and number of log<br />
collections performed. To ensure that you have the log files that you need, download and<br />
store the files locally. Log files with dates older than 7 days from the current date are<br />
automatically removed.<br />
To collect the RA logs, perform the following procedures:<br />
1. Set the Automatic Host Info Collection option<br />
2. Test FTP connectivity<br />
3. Determine when the failure occurred<br />
4. Convert local time to GMT or UTC<br />
5. Collect logs from the RA<br />
6872 5688–002 A–1
Collecting and Using Logs<br />
Setting the Automatic Host Info Collection Option<br />
Perform the following steps to set the Automatic Host Info Collection Option:<br />
1. On the System menu select System Settings in the Management Console.<br />
The System Settings page appears.<br />
2. Choose the Automatic Host Info Collection option from Miscellaneous<br />
Settings.<br />
For more information, refer to the Unisys <strong>SafeGuard</strong> <strong>Solutions</strong> Planning and Installation<br />
<strong>Guide</strong>.<br />
Testing FTP Connectivity<br />
To test FTP connectivity, perform the following steps on the management PC. The<br />
information you provide depends on whether logs are being collected locally on an FTP<br />
server or sent to an FTP server at the Unisys Product <strong>Support</strong> site.<br />
1. To initiate an FTP session, type FTP at a command prompt. Press Enter.<br />
2. Type Open. Press Enter.<br />
3. At the To prompt, enter one of the following and then press Enter:<br />
• ftp.ess.unisys.com (the Unisys FTP address)<br />
• Your local FTP server IP address<br />
4. At the User prompt, enter one of the following and then press Enter:<br />
• FTP, if you specified the Unisys FTP address<br />
• Your local FTP user account<br />
5. At the Password prompt, enter one of the following and then press Enter:<br />
• Your Internet e-mail address if you specified the Unisys FTP address<br />
• Your local FTP account password<br />
6. Type bye and press Enter to log out.<br />
Determining When the Failure Occurred<br />
Perform the following steps to determine when the failure occurred:<br />
Note: If you cannot determine the failure time from the RA logs, use the Windows<br />
event logs on each server (host) to determine the failure time.<br />
1. Select the Logs tab from the navigation pane in the Management Console.<br />
A list of events is displayed. Each event entry includes a Level column that indicates<br />
the severity of the event.<br />
If necessary, click View and select Detailed.<br />
2. Scan the Description column to find the event for which you want to gather logs.<br />
A–2 6872 5688–002
Collecting and Using Logs<br />
3. Select the event and click the Filter Log option.<br />
The Filter Log dialog box appears.<br />
4. Select any option from scope list (normal, detailed, advanced) and level list (info,<br />
warning, error).<br />
5. Write down the timestamp that is displayed for the event. You must convert the<br />
time displayed to GMT—also called Coordinated Universal Time (UTC).<br />
This timestamp is used to calculate the start date and end time for log collection.<br />
6. Click OK.<br />
Converting Local Time to GMT or UTC<br />
Perform the following steps to convert the time in which the failure occurred to GMT or<br />
UTC. You need the time zone you wrote down in the preceding procedure.<br />
1. In Windows Control Panel, click Date and Time.<br />
2. Select the Time Zone tab.<br />
3. Look in the list for the GMT or UTC offset value corresponding to the time zone you<br />
wrote down in the procedure “Determining When the Failure Occurred.” The offset<br />
value represents the number of hours that the time zone is ahead or behind GMT or<br />
UTC.<br />
4. Add or subtract the GMT or UTC offset value from the local time.<br />
Example<br />
If the time zone is Pacific Standard Time, the GMT or UTC offset value is –8:00. If the<br />
time in which the failure occurred is 13:30, then GMT or UTC is 21:30.<br />
Collecting RA Logs<br />
Use the Installation Manager, which is a centralized collection tool, to collect logs from<br />
all accessible RAs, servers (hosts), and intelligent fabric switches.<br />
Before you begin log collection, determine the failure date and time. If you have SANTap<br />
switches and want to collect information from the switches, know the user name and<br />
password to access the switches.<br />
To collect RA logs, perform the following steps:<br />
1. Start the SSH client by performing the steps in “Using the SSH Client” in<br />
Appendix C. Use the site management IP address; log in with boxmgmt as the login<br />
user name and boxmgmt as the password.<br />
2. On the Main Menu, type 3 (Diagnostics) and press Enter.<br />
3. On the Diagnostics menu, type 4 (Collect system info) and press Enter.<br />
6872 5688–002 A–3
Collecting and Using Logs<br />
4. When prompted, provide the following information. Press Enter after each item.<br />
(The program displays date and time in GMT/UTC format.)<br />
a. Start date: This date specifies how far back the log collection is to start. Use<br />
the MM/DD/YYYY format. Do not accept the default date; the date should be at<br />
least 2 days earlier than the current date. This date must include the date and<br />
time in which the failure occurred.<br />
b. Start time: This time specifies the GMT/UTC in which log collection is to start.<br />
Use the HH:MM:SS format.<br />
c. End date: This date specifies when log collection is to end. Accept the default<br />
date, which is the current date.<br />
d. End time: This time specifies when log collection is to end. Accept the default<br />
time, which is the current time.<br />
5. Type y to collect information from the other site.<br />
6. Type y or n, and press Enter when asked about sending the results to an FTP<br />
server.<br />
If you choose not to send the results to an FTP server, skip to step 8. The results are<br />
stored at the URL http:///info/. You can access the<br />
collected results by logging in with webdownload as the log-in name and<br />
webdownload as the password. (If your system is set for secure Web<br />
transactions, then the URL begins with https://.)<br />
If you choose to send the results to an FTP server and the procedure has been<br />
performed previously, all of the information is filled in. If not, provide the following<br />
information for the management PC:<br />
a. When prompted for the FTP server, type one of the following and then press<br />
Enter.<br />
• The IP address of the Unisys Product <strong>Support</strong> FTP server, 192.61.61.78, or<br />
ftp.ess.unisys.com<br />
• The IP address of your local FTP server<br />
b. Press Enter to accept the default FTP port number, or type a different port<br />
number if you are using a management PC with a nonstandard port number.<br />
c. Type the local user account when prompted for the FTP user name. Press<br />
Enter.<br />
d. If you are using the Unisys FTP server, type incoming as the folder name of<br />
the FTP location in which to store the collected information. Press Enter.<br />
If you are using a local FTP server, press Enter for none.<br />
A–4 6872 5688–002
Collecting and Using Logs<br />
e. Type a name for the file on the FTP server in the following format:<br />
.tar<br />
Example: 19557111_Company1.tar<br />
Note: If no name is specified, the name will be similar to the following:<br />
sysInfo--hosts-from-)-.tar<br />
Example: sysInfo-l1-l2-r1-r2-hosts-from-l1-r1-2006.08.17.16.28.31.tar<br />
f. Type the appropriate password. Press Enter.<br />
7. On the Collection mode menu, type 3 (RAs and hosts) and press Enter.<br />
Note: The “hosts” part of this menu selection (RAs and hosts) collects intelligent<br />
fabric switch information.<br />
8. Type y or n, and press Enter when asked if you have SANTap switches from which<br />
you want to collect information.<br />
If you do not have SANTap switches, go to step 10.<br />
If you want to collect information from SANTap switches, enter the user name and<br />
password to access the switch when prompted.<br />
9. Type n if prompted on whether to perform a full collection, unless otherwise<br />
instructed by a Unisys service representative.<br />
10. Type n when prompted to limit collection time.<br />
The collection program checks connectivity to all RAs and then displays a list of the<br />
available hosts and SANTap switches from which to collect information.<br />
11. Type All and press Enter.<br />
The Installation Manager shows the collection progress and reports that it<br />
successfully collected data. This collection might take several minutes. Once the<br />
data collection completes, a message indicates that the collected information is<br />
available at the FTP server you specified or at the URL (http:///info/ or https:///info/).<br />
12. Press Enter.<br />
13. On the Diagnostics dialog box, type Q and press Enter to exit the program.<br />
14. Type Y when prompted to quit and press Enter.<br />
Verifying the Results<br />
• Ensure that “Failed for hosts” has no entries. The success or failure entries might be<br />
listed multiple times.<br />
For the collection to be successful for hosts and intelligent fabric switches, all entries<br />
must indicate “Succeeded for hosts.”<br />
For the collection to be successful for RAs, all entries must indicate “Collected data<br />
from .”<br />
6872 5688–002 A–5
Collecting and Using Logs<br />
• There is a 20-minute timeout on the collection process for RAs. There is a 15-minute<br />
timeout on the collection process for each host.<br />
• If the collection from the remote site failed because of a WAN failure, run the<br />
process locally at the remote site.<br />
• If the connection with an RA is lost while the collection is in process, no<br />
information is collected. Run the process again.<br />
• If you transferred the data by FTP to a management PC, you can transfer the<br />
collected data to the Unisys Product <strong>Support</strong> Web site at your convenience.<br />
Otherwise, if you are connected to the Unisys Product <strong>Support</strong> Web site, the<br />
collected data is transferred automatically to this Web site.<br />
• If you use the Web interface, you must download the collected data to the<br />
management PC and then transfer the collected data to the Unisys Product <strong>Support</strong><br />
Web site at your convenience.<br />
Collecting Server (Host) Logs<br />
Use the following utilities to collect log information:<br />
• MPS Report Utility<br />
• Host information collector (HIC) utility<br />
Using the MPS Report Utility<br />
Use the Microsoft MPS Report Utility to collect detailed information about the current<br />
host configuration. You must have administrative rights to run this utility.<br />
Unisys uses the cluster (MSCS) version of this utility if that version is available from<br />
Microsoft. This version of the utility enables you to gather cluster information as well as<br />
the standard Microsoft information. If the server is not clustered, the utility still runs, but<br />
the cluster files in the output are blank.<br />
The average time for the utility to complete is between 5 and 20 minutes. It might take<br />
longer if you run the utility during peak production time.<br />
You can download the MPS Report Utility from the Unisys FTP server at the following<br />
location: (You are not prompted for a username or password.)<br />
ftp://ftp.ntsupport.unisys.com/outbound/MPS-REPORTS/<br />
Select one of the following directories, depending on your operating system<br />
environment:<br />
• 32-BIT<br />
• 64-BIT-IA64<br />
• 64-BIT-X64 (not a clustered version)<br />
A–6 6872 5688–002
Collecting and Using Logs<br />
Output Files<br />
Individual output files are created by using the following directory structure. Depending<br />
on the MPS Report version, the file name and directory name might vary.<br />
Directory: %systemroot%\MPSReports , typically C:\windows\MPSReports<br />
File name: %COMPUTERNAME%_MPSReports_xxx.CAB<br />
Using the Host Information Collector (HIC) Utility<br />
Note: You can skip this procedure unless directed to complete it by the Unisys support<br />
personnel. Host log collection occurs automatically if the Automatic Host Info Collection<br />
option on the System menu of the management console is selected.<br />
Perform the following steps to collect log information from the hosts:<br />
1. At the command prompt on the host, change to the appropriate directory depending<br />
on your system:<br />
• For 32-bit and Intel Itanium 2-based systems, enter<br />
cd C:\Program Files\KDriver\hic<br />
• For x64 systems, enter<br />
cd C:\Program Files (x86)\KDriver\hic<br />
2. Type one of the following commands:<br />
• host_info_collector –n (noninteractive mode)<br />
• host_info_collector (interactive mode)<br />
If you choose the interactive mode command, provide the following site information:<br />
• Account ID: Click System Settings on the System menu of the<br />
Management Console, and click on Account Settings in the System<br />
Settings dialog box to access this information.<br />
• Account name: The name of the customer who purchased the Unisys <strong>SafeGuard</strong><br />
30m solution.<br />
• Contact name: The name of the person responsible for collecting logs.<br />
• Contact mail: The mail account of the person responsible for collecting logs.<br />
Note: Ignore messages about utilities that are not installed.<br />
6872 5688–002 A–7
Collecting and Using Logs<br />
Verifying the Results<br />
• The process generates a single tar file of the host logs in the gzip format.<br />
• On 32-bit and Intel Itanium 2-based systems, the host logs are located in the<br />
following directory:<br />
C:\Program Files\KDriver\hic<br />
• On 64-bit systems, the host logs are located on the following directory:<br />
C:\Program Files (x86)\KDriver\hic<br />
Analyzing RA Log Collection Files<br />
If you use the Installation Manager RA log collection process, logs are collected from all<br />
accessible RAs and servers (hosts). When the tar file is extracted using this process, the<br />
information is gathered in a file on the FTP server that is, by default, named with the<br />
following format:<br />
sysInfo--hosts-from-)-.tar<br />
The is in the format yyyy.mm.dd.hh.mm.ss.<br />
An example of such a file name is<br />
sysInfo-lr-l2-r1-r2-hosts-from-l1-r1-2007.09.07.17.37.39.tar<br />
For each RA on which logs were collected, directories are created with the following<br />
formats:<br />
extracted..<br />
HLR--<br />
The is in the format yyyy.mm.dd.hh.mm.ss.<br />
An example of the name of an extracted directory for the RA is<br />
extracted.l1.2007.06.05.19.25.03 (from left RA 1 on June 5, 2007 at 19:25:03)<br />
In the RA identifier information, the l1 to 8 and r1 to 8 designations refer to RAs at the<br />
left and right sites. That is, site 1 RAs 1 through 8 are designated with l, and site 2 RAs 1<br />
through 8 are designated with r.<br />
If the RA collected a host log, the host information is collected in a directory beginning<br />
with HLR. For example, HLR-r1-2007.06.05.19.25.03 is the directory from right (site 2)<br />
RA1 on June 5, 2007 at 19:25:03.<br />
This directory is described in “Host Log Extraction Directory” later in this appendix.<br />
A–8 6872 5688–002
RA Log Extraction Directory<br />
Collecting and Using Logs<br />
Several files and directories are placed inside the extracted directory for the RA:<br />
• parameters: file containing the time frame for the collection<br />
• CLI: file that containing the output collected by running CLI commands<br />
• aiw: file containing the internal log of the system, which is used by third-level<br />
support<br />
• aiq: file containing the internal log of the system, which is used by third-level support<br />
• cm_cli: internal file used by third-level support<br />
• init_hl: internal file used by third-level support<br />
• kbox_status: file used by third-level support<br />
• unfinished_init_hl: file used by third-level support<br />
• log: file containing the log of the collection process itself (used only by third-level<br />
support)<br />
• summary: file containing a summary of the main events from the internal logs of the<br />
system, which is used by third-level support<br />
• files: directory containing the original directories from the appliance<br />
• processes: directory containing some internal information from the system such as<br />
network configuration, processes state, and so forth<br />
• tmp: temporary directory<br />
Of the preceding items, you should understand the time frame of the collection from the<br />
parameters file and focus on the CLI file information. To determine whether the logs<br />
were correctly collected, check that the time frame of the collection correlates with the<br />
time of the issue, and verify that logs were collected from all nodes.<br />
Root-Level Files<br />
Several files are saved at the root level of the extracted directory: parameters file, CLI<br />
file, aiw file, aiq file, cm_cli file, init_hl file, kbox_status file, unfinished_init_hl file, log file,<br />
and summary file.<br />
Parameters File<br />
The parameters file contains the parameters given to the log gathering tool. Those<br />
parameters set the time frame for the log collection and are reflected in the parameters<br />
file. The format for the date is yyyy/mm/dd.<br />
The following example illustrates the contents of a parameters file:<br />
only_connectivity=”0”<br />
min=”2007/08/03 16:25:02”<br />
max=”2007/08/04 19:25:02”<br />
withCores=”1”<br />
6872 5688–002 A–9
Collecting and Using Logs<br />
The value ”0” for only_connectivity in the parameters file is a standard value for logs.<br />
The value “1” for withCores means that core logs (long) were collected for the time<br />
displayed.<br />
CLI File<br />
The CLI file contains the output from executing various CLI commands. The commands<br />
issued to produce the information are saved to the CLI file in the tmp directory. Usually<br />
executing CLI commands in the process of collecting logs produces volumes of output.<br />
The types of information that are contained in the CLI file are as follows:<br />
• Account settings and license<br />
• Alert settings<br />
• Box states<br />
• Consistency groups, settings, and state<br />
• Consistency group statistics<br />
• Site name<br />
• Splitters<br />
• Management console logs for the period collected<br />
• Global accumulators (used by third-level support)<br />
• Various settings and system statistics<br />
• Save_settings command output<br />
• Splitters settings and state<br />
• Volumes settings and state<br />
• Available images<br />
The commands used to collect the output are listed in the runCLIFile, described later in<br />
this appendix.<br />
Log File<br />
This file contains a report of the log collection that executed. It shows the start and stop<br />
time for the log.<br />
If there is a problem running CLI commands, information appears at the end of the file<br />
similar to the following:<br />
2007/06/05 19:25:40: info: running CLI commands<br />
2007/06/05 19:25:40: info: retrieving site name<br />
2007/06/05 19:25:40: info: site name is "Tunguska"<br />
2007/06/05 19:25:40: info: retrieving groups<br />
2007/06/05 19:25:40: error: while running CLI commands: when running CLI<br />
get_groups, RC=2<br />
2007/06/05 19:25:40: error: while running CLI commands: errors retrieving<br />
groups. skipping CLI commands.<br />
A–10 6872 5688–002
Collecting and Using Logs<br />
Summary File<br />
The summary file is at the root of the extracted directory and contains a summary of the<br />
main events from the internal logs of the system. The format of this file is used by thirdlevel<br />
support. However, you might find a summary of the errors helpful in some cases.<br />
Files Directory<br />
The files directory contains several subdirectories and files in those directories. The<br />
directories are etc, home, collector, rreasons, proc, and var.<br />
etc Directory<br />
This directory contains the rc.local file, which is used by third-level support.<br />
home Directory<br />
The home directory contains the kos directory containing several files and these<br />
subdirectories: cli, connectivity_tool, control, customer_monitor, hlr, install_logs, kbox,<br />
management, monitor, mpi__perf, old_config, replication, rmi, snmp, and utils.<br />
The home directory also contains the collector and rreasons directories.<br />
collector Directory<br />
This directory contains the connectivity_tool subdirectory, which lists results from<br />
connectivity tests to configured IP addresses on the local host loopback and the specific<br />
ports on the IP addresses that require testing for various protocols.<br />
rreasons Directory<br />
This directory contains the rreasons.log file, which lists the reasons for any reboots in<br />
the specified time frame.<br />
This file is used by third-level support but can be helpful in reviewing the reboot reasons,<br />
as shown in the following sample file:<br />
***************************************************************************<br />
***************************************************************************<br />
***************************************************************************<br />
***************************************************************************<br />
***************************************************************************<br />
=== LogLT STARTED HERE - 2007/07/05 22:40:40 ===<br />
***************************************************************************<br />
***************************************************************************<br />
***************************************************************************<br />
***************************************************************************<br />
***************************************************************************<br />
Couldn't open 'logger.ini' file, so assuming default 'all' with level<br />
DEBUG2007/07/05 22:40:40.834 - #2 - 1421 - RebootReasons:<br />
getRebootReasons2007/07/05 22:40:40.834 - #2 - 1421 - rreasons: Reboot Log:<br />
[Mon Apr 16 20:33:00 2007] : kernel watchdog 0 expired (time=66714<br />
lease=1390 last_tick=65233) 0=(1390,65233) 1=(30000,63214) 2=(1400,65233)<br />
6872 5688–002 A–11
Collecting and Using Logs<br />
Note: In the example, the “kernel watchdog 0 expired” message indicates a typical<br />
reboot that was not a result of an error.<br />
Other Directories<br />
The proc, and var directories are also contained within the files directory and are used by<br />
third-level support.<br />
processes Directory<br />
The processes directory contains the InfoCollect, sbin, usr, home, and bin directories and<br />
several subdirectories.<br />
InfoCollect Directory<br />
Under the InfoCollect directory, the SanDiag.sh file contains the SAN diagnostic logs.<br />
The ConnectivityTest.sh file contains connection information. Connection errors in this<br />
log do not indicate an error in the configuration or function.<br />
sbin Directory<br />
This directory contains files with information pertaining to networking.<br />
• Ifconfig file: Lists configuration information as shown in the following example:<br />
eth0 Link encap:Ethernet HWaddr 00:14:22:11.DD:1B<br />
inet addr:10.10.21.51 Bcast:10.255.255.255 Mask:255.255.255.0<br />
UP BROADCAST RUNNING MULTICAST MTU:1500 Metric:1<br />
RX packets:286265797 errors:0 dropped:0 overruns:0 frame:0<br />
TX packets:228318046 errors:0 dropped:0 overruns:0 carrier:0<br />
collisions:0 txqueuelen:100<br />
RX bytes:1377792659 (1.2 GiB) TX bytes:2189256742 (2.0 GiB)<br />
Base address:0xecc0 Memory:fe6e0000-fe700000<br />
eth1 Link encap:Ethernet HWaddr 00:14:22:11.DD:1C<br />
inet addr:172.16.21.51 Bcast:172.16.255.255 Mask:255.255.0.0<br />
UP BROADCAST RUNNING MULTICAST MTU:1500 Metric:1<br />
RX packets:13341097 errors:0 dropped:0 overruns:0 frame:0<br />
TX packets:12365085 errors:0 dropped:0 overruns:0 carrier:0<br />
collisions:0 txqueuelen:5000<br />
RX bytes:4156827090 (3.8 GiB) TX bytes:4192345752 (3.9 GiB)<br />
Base address:0xdcc0 Memory:fe4e0000-fe500000<br />
eth1 Link encap:Ethernet HWaddr 00:14:22:11.DD:1C<br />
inet addr:172.16.21.51 Bcast:172.16.255.255 Mask:255.255.0.0<br />
UP BROADCAST RUNNING MULTICAST MTU:1500 Metric:1<br />
Base address:0xdcc0 Memory:fe4e0000-fe500000<br />
lo Link encap:Local Loopback<br />
inet addr:127.0.0.1 Mask:255.0.0.0<br />
UP LOOPBACK RUNNING MTU:16436 Metric:1<br />
RX packets:11289452 errors:0 dropped:0 overruns:0 frame:0<br />
TX packets:11289452 errors:0 dropped:0 overruns:0 carrier:0<br />
collisions:0 txqueuelen:0<br />
RX bytes:3269809825 (3.0 GiB) TX bytes:3269809825 (3.0 GiB)<br />
A–12 6872 5688–002
Collecting and Using Logs<br />
• route file: Lists other pieces of routing information, as shown in the following<br />
example:<br />
Kernel IP routing table<br />
Destination Gateway Genmask Flags Metric Ref Use Iface<br />
10.10.21.0 * 255.255.255.0 U 0 0 0 eth0<br />
172.16.0.0 * 255.255.0.0 U 0 0 0 eth1<br />
usr Directory<br />
The usr directory contains two subdirectories: bin and sbin.<br />
The bin subdirectory contains the kps.pl file.<br />
The following is an example of the kps.pl file for an attached RA:<br />
Uptime: 7:25pm up 18:24, 1 user, load average: 5.99, 4.38, 2.05<br />
Processes:<br />
control_process - UP<br />
control_loop.tcsh - UP<br />
replication - UP<br />
mgmt_loop.tcsh - UP<br />
management_server - UP<br />
cli - down<br />
rmi_loop.tcsh - UP<br />
rmi - UP<br />
monitor_loop.tcsh - UP<br />
load_monitor.pl - UP<br />
runall - down<br />
hlr_kbox - UP<br />
rcm_run_loop.tcsh - UP<br />
customer_monitor.pl - UP<br />
Modules:<br />
st - UP<br />
sll - UP<br />
var_link - UP<br />
kaio_mod-2.4.32-k22 - UP<br />
The following is an example of the kps.pl file for a detached RA:<br />
Uptime: 7:25pm up 18:24, 1 user, load average: 5.99, 4.38, 2.05<br />
Processes:<br />
control_process - down<br />
control_loop.tcsh - down<br />
replication - down<br />
mgmt_loop.tcsh - down<br />
management_server - down<br />
cli - down<br />
rmi_loop.tcsh - down<br />
rmi - down<br />
monitor_loop.tcsh - down<br />
load_monitor.pl - down<br />
runall - down<br />
hlr_kbox - UP<br />
rcm_run_loop.tcsh - down<br />
customer_monitor.pl - down<br />
Modules:<br />
st - UP<br />
6872 5688–002 A–13
Collecting and Using Logs<br />
sll - UP<br />
var_link - UP<br />
kaio_mod-2.4.32-k22 - UP<br />
The sbin subdirectory contains the biosdecode and dmidecode files. The biosdecode file<br />
provides hardware-specific RA BIOS information and the pointers to locations where this<br />
information is stored. The dmidecode file provides handle and other information for<br />
components capable of passing this information to a Desktop Management Interface<br />
(DMI) agent.<br />
home Directory<br />
The home directory contains the kos subdirectory, which contains other subdirectories<br />
that yield the get_users_lock_state.tcsh file. This file contains all the users on the RA.<br />
bin Directory<br />
The bin directory contains the df-h and lspci files. The df-h file contains directory size and<br />
disk size usage statistics for the RA hard disk drive. The lspci file contains PCI bridge bus<br />
numbers, revisions, and OEM identification strings for inbuilt devices in the RA.<br />
tmp Directory<br />
The tmp directory contains the runCLI file listing the commands that generated the CLI<br />
file. It also contains the getGroups file, which is a temporary file to gather the list of<br />
consistency groups.<br />
runCLI File<br />
The following is an example of the runCLI file saved in the tmp directory that shows the<br />
CLI commands executed:<br />
• get_logs from= to=–n<br />
The time and date are specified as day, month, year as follows:<br />
get_logs from="22:03 03/08/2007" to="17:03 04/08/2007” –n<br />
• config_io_throttling –n<br />
• config_multipath_monitoring –n<br />
• get_account_settings –n<br />
• get_alert_settings –n<br />
• get_box_states –n<br />
• get_global_policy –n<br />
• get_groups –n<br />
• get_groups_sets –n<br />
• get_group_settings –n<br />
• get_group_state –n<br />
• get_group_statistics –n<br />
A–14 6872 5688–002
Collecting and Using Logs<br />
• get_id_names –n<br />
• get_initiator_bindings –n<br />
• get_pairs –n<br />
• get_raw_stats –n<br />
• get_snmp_settings –n<br />
• get_syslog_settings –n<br />
• get_system_status –n<br />
• get_system_settings –n<br />
• get_system_statistics –n<br />
• get_tweak_params –n<br />
• get_version –n<br />
• get_virtual_targets –n<br />
• save_settings –n<br />
• get_splitter_settings site=""<br />
• get_splitter_states site=""<br />
• get_san_splitter_view site=""<br />
• get_san_volumes site=""<br />
• get_santap_view site=""<br />
• get_volume_settings site=""<br />
• get_volume_state site=""<br />
• get_images group="" (This command is repeated for each group.)<br />
getGroups File<br />
This internal file is used to generate the runCLI file.<br />
Host Log Extraction Directory<br />
When the RA collects a host log, the host information is collected in a directory named<br />
with the HLR-- format.<br />
Such a directory contains a tar.gz file for servers with a name similar in format to the<br />
following:<br />
HLR-r1_USMVEAST2_1157647546524147.tar.gz<br />
When you extract a tar.gz file, you can choose to decompress the ZIP file<br />
(to_transfer.tar) to a temp folder and open it, or you can choose to extract the files to a<br />
directory.<br />
When the file is for intelligent fabric switches, the file name does not have the .gz<br />
extension.<br />
6872 5688–002 A–15
Collecting and Using Logs<br />
Analyzing Server (Host) Logs<br />
The output file from host collection is named<br />
Unisys_host_info___.tar.gz<br />
This file contains a folder named “collected_items,” which contains the following files<br />
and directories:<br />
• Cluster_log: a folder containing the cluster.log file generated by MSCS<br />
• Hic_logs: a folder containing logs used by third-level support<br />
• Host_logs: a folder containing logs used by third-level support<br />
• Msinfo32: information from the Msinfo32.exe file<br />
• Registry.dump: the registry dump for this server<br />
• Tweak: the internal RA parameters on this server<br />
• Watchdog log: log created by the KDriverWatchDog service<br />
• Commands: a file containing output from commands executed on this server,<br />
including<br />
− A view of the LUNs recognized by this server<br />
− Some internal RA structures<br />
− Output from the dumpcfg.exe file<br />
− Windows event logs for system, security, and applications<br />
Analyzing Intelligent Fabric Switch Logs<br />
The output file from collecting information from intelligent fabric switches is named with<br />
the following format:<br />
HLR-__identifier.tar<br />
The following name is an example of this format:<br />
HLR-l1_CISCO_232c000dec1a7a02.tar<br />
Once you extract the .tar file, some files are listed with formats similar to the following:<br />
CVT_.tar_AT__M3_tech<br />
CVT_.tar_AT__M3_isapi_tech<br />
CVT_.tar_AT__M3_santap_tech<br />
A–16 6872 5688–002
Appendix B<br />
Running Replication Appliance (RA)<br />
Diagnostics<br />
This appendix<br />
• Explains how to clear the system event log (SEL.)<br />
• Describes how to run hardware diagnostics for the RA.<br />
• Lists the LCD status messages shown on the RA.<br />
Clearing the System Event Log (SEL)<br />
Before you run the RA diagnostics, you need to clear the SEL to prevent errors from<br />
being generated during the diagnostics run.<br />
1. Insert the bootable Replication Appliance (RA) Diagnostic CD-ROM in the CD/DVD<br />
drive.<br />
2. Press Ctrl+Alt+Delete to reboot the RA.<br />
The RA displays the following event log menu.<br />
3. Select Show all system event log records using the arrow keys, then press<br />
Enter.<br />
This action results in an SEL summary and indicates whether the SEL contains<br />
errors. If there are errors, an error description is given.<br />
Note: You cannot scroll up or down in this screen.<br />
A clear SEL without errors has “IPMI SEL contains 1 records” displayed in the<br />
summary. Anything greater than one record indicates that errors are present.<br />
6872 5688–002 B–1
Running Replication Appliance (RA) Diagnostics<br />
Note: The preceding step did not clear the SEL; ignore the statement “Log area<br />
Reset/Cleared.”<br />
4. Press any key to return to the main boot menu.<br />
5. Select Clear System Event Log using the arrow keys, and press Enter to ensure<br />
that the SEL is cleared of all error entries.<br />
Note: Depending on whether there are error entries, this clearing action could take<br />
up to 1 minute to complete.<br />
6. Press any key again to return to the main boot menu.<br />
7. Select Show all system event log records using the arrow keys and press<br />
Enter. Confirm that “IPMI SEL contains 1 records” is shown.<br />
8. Press any key to return to the main boot menu.<br />
Note: If you accidentally press Escape and leave the main boot menu, a Diag<br />
prompt is displayed. Type menu to return to the main boot menu.<br />
Running Hardware Diagnostics<br />
Running the hardware diagnostics for the RA includes completing the Custom Test and<br />
Express Test diagnostics.<br />
Follow these steps to run the hardware diagnostics for the RA:<br />
1. At the main boot menu, use the arrow keys to select Run Diags …; then press<br />
Enter.<br />
2. On the Customer Diagnostic Menu, press 2 to select Run ddgui graphicsbased<br />
diagnostic.<br />
The system diagnostic files begin loading and a message is displayed giving<br />
information about the software and showing “initializing…”<br />
Once the diagnostics are loaded and ready to be executed, the Main Menu is<br />
displayed.<br />
B–2 6872 5688–002
Custom Test<br />
Running Replication Appliance (RA) Diagnostics<br />
1. On the Main Menu, select Custom Test using the arrow keys; then press Enter.<br />
The Custom Test dialog box is displayed as follows:<br />
2. Expand the PCI Devices folder to view the PCI devices installed in the system<br />
including those devices that are “on-board.”<br />
3. Select the PCI Devices folder; then press Enter.<br />
This action causes each PCI device to be interrogated in turn and a message is<br />
displayed for each one. Verify that the correct number of QLogic adapters is shown.<br />
4. Press OK after each message is displayed until all PCI devices have been recognized<br />
and passed. The message “All tests passed.” is displayed.<br />
Note: If any devices fail this test, investigate and rectify the problem; then clear the<br />
SEL as explained in “Clearing the System Event Log (SEL).”<br />
5. Close the Custom Test dialog box and return to the Main Menu.<br />
6872 5688–002 B–3
Running Replication Appliance (RA) Diagnostics<br />
Express Test<br />
1. On the Main Menu, select Express Test using the arrow keys; then press Enter.<br />
A warning is displayed advising that media must be installed on all drives or else<br />
some tests might fail.<br />
2. If a diskette drive is installed in the system, insert a blank, formatted diskette and<br />
then click OK to start the test. If no diskette drive is installed, just click OK.<br />
During testing, a status screen is displayed.<br />
If the diagnostic test run is successful, the message “All tests passed.” appears.<br />
Notes:<br />
• During the video portion of the testing, the screen typically flickers and goes<br />
blank.<br />
• If any errors occur, investigate and resolve the problem, and then rerun the<br />
diagnostic tests. Before you rerun the tests, be sure to clear the SEL as<br />
explained in “Clearing the System Event Log (SEL).”<br />
3. Click OK to exit the diagnostic tests.<br />
The Main Menu is then displayed.<br />
4. Select Exit using the arrow keys; then press Enter.<br />
The following message is displayed:<br />
Displaying the end of test result.log ddgui.txt. Strike a Key when ready.<br />
5. Press any key to display the diagnostic test summary screen.<br />
6. Verify that no errors are listed. Scroll up and down to see the different portions of<br />
the output.<br />
Note: If any errors are listed, investigate and resolve the problem; then rerun the<br />
diagnostic tests. Before you rerun the tests, be sure to clear the SEL as explained in<br />
“Clearing the System Event Log (SEL).”<br />
7. Press Escape to return to the original Customer Diagnostic Menu.<br />
8. Press 4 to quit and return to the main boot menu.<br />
9. Select Exit; then press Enter.<br />
10. Remove all media from the diskette and CD/DVD drives.<br />
LCD Status Messages<br />
The LCDs on the RA signify status messages. Table B–1 lists the LCD status messages<br />
that can occur and the probable cause for each message. The LCD messages refer to<br />
events recorded in the SEL.<br />
Note: For information about corrective actions for the messages listed in Table B–1,<br />
refer to the documentation supplied with the system.<br />
B–4 6872 5688–002
Running Replication Appliance (RA) Diagnostics<br />
Table B–1. LCD Status Messages<br />
Line 1 Message Line 2 Message Cause<br />
SYSTEM ID SYSTEM NAME The system ID is a unique name, 5 characters or less,<br />
defined by the user.<br />
The system name is a unique name, 16 characters or<br />
less, defined by the user.<br />
The system ID and name display under the following<br />
conditions:<br />
• The system is powered on.<br />
• The power is off and active POST errors are<br />
displayed.<br />
E000 OVRFLW CHECK LOG LCD overflow message. A maximum of three error<br />
messages can display sequentially on the LCD. The<br />
fourth message is displayed as the standard overflow<br />
message.<br />
E0119 TEMP AMBIENT Ambient system temperature is out of the acceptable<br />
range.<br />
E0119 TEMP BP The backplane board is out of the acceptable temperature<br />
range.<br />
E0119 TEMP CPU n The specified microprocessor is out of the acceptable<br />
temperature range.<br />
E0119 TEMP SYSTEM The system board is out of the acceptable temperature<br />
range.<br />
E0212 VOLT 3.3 The system power supply is out of the acceptable voltage<br />
range; the power supply is faulty or improperly installed.<br />
E0212 VOLT 5 The system power supply is out of the acceptable voltage<br />
range; the power supply is faulty or improperly installed.<br />
E0212 VOLT 12 The system power supply is out of the acceptable voltage<br />
range; the power supply is faulty or improperly installed.<br />
E0212 VOLT BATT Faulty battery; faulty system board.<br />
E0212 VOLT BP 12 The backplane board is out of the acceptable voltage<br />
range.<br />
E0212 VOLT BP 3.3 The backplane board is out of the acceptable voltage<br />
range.<br />
E0212 VOLT BP 5 The backplane board is out of the acceptable voltage<br />
range.<br />
E0212 VOLT CPU VRM The microprocessor voltage regulator module (VRM)<br />
voltage is out of the acceptable range. The<br />
microprocessor VRM is faulty or improperly installed. The<br />
system board is faulty.<br />
E0212 VOLT NIC 1.8V Integrated NIC voltage is out of the acceptable range; the<br />
power supply is faulty or improperly installed. The system<br />
board is faulty.<br />
6872 5688–002 B–5
Running Replication Appliance (RA) Diagnostics<br />
Table B–1. LCD Status Messages<br />
Line 1 Message Line 2 Message Cause<br />
E0212 VOLT NIC 2.5V Integrated NIC voltage is out of the acceptable range. The<br />
power supply is faulty or improperly installed. The system<br />
board is faulty.<br />
E0212 VOLT PLANAR REG The system board is out of the acceptable voltage range.<br />
The system board is faulty.<br />
E0276 CPU VRM n The specified microprocessor VRM is faulty,<br />
unsupported, improperly installed, or missing.<br />
E0276 MISMATCH VRM n The specified microprocessor VRM is faulty,<br />
unsupported, improperly installed, or missing.<br />
E0280 MISSING VRM n The specified microprocessor VRM is faulty,<br />
unsupported, improperly installed, or missing.<br />
E0319 PCI OVER CURRENT The expansion cord is faulty or improperly installed.<br />
E0412 RPM FAN n The specified cooling fan is faulty, improperly installed, or<br />
missing.<br />
E0780 MISSING CPU 1 Microprocessor is not installed in socket PROC_1.<br />
E07F0 CPU IERR The microprocessor is faulty or improperly installed.<br />
E07F1 TEMP CPU n HOT The specified microprocessor is out of the acceptable<br />
temperature range and has halted operation.<br />
E07F4 POST CACHE The microprocessor is faulty or improperly installed.<br />
E07F4 POST CPU REG The microprocessor is faulty or improperly installed.<br />
E07FA TEMP CPU n THERM The specified microprocessor is out of the acceptable<br />
temperature range and is operating at a reduced speed or<br />
frequency.<br />
E0876 POWER PS n No power is available from the specified power supply.<br />
The specified power supply is improperly installed or<br />
faulty.<br />
E0880 INSUFFICIENT PS Insufficient power is being supplied to the system. The<br />
power supplies are improperly installed, faulty, or<br />
missing.<br />
E0CB2 MEM SPARE ROW The correctable errors threshold was met in a memory<br />
bank; the errors were remapped to the spare row.<br />
E0CF1 MBE DIMM Bank n The memory modules installed in the specified bank are<br />
not the same type and size. The memory module or<br />
modules are faulty.<br />
E0CF1 POST MEM 64K A parity failure occurred in the first 64 KB of main<br />
memory.<br />
E0CF1 POST NO MEMORY The main-memory refresh verification failed.<br />
E0CF5 LGO DISABLE SBE Multiple single-bit errors occurred on a single memory<br />
module.<br />
B–6 6872 5688–002
Running Replication Appliance (RA) Diagnostics<br />
Table B–1. LCD Status Messages<br />
Line 1 Message Line 2 Message Cause<br />
E0D76 DRIVE FAIL A hard drive or RAID controller is faulty or improperly<br />
installed.<br />
E0F04 POST DMA INIT Direct memory access (DMA) initialization failed. DMA<br />
page register write/read operation failed.<br />
E0F04 POST MEM RFSH The main-memory refresh verification failed.<br />
E0F04 POST SHADOW BIOS-shadowing failed.<br />
E0F04 POST SHD TEST The shutdown test failed.<br />
E0F0B POST ROM CHKSUM The expansion card is faulty or improperly installed.<br />
E0F0C VID MATCH CPU n The specified microprocessor is faulty, unsupported,<br />
improperly installed, or missing.<br />
E10F3 LOG DISABLE BIOS The BIOS disabled logging errors.<br />
E13F2 IO CHANNEL CHECK The expansion card is faulty or improperly installed. The<br />
system board is faulty.<br />
E13F4 PCI PARITY<br />
E13F5 PCI SYSTEM<br />
E13F8 CPU BUS INIT The microprocessor or system board is faulty or<br />
improperly installed.<br />
E13F8 CPU MCKERR Machine check error. The microprocessor or system<br />
board is faulty or improperly installed.<br />
E13F8 HOST TO PCI BUS<br />
E13F8 MEM CONTROLLER A memory module or the system board is faulty or<br />
improperly installed.<br />
E20F1 OS HANG The operating system watchdog timer has timed out.<br />
EFFF1 POST ERROR A BIOS error occurred.<br />
EFFF2 BP ERROR The backplane board is faulty or improperly installed.<br />
6872 5688–002 B–7
Running Replication Appliance (RA) Diagnostics<br />
B–8 6872 5688–002
Appendix C<br />
Running Installation Manager<br />
Diagnostics<br />
To determine the causes of various problems as well as perform numerous procedures,<br />
you must access the Installation Manager functions and diagnostics capabilities.<br />
Using the SSH Client<br />
Throughout the procedures in this guide you might need to use the secure shell (SSH)<br />
client. Perform the following steps whenever you are asked to use the SSH client or to<br />
open a PuTTY session:<br />
1. From Windows Explorer, double-click the PuTTY.exe file.<br />
2. When prompted, enter the applicable IP address.<br />
3. Select SSH for the protocol and keep the default port settings (port 22).<br />
4. Click Open.<br />
5. If prompted by a PuTTY security dialog box, click Yes.<br />
6. When prompted to log in, type the identified user name and then press Enter.<br />
7. When prompted for a password, type the identified password and then press Enter.<br />
Running Diagnostics<br />
When you open the PuTTY session and log in as boxmgmt/boxmgmt, the Main Menu of<br />
Installation Manager is displayed. This menu offers the following six choices: Installation,<br />
Setup, Diagnostics, Cluster Operations, Reboot/Shutdown, and Quit.<br />
For more information about these capabilities, see the Unisys <strong>SafeGuard</strong> <strong>Solutions</strong><br />
Replication Appliance Installation <strong>Guide</strong>.<br />
6872 5688–002 C–1
Running Installation Manager Diagnostics<br />
To access the various diagnostic capabilities of Installation Manager, perform the<br />
following steps:<br />
1. Open a PuTTY session using the IP address of the RA, and log in as<br />
boxmgmt/boxmgmt.<br />
The Main Menu is displayed, as follows:<br />
** Main Menu **<br />
[1] Install<br />
[2] Setup<br />
[3] Diagnostics<br />
[4] Cluster Operations<br />
[5] Reboot / Shutdown<br />
[Q] Quit<br />
2. Type 3 (Diagnostics) and press Enter.<br />
The Diagnostics menu is displayed as follows:<br />
** Diagnostics **<br />
IP Diagnostics<br />
[1] IP diagnostics<br />
[2] Fibre Channel diagnostics<br />
[3] Synchronization diagnostics<br />
[4] Collect system info<br />
[B] Back<br />
[Q] Quit<br />
The four diagnostics capabilities are explained in the following topics.<br />
Use the IP diagnostics when you need to check port connectivity, view IP addresses,<br />
test throughput, and review other related information.<br />
On the Diagnostics menu, type 1 (IP diagnostics) and press Enter to access the IP<br />
Diagnostics menu as shown:<br />
** IP Diagnostics **<br />
[1] Site connectivity tests<br />
[2] View IP details<br />
[3] View routing table<br />
[4] Test throughput<br />
[5] Port diagnostics<br />
[6] System connectivity<br />
[B] Back<br />
[Q] Quit<br />
C–2 6872 5688–002
Site Connectivity Tests<br />
Running Installation Manager Diagnostics<br />
On the IP Diagnostics menu, type 1 (Site connectivity tests) and press Enter to<br />
access the Site connectivity tests menu.<br />
Note: You must apply settings to the RA before you can test options 1 through 4 in the<br />
following list.<br />
The options to test are as follows:<br />
** Select the target to which to test connectivity: **<br />
[1] Gateway<br />
[2] Primary DNS server<br />
[3] Secondary DNS server<br />
[4] NTP Server<br />
[5] Other host<br />
[B] Back<br />
[Q] Quit<br />
Tests for options 1 through 4 return a result of success or failure.<br />
For option 5, you must specify the target IP address that you want to test. The test<br />
returns the relative success of 0 through 100 percent over both the management and<br />
WAN interfaces.<br />
View IP Details<br />
From the IP Diagnostics menu, type 2 (View IP details) and press Enter to run an<br />
ipconfig process. The displayed results of the process are similar to the following:<br />
eth0 Link encap:Ethernet HWaddr 00:0F:1F:6A:03:E7<br />
inet addr:10.10.17.61 Bcast:10.10.17.255 Mask:255.255.255.0<br />
UP BROADCAST RUNNING MULTICAST MTU:1500 Metric:1<br />
RX packets:12751337 errors:0 dropped:0 overruns:0 frame:0<br />
TX packets:13628048 errors:0 dropped:0 overruns:0 carrier:0<br />
collisions:0 txqueuelen:1000<br />
RX bytes:1084700432 (1034.4 Mb) TX bytes:2661155798 (2537.8 Mb)<br />
Base address:0xecc0 Memory:fe6e0000-fe700000<br />
eth1 Link encap:Ethernet HWaddr 00:0F:1F:6A:03:E8<br />
inet addr:172.16.17.61 Bcast:172.16.255.255 Mask:255.255.0.0<br />
UP BROADCAST RUNNING MULTICAST MTU:1500 Metric:1<br />
RX packets:10519453 errors:0 dropped:0 overruns:0 frame:0<br />
TX packets:10244866 errors:0 dropped:0 overruns:0 carrier:0<br />
collisions:0 txqueuelen:5000<br />
RX bytes:2846677622 (2714.8 Mb) TX bytes:2702094827 (2576.9 Mb)<br />
Base address:0xdcc0 Memory:fe4e0000-fe500000<br />
6872 5688–002 C–3
Running Installation Manager Diagnostics<br />
eth1:1 Link encap:Ethernet HWaddr 00:0F:1F:6A:03:E8<br />
inet addr:172.16.17.60 Bcast:172.16.255.255 Mask:255.255.0.0<br />
UP BROADCAST RUNNING MULTICAST MTU:1500 Metric:1<br />
Base address:0xdcc0 Memory:fe4e0000-fe500000<br />
lo Link encap:Local Loopback<br />
inet addr:127.0.0.1 Mask:255.0.0.0<br />
UP LOOPBACK RUNNING MTU:16436 Metric:1<br />
RX packets:3853904 errors:0 dropped:0 overruns:0 frame:0<br />
TX packets:3853904 errors:0 dropped:0 overruns:0 carrier:0<br />
collisions:0 txqueuelen:0<br />
RX bytes:3312865098 (3159.3 Mb) TX bytes:3312865098 (3159.3 Mb)<br />
View Routing Table<br />
On the IP Diagnostics menu, type 3 (View routing table) and press Enter to display<br />
the routing table.<br />
Test Throughput<br />
On the IP Diagnostics menu, type 4 (Test throughput) and press Enter to use iperf to<br />
test throughput to another RA.<br />
Once you select this option, Installation Manager guides you through the following<br />
dialog. The bold text shows sample entries.<br />
Note: The Fibre Channel interface only appears if the Installation Manager Diagnostic<br />
capability was preconfigured to run on Fibre Channel. Then the option appears a [2} in<br />
the menu list.<br />
Enter the IP address to which to test throughput:<br />
>>192.168.1.86<br />
Select the interface from which to test throughput:<br />
** Interface **<br />
[1] Management interface<br />
[2] Fibre Channel Interface<br />
[3] WAN interface<br />
>>3<br />
Enter the desired number of concurrent streams:<br />
>>2<br />
Enter the test duration (seconds):<br />
>>10<br />
C–4 6872 5688–002
Running Installation Manager Diagnostics<br />
If the test is successful, the system responds with a standard iperf output that<br />
resembles the following:<br />
Checking connectivity to 10.10.17.51<br />
Connection to 10.10.17.51 established.<br />
Client Connecting to 10.10.17.51, TCP port 5001<br />
Binding to local address 10.10.17.61<br />
TCP window size: 4.00 MByte (WARNING: requested 2.00 MByte)<br />
[ 6] local 10.10.17.61 port 35222 connected with 10.10.17.51 port 5001<br />
[ 5] local 10.10.17.61 port 35222 connected with 10.10.17.51 port 5001<br />
[ ID] Interval Transfer Bandwidth<br />
[ 5] 0.0-10.6 sec 59.1 Mbytes 46.9 Mbits/sec<br />
[ 6] 0.0-10.6 sec 59.1 Mbytes 46.9 Mbits/sec<br />
[SUM] 0.0-10.6 sec 118 Mbytes 93.9 Mbits/sec<br />
Port Diagnostics<br />
On the IP Diagnostics menu, type 5 (Port diagnostics) and press Enter to check that<br />
none of the ports used by the RAs are blocked (for example, by a firewall). You must test<br />
each RA individually—that is, designate each RA, in turn, to be the server.<br />
Once you select the option, Installation Manager guides you through one of the following<br />
dialogs, depending on whether you designate the RA to be the server or the client. In the<br />
dialogs, sample entries are bold.<br />
For the server, the dialog is as follows:<br />
In which mode do you want to run ports diagnostics?<br />
** **<br />
[1] Server<br />
[2] Client<br />
>>1<br />
Note: Before you select the server designation for the RA, detach the RA that you<br />
intend to specify as the server.<br />
6872 5688–002 C–5
Running Installation Manager Diagnostics<br />
After you specify the RA that you want to test as the server, move to the RA from which<br />
you wish to run the port diagnostics tests. Designate that RA as a client, as noted in the<br />
following dialog:<br />
** **<br />
[1] Server<br />
[2] Client<br />
>>2<br />
Did you already designate another RA to be the server (y/n)<br />
>>y<br />
Enter the IP address to test:<br />
>>10.10.17.51<br />
If the test is successful, the system responds with output that resembles the following:<br />
Port No. TCP Connection<br />
5030 OK<br />
5040 OK<br />
4401 OK<br />
1099 OK<br />
5060 Blocked<br />
4405 OK<br />
5001 OK<br />
5010 OK<br />
5020 OK<br />
Correct the problem on any port that returns a Blocked response.<br />
System Connectivity<br />
Use the system connectivity options to test connections and generate reports on<br />
connections between RAs anywhere in the system. You can perform the tests during<br />
installation and during normal operation. The tests performed to verify connections are<br />
as follows:<br />
• Ping<br />
• TCP (to ports and IP addresses, to the specific processes of the RA, and using SSH)<br />
• UDP (general and to RA processes)<br />
• RA internal protocols<br />
C–6 6872 5688–002
Running Installation Manager Diagnostics<br />
On the IP Diagnostics menu, type 6 (System connectivity) and press Enter to access<br />
the System Connectivity menu as follows:<br />
** System Connectivity **<br />
[1] System connectivity test<br />
[2] Advanced connectivity test<br />
[3] Show all results from last connectivity check<br />
[B] Back<br />
[Q] Quit<br />
When you select System connectivity test and Full mesh network check, the<br />
test reports errors in communications from any RA to any other RA in the system.<br />
When you select System connectivity test and Check from local RA to all<br />
other boxes, the test reports errors from the local RA to any other RA in the system.<br />
When you select Advanced connectivity test, the test reports on the connection<br />
from an IP address that you specified on the local appliance to an IP address and port<br />
that you specified on an RA anywhere in the system. Use this option to diagnose a<br />
problem specific to a local IP address or port.<br />
When you select Show all results from last connectivity check, the test reports<br />
all results from the previous tests—not only the errors, but also the tests that completed<br />
successfully.<br />
6872 5688–002 C–7
Running Installation Manager Diagnostics<br />
You might receive one of the messages shown in Table C–1 from the connectivity test<br />
tool.<br />
Table C–1. Messages from the Connectivity Testing Tool<br />
Message Meaning<br />
Machine is down. There is no communication with the RA.<br />
Perform the following steps to determine<br />
the problem:<br />
• Verify that the firewall permits pinging<br />
the RA, that is, using a CMP echo.<br />
• Check that the RA is connected and<br />
operating.<br />
• Check that the required ports are<br />
open. (Refer to Section 7, “Solving<br />
Networking Problems,” for tables with<br />
the port information.)<br />
is down. The host connection exists but the RA is<br />
not responding.<br />
Perform the following steps to determine<br />
the problem:<br />
• Check that the required ports are<br />
open. (Refer to Section 7, “Solving<br />
Networking Problems” for tables with<br />
the port information.)<br />
• Verify that the RA is attached to an RA<br />
cluster.<br />
Connection to link: protocol:<br />
FAILED.<br />
Link ()<br />
FAILED.<br />
No connection is available to the host<br />
through the protocol.<br />
The connection that was checked has<br />
failed.<br />
All OK. The connection is working.<br />
To discover which port is involved in the error or failure, run the test again and select<br />
Show all results from last connectivity check. The port on which each failure<br />
occurred is shown.<br />
C–8 6872 5688–002
Fibre Channel Diagnostics<br />
Running Installation Manager Diagnostics<br />
Use the Fibre Channel diagnostics when you need to check SAN connections, review<br />
port settings, see details of the Fibre Channel, determine Fibre Channel targets and<br />
LUNs, and perform I/O operations to a LUN.<br />
On the Diagnostics menu, type 2 (Fibre Channel diagnostics) and press Enter to<br />
access the Fibre Channel Diagnostics menu as follows:<br />
** Fibre Channel Diagnostics **<br />
[1] Run SAN diagnostics<br />
[2] View Fibre Channel details<br />
[3] Detect Fibre Channel targets<br />
[4] Detect Fibre Channel LUNs<br />
[5] Detect Fibre Channel SCSI-3 reserved LUNs<br />
[6] Perform I/O to a LUN<br />
[B] Back<br />
[Q] Quit<br />
Run SAN Diagnostics<br />
On the Fibre Channel Diagnostics menu, type 1 (Run SAN diagnostics) and press<br />
Enter to run the SAN diagnostics.<br />
When you select this option, the system conducts a series of automatic tests to identify<br />
the most common problems encountered in the configuration of SAN environments,<br />
such as the following:<br />
• Storage inaccessible within a site<br />
• Delays with writes or reads to disk<br />
• Disk not accessible in the network<br />
• Configuration issues<br />
Once the tests complete, a message is displayed confirming the successful completion<br />
of SAN diagnostics, or a report is displayed that provides additional details.<br />
Results similar to the following are displayed for a successful diagnostics run of port 0:<br />
0 errors:<br />
0 warnings:<br />
Total=0<br />
6872 5688–002 C–9
Running Installation Manager Diagnostics<br />
Sample results follow for a diagnostics run that returns errors:<br />
ConfigB_Site2 Box2>>1<br />
>>Running SAN diagnostics. This may take a few moments...<br />
results of SAN diagnostics are<br />
3 errors:<br />
1. Found device with no guid : wwn=5006016b1060090d lun=0 port=0 vendor=DGC<br />
product=LUNZ<br />
2. Found device with no guid : wwn=500601631060090d lun=0 port=0 vendor=DGC<br />
product=LUNZ<br />
3. Found device with no guid : wwn=5006016b1060090d lun=0 port=1 vendor=DGC<br />
product=LUNZ<br />
9 warnings:<br />
1. device wwn=500601631060090d lun=8<br />
guid=(storage=CLARION,buffer=Vector(96,6,1,96,155,195,14,0,125,87,93,152,230,2<br />
29,218,17)) found in port 1 and not in port 0<br />
2. device wwn=500601631060090d lun=7<br />
guid=(storage=CLARION,buffer=Vector(96,6,1,96,155,195,14,0,127,87,93,152,230,2<br />
29,218,17)) found in port 1 and not in port 0<br />
3. device wwn=500601631060090d lun=6<br />
guid=(storage=CLARION,buffer=Vector(96,6,1,96,155,195,14,0,129,87,93,152,230,2<br />
29,218,17)) found in port 1 and not in port 0<br />
4. device wwn=500601631060090d lun=5<br />
guid=(storage=CLARION,buffer=Vector(96,6,1,96,155,195,14,0,131,87,93,152,230,2<br />
29,218,17)) found in port 1 and not in port 0<br />
5. device wwn=500601631060090d lun=4<br />
guid=(storage=CLARION,buffer=Vector(96,6,1,96,155,195,14,0,133,87,93,152,230,2<br />
29,218,17)) found in port 1 and not in port 0<br />
6. device wwn=500601631060090d lun=3<br />
guid=(storage=CLARION,buffer=Vector(96,6,1,96,155,195,14,0,135,87,93,152,230,2<br />
29,218,17)) found in port 1 and not in port 0<br />
7. device wwn=500601631060090d lun=2<br />
guid=(storage=CLARION,buffer=Vector(96,6,1,96,155,195,14,0,137,87,93,152,230,2<br />
29,218,17)) found in port 1 and not in port 0<br />
C–10 6872 5688–002
Running Installation Manager Diagnostics<br />
8. device wwn=500601631060090d lun=1<br />
guid=(storage=CLARION,buffer=Vector(96,6,1,96,155,195,14,0,139,87,93,152,230,2<br />
29,218,17)) found in port 1 and not in port 0<br />
9. device wwn=500601631060090d lun=0<br />
guid=(storage=CLARION,buffer=Vector(96,6,1,96,155,195,14,0,141,87,93,152,230,2<br />
29,218,17)) found in port 1 and not in port 0<br />
Total=12<br />
View the Fibre Channel Details<br />
On the Fibre Channel Diagnostics menu, type 2 (View Fibre Channel details) and<br />
press Enter to show the current Fibre Channel details.<br />
The operation mode is identified automatically according to the SAN switch<br />
configuration. Usually the RA is configured for the point-to-point mode unless the SAN<br />
switch is hard-wired to port L.<br />
Note: You can use the View Fibre Channel details capability to obtain information about<br />
WWNs that is needed for zoning.<br />
You can check the status for the following on the Fibre Channel Diagnostics menu:<br />
• Speed<br />
• Operating node<br />
• Node WWN<br />
• Changes made<br />
• Connection issues<br />
• Additions of new HBAs<br />
Sample results showing Fibre Channel details for port 0 and port 1 follow:<br />
ConfigB_Site2 Box2>>2<br />
>> Port 0<br />
-----------------------------------wwn<br />
= 5001248200875c81<br />
node_wwn = 5001248200875c80<br />
port id = 0x20100<br />
operating mode = point to point<br />
speed = 2 GB<br />
Port 1<br />
-----------------------------------wwn<br />
= 5001248201a75c81<br />
node_wwn = 5001248201a75c80<br />
port id = 0x20500<br />
operating mode = point to point<br />
speed = 2 GB<br />
6872 5688–002 C–11
Running Installation Manager Diagnostics<br />
If all cables are disconnected, the operating mode results for all ports are disconnected.<br />
If only one cable is disconnected, then the operating mode for the affected port is<br />
disconnected, as shown in the following sample results:<br />
ConfigB_Site2 Box2>>2<br />
>> Port 0<br />
------------------------------------<br />
wwn = 5001248200875c81<br />
node_wwn = 5001248200875c80<br />
port id = 0x20100<br />
operating mode = point to point<br />
speed = 2 GB<br />
Port 1<br />
------------------------------------<br />
wwn = 5001248201a75c81<br />
node_wwn = 5001248201a75c80<br />
port id = 0x0<br />
operating mode = disconnected<br />
speed = 2 GB<br />
Detect Fibre Channel Targets<br />
On the Fibre Channel Diagnostics menu, type 3 (Detect Fibre Channel targets) and<br />
press Enter to see a list of the targets that are accessible to the RA through ports A<br />
and B.<br />
Some of the reasons to use this capability are as follows:<br />
• Zoning issues<br />
• Failure to detect a host<br />
• SAN connection issues<br />
• Need for WWN or storage details of each RA<br />
The following sample results provide port WWN, node WWN, and port information:<br />
ConfigB_Site2 Box2>>3<br />
>><br />
Port 0<br />
Port WWN Node WWN Port ID<br />
----------------------------------------------------<br />
1) 0x500601631060090d 0x500601609060090d 0x20000<br />
2) 0x5006016b1060090d 0x500601609060090d 0x20400<br />
C–12 6872 5688–002
Port 1<br />
Port WWN Node WWN Port ID<br />
----------------------------------------------------<br />
1) 0x500601631060090d 0x500601609060090d 0x20000<br />
2) 0x5006016b1060090d 0x500601609060090d 0x20400<br />
Detect Fibre Channel LUNs<br />
Running Installation Manager Diagnostics<br />
On the Fibre Channel Diagnostics menu, type 64(Detect Fibre Channel LUNs) and<br />
press Enter to see a list of all volumes on the SAN that are visible to the RA.<br />
Using this capability can detect<br />
• Issues with volume access<br />
• LUN repository details<br />
• Additions of volumes<br />
In the following sample results that show the types of information returned, the<br />
information wraps around:<br />
ConfigB_Site2 Box2>>4<br />
>>This operation may take a few minutes...<br />
Size Vendor Product Serial Number Vendor Specific UID<br />
Port WWN LUN CGs Site ID<br />
================================================================================<br />
1. 4.00GB DGC RAID 5 APM00031800182 LUN ID: 127<br />
CLARION: 60,06,01,60,9b,c3,0e,00,8d,57,5d,98,e6,e5,da,11:0<br />
1 500601631060090d 0 2<br />
2. 4.00GB DGC RAID 5 APM00031800182 LUN ID: 125<br />
CLARION: 60,06,01,60,9b,c3,0e,00,8b,57,5d,98,e6,e5,da,11:0<br />
1 500601631060090d 1 2<br />
3. 4.00GB DGC RAID 5 APM00031800182 LUN ID: 123<br />
CLARION: 60,06,01,60,9b,c3,0e,00,89,57,5d,98,e6,e5,da,11:0<br />
1 500601631060090d 2 2<br />
4. 4.00GB DGC RAID 5 APM00031800182 LUN ID: 121<br />
CLARION: 60,06,01,60,9b,c3,0e,00,87,57,5d,98,e6,e5,da,11:0<br />
1 500601631060090d 3 2<br />
6872 5688–002 C–13
Running Installation Manager Diagnostics<br />
5. 4.00GB DGC RAID 5 APM00031800182 LUN ID: 119<br />
CLARION: 60,06,01,60,9b,c3,0e,00,85,57,5d,98,e6,e5,da,11:0<br />
1 500601631060090d 4 2<br />
6. 4.00GB DGC RAID 5 APM00031800182 LUN ID: 117<br />
CLARION: 60,06,01,60,9b,c3,0e,00,83,57,5d,98,e6,e5,da,11:0<br />
1 500601631060090d 5 2<br />
7. 1.00GB DGC RAID 5 APM00031800182 LUN ID: 115<br />
CLARION: 60,06,01,60,9b,c3,0e,00,81,57,5d,98,e6,e5,da,11:0<br />
1 500601631060090d 6 0<br />
8. 4.00GB DGC RAID 5 APM00031800182 LUN ID: 113<br />
CLARION: 60,06,01,60,9b,c3,0e,00,7f,57,5d,98,e6,e5,da,11:0<br />
1 500601631060090d 7 2<br />
9. 62.00GB DGC RAID 5 APM00031800182 LUN ID: 111<br />
CLARION: 60,06,01,60,9b,c3,0e,00,7d,57,5d,98,e6,e5,da,11:0<br />
1 500601631060090d 8 40<br />
10. N/A DGC LUNZ APM00031800182 -<br />
N/A<br />
0 500601631060090d 0 N/A<br />
11. N/A DGC LUNZ APM00031800182 -<br />
N/A<br />
0 5006016b1060090d 0 N/A<br />
12. N/A DGC LUNZ APM00031800182 -<br />
N/A<br />
1 5006016b1060090d 0 N/A<br />
C–14 6872 5688–002
Detect Fibre Channel Scsi3 Reserved LUNs<br />
Running Installation Manager Diagnostics<br />
On the Fibre Channel Diagnostics menu, type 5 (Detect Fibre Channel Scsi3<br />
reserved LUNs) and press Enter to list all LUNs that have SCSI-3 reservations. The<br />
information returned includes the WWN, LUN number, port number, and reservation<br />
type.<br />
Perform I/O to a LUN<br />
On the Fibre Channel Diagnostics menu, type 6 (Perform I/O to a LUN) and press<br />
Enter to initiate a dialog that guides you through performing an I/O operation to a LUN.<br />
Note: The write operation removes any data that you might have. Use the write<br />
operation only when you are installing at the site.<br />
The following example for a read operation shows sample responses in bold type.<br />
SYDNEY Box1>>6<br />
>>This operation may take a few minutes...<br />
Size Vendor Product Serial Number Vendor Specific UID<br />
Port WWN Ctrl LUN<br />
============================================================================<br />
1. 9.00GB DGC RAID 5 APM00024400378 LUN 29 Sydney<br />
JouCLARION: 60,06,01,60,db,e3,0e,00,d1,3a,e0,54,cd,b6,db,11:0<br />
0 500601601060009a SP-A 0<br />
0 500601681060009a SP-B 0<br />
1 500601601060009a SP-A 0<br />
1 500601681060009a SP-B 0<br />
.<br />
.<br />
.<br />
10. 10.00GB DGC RAID 5 APM00024400378 LUN 36 Sydney<br />
JouCLARION: 60,06,01,60,db,e3,0e,00,da,3a,e0,54,cd,b6,db,11:0<br />
0 500601601060009a SP-A 10<br />
0 500601681060009a SP-B 10<br />
1 500601601060009a SP-A 10<br />
1 500601681060009a SP-B 10<br />
Select: 6<br />
Select operation to perform:<br />
** Operation To Perform **<br />
[1] Read<br />
[2] Write<br />
6872 5688–002 C–15
Running Installation Manager Diagnostics<br />
SYDNEY Box1>>1<br />
>><br />
Enter the desired transaction size:<br />
SYDNEY Box1>>10485760<br />
Do you want to read the whole LUN? (y/n)<br />
>>y<br />
1 buffers in<br />
1 buffers out<br />
total time : 0.395567 seconds<br />
2.65082e+07 bytes/sec<br />
25.2802 MB/sec<br />
2.52802 IO/sec<br />
CRC = 4126172682534249172<br />
I/O succeeded.<br />
The following example for a write operation shows sample responses in bold type.<br />
SYDNEY Box1>>6<br />
>>This operation may take a few minutes...<br />
Size Vendor Product Serial Number Vendor Specific UID<br />
Port WWN Ctrl LUN<br />
============================================================================<br />
1. 9.00GB DGC RAID 5 APM00024400378 LUN 29 Sydney<br />
JouCLARION: 60,06,01,60,db,e3,0e,00,d1,3a,e0,54,cd,b6,db,11:0<br />
0 500601601060009a SP-A 0<br />
0 500601681060009a SP-B 0<br />
1 500601601060009a SP-A 0<br />
1 500601681060009a SP-B 0<br />
.<br />
.<br />
.<br />
10. 10.00GB DGC RAID 5 APM00024400378 LUN 36 Sydney<br />
JouCLARION: 60,06,01,60,db,e3,0e,00,da,3a,e0,54,cd,b6,db,11:0<br />
0 500601601060009a SP-A 10<br />
0 500601681060009a SP-B 10<br />
1 500601601060009a SP-A 10<br />
1 500601681060009a SP-B 10<br />
============================================================================<br />
Select: 10<br />
Select operation to perform:<br />
** Operation To Perform **<br />
[1] Read<br />
[2] Write<br />
SYDNEY Box1>>2<br />
>><br />
Enter the desired transaction size:<br />
SYDNEY Box1>>10485760<br />
C–16 6872 5688–002
Enter the number of transactions to perform:<br />
SYDNEY Box1>>100<br />
Enter the number of blocks to skip:<br />
SYDNEY Box1>>16<br />
100 buffers in<br />
100 buffers out<br />
total time : 40.7502 seconds<br />
2.57318e+07 bytes/sec<br />
24.5398 MB/sec<br />
2.45398 IO/sec<br />
CRC = 3829111553924479115<br />
I/O succeeded.<br />
Synchronization Diagnostics<br />
Running Installation Manager Diagnostics<br />
On the Diagnostics menu, type 3 (Synchronization diagnostics) and press Enter to<br />
verify that a RA is synchronized.<br />
Note: The RA must be attached to run the synchronization diagnostics. Reattaching the<br />
RA causes the RA to reboot.<br />
The results displayed are similar to the following example:<br />
remote refid st t when poll reach delay offset jitter<br />
=============================================================================<br />
*10.10.0.1 192.116.202.203 3 u 438 1024 377 0.337 12.971 6.241<br />
+11 10.10.0.1 2 u 484 1024 376 0.090 -4.530 0.023<br />
LOCAL(0) LOCAL(0) 13 1 2 64 377 0.000 0.000 0.004<br />
The columns in the previous output are defined as follows:<br />
• remote—host names or addresses of the servers and peers used for synchronization<br />
• refid—current source of synchronization<br />
• st—stratum<br />
• t—type (u=unicast, m=multicast, l=local, – =do not know)<br />
• when—time since the peer was last heard, in seconds<br />
• poll—poll interval, in seconds<br />
• reach—status of the reachability register in octal format<br />
• delay—latest delay in milliseconds<br />
• offset—latest offset in milliseconds<br />
• jitter—latest jitter in milliseconds<br />
6872 5688–002 C–17
Running Installation Manager Diagnostics<br />
The symbol at the left margin indicates the synchronization status of each peer. The<br />
currently selected peer is marked with an asterisk (*); additional peers designated as<br />
acceptable for synchronization are marked with a plus sign (+). Peers marked with * and<br />
+ are included in the weighted average computation to set the local clock. Data<br />
produced by peers marked with other symbols is discarded. The LOCAL(0) entry<br />
represents the values obtained from the internal clock on the local machine.<br />
Collect System Info<br />
On the Diagnostics menu, type 4 (Collect system info) and press Enter to collect<br />
system information for later processing and analysis. You specify where to place the<br />
information collected. In some cases, you might need to transfer it to a vendor for<br />
technical support. You are prompted to provide the following information:<br />
• The time frame for log collection<br />
• Whether to collect information from the remote site<br />
• FTP details if you choose to send the results to an FTP server<br />
• Which logs to collect<br />
• Whether you have SANTap switches from which you want to collect information<br />
Note: The dialog asks whether you want full collection. If you choose full collection,<br />
additional technical information is supplied, but the time required for the collection<br />
process is lengthened. Unless specifically instructed by a Unisys service representative,<br />
do not choose full collection.<br />
The following dialog provides sample responses in bold type for collecting system<br />
information:<br />
>>GMT right now is 11/24/2005 14:45:43<br />
Enter the start date:<br />
>>11/22/2005<br />
Enter the start time:<br />
>>12:00:00<br />
Enter the end date:<br />
>>11/24/2005<br />
Enter the end time:<br />
>>14:45:43<br />
Note: The start and end times are used only for collection of the system<br />
logs. Logs from hosts are collected in their entirety.<br />
Do you want to collect system information from the other site also? (y/n)<br />
>>y<br />
Do you want to send results to an ftp server? (y/n)<br />
>>y<br />
C–18 6872 5688–002
Running Installation Manager Diagnostics<br />
Enter the name of the ftp server to which you want to transfer the<br />
collected system information:<br />
>>ftp.ess.unisys.com<br />
Enter the port number to which to connect on the FTP server:<br />
>>21<br />
Enter the FTP user name:<br />
>>MY_USERNAME<br />
Enter the location on the FTP server in which you want to put the collected<br />
system information:<br />
>>incoming<br />
Enter the file on the FTP server in which you want to put the collected<br />
system information:<br />
>>19557111_company.tar<br />
Enter the FTP password:<br />
>>*******<br />
Select the logs you want to collect:<br />
** Collection mode **<br />
[1] Collect logs from RAs only<br />
[2] Collect logs from hosts only<br />
[3] Collect logs from RAs and hosts<br />
>>3<br />
Do you have SANTap switches from which you want to collect information?<br />
>>n<br />
Do you want to perform full collection? (y/n)<br />
>>n<br />
Do you want to limit collection time? (y/n)<br />
>>n<br />
Once you complete the information-entry dialog, Installation Manager checks<br />
connectivity and displays a list of accessible hosts for which the feature is enabled. (See<br />
the Unisys <strong>SafeGuard</strong> <strong>Solutions</strong> Replication Appliance Administrator’s <strong>Guide</strong> for more<br />
information.). You must indicate the hosts for which you want to collect logs. You can<br />
select one or more individual hosts or enter NONE or ALL.<br />
Once you specify the hosts, Installation Manager returns system information and logs for<br />
all accessible RAs, including the remote RAs, if so instructed. This software also returns<br />
a success or failure status report for each RA from which it has been instructed to collect<br />
information.<br />
6872 5688–002 C–19
Running Installation Manager Diagnostics<br />
Installation Manager also collects logs for the selected hosts and reports on the success<br />
or failure of each collection. The timeout on the collection process is 20 minutes.<br />
Once the information is collected and you requested that it be stored on an ftp server,<br />
the system reports that it is transferring the collected information to the specified FTP<br />
location. Once the transfer completes, you are prompted to press ENTER to continue.<br />
You can also open or download the stored files using your browser. Log in as<br />
webdownload/webdownload, and access the files at one of these URLs:<br />
• For nonsecured servers: http:///info/<br />
• For secured servers: https:///info/<br />
The following error conditions apply:<br />
• If the connection with an RA is lost while information collection is in progress, no<br />
information is collected.<br />
You can run the process again. If the collection from the remote site failed because<br />
of a WAN failure, run the process locally at the remote site.<br />
• If simultaneous information collection is occurring from the same RA, only the<br />
collector that established the first connection can succeed.<br />
• FTP failure results in failure of the entire process.<br />
If this process fails to collect the desired host information, you can alternatively generate<br />
host information collection directly for individual hosts. Use the Host Information<br />
Collector (HIC) utility as described in Appendix A. Also, the Unisys <strong>SafeGuard</strong> <strong>Solutions</strong><br />
Administrator’s <strong>Guide</strong> provides additional information about the HIC utility.<br />
C–20 6872 5688–002
Appendix D<br />
Replacing a Replication Appliance<br />
(RA)<br />
To replace an RA at a site, you must perform the following tasks as described in this<br />
appendix:<br />
• Save configuration settings.<br />
• Record the group properties and save the Global cluster mode settings.<br />
• Modify the Preferred RA setting.<br />
• Detach the failed RA.<br />
• Remove the Fibre Channel adapter cards.<br />
• Install and configure the replacement RA.<br />
• Verify the RA installation.<br />
• Restore group properties.<br />
• Ensure the existing RA can switch over to the new RA.<br />
Note: During this process, be sure that the direction of all consistency groups is from<br />
the site without the failed RA to the site with the RA during this process. You might<br />
need to move groups.<br />
6872 5688–002 D–1
Replacing a Replication Appliance (RA)<br />
Saving the Configuration Settings<br />
Before you replace an RA, Unisys recommends that you save the current environment<br />
settings to a file. The saved file is a script that contains CLI commands for all groups,<br />
volumes, and replication pairs needed to re-create the environment. The file is used for<br />
backup purposes only.<br />
1. From a command prompt on the management PC, enter the following command to<br />
change to the directory where the plink.exe file is located:<br />
cd putty<br />
2. Update the following command with your site management IP address and<br />
administrator (admin) password, and then enter the command:<br />
plink -ssh site management IP address -l admin -pw admin password<br />
save_settings > sitexandsitey.txt<br />
Note: If a message is displayed asking whether you want to add a cached registry<br />
key, type y and press Enter. The file is automatically saved to the management PC<br />
in the same directory from which the command was issued.<br />
If you need to restore the settings saved in the previous procedure, update the following<br />
command with your site management IP address and administrator (admin) password,<br />
and then enter the command:<br />
plink -ssh site management IP address -l admin -pw admin password -m<br />
version30.txt<br />
Recording Policy Properties and Saving Settings<br />
Before you begin the RA replacement procedure, ensure to record the policy properties<br />
and save the Global cluster mode settings.<br />
Perform the following steps for each consistency group to record policy properties and<br />
save settings:<br />
1. Select the Policy tab.<br />
2. Write down and save the current preferred RA settings and Global cluster mode<br />
parameter for each consistency group. Use this record to restore these values after<br />
you replace the RA.<br />
3. Click OK.<br />
4. Repeat steps 1 through 3 for all the other groups.<br />
.<br />
D–2 6872 5688–002
Modifying the Preferred RA Setting<br />
Replacing a Replication Appliance (RA)<br />
For each consistency group, record the Preferred RA and Global cluster mode settings<br />
so that they can be stored at the end of this procedure.<br />
Perform the following steps to change all consistency groups that were running on the<br />
failed RA to a surviving RA:<br />
1. Select the Policy tab.<br />
2. Change the Preferred RA setting to a surviving RA number for all consistency<br />
groups that had the Preferred RA value set to the failed RA. Perform steps 2a<br />
through 2e for each group.<br />
a. If the Global cluster mode parameter is set to one of the following options,<br />
skip this step, and continue with step 4d:<br />
• None<br />
• Manual (shared quorum)<br />
• Manual<br />
b. Change the Global cluster mode parameter to<br />
• Manual (if using MSCS with shared quorum)<br />
• Manual (if using MSCS with majority node set)<br />
c. Click Apply.<br />
d. Change the Preferred RA setting, and then click Apply.<br />
e. Change the Global cluster mode parameter to the original setting.<br />
f. Click Apply.<br />
2. Select the Consistency Group and click the Status tab to verify that all groups<br />
are running on the new RA number.<br />
Review the current status of the preferred RA under the components pane.<br />
3. Detach the failed RA. If you can log on to the RA, detach the RA by performing the<br />
following steps. Else continue with “Removing Fibre Channel Adapter Cards.”<br />
a. Use the Putty utility to connect to the box management IP address for the RA that<br />
is being replaced.<br />
b. Type boxmgmt when prompted to log in, and then type the appropriate<br />
password if it has changed from the default password boxmgmt.<br />
The Main Menu is displayed.<br />
c. Type 4 (Cluster operations) and press Enter.<br />
d. Type 2 (Detach from cluster) to detach the RA from the cluster, and then press<br />
Enter.<br />
e. Type y when prompted to detach and press Enter.<br />
f. Type B (Back) and press Enter to return to the Main Menu.<br />
g. Type quit and close the PuTTY window.<br />
6872 5688–002 D–3
Replacing a Replication Appliance (RA)<br />
Removing Fibre Channel Adapter Cards<br />
Perform the following to remove the RA and Fibre Channel host bus adapters (HBAs):<br />
1. Power off the failed RA.<br />
2. Physically disconnect and remove the failed RA from the rack.<br />
3. Physically remove the Fibre Channel HBAs from the failed RA and insert them into<br />
the replacement RA.<br />
Note: If you cannot use the cards from the existing RA, refer to “Failure of All SAN<br />
Fibre Channel Host Bus Adapters (HBAs)” in Section 8 for information about<br />
replacing a failed HBA.<br />
Installing and Configuring the Replacement RA<br />
To install and configure the replacement RA, you must complete several tasks, as follow:<br />
• Complete the procedure in “Cable and Apply Power to New RA.”<br />
• Complete the procedure in “Connecting and Accessing the RA.”<br />
• Complete the procedure in “Configuring the RA.”<br />
• Complete the procedures in “Verifying the RA Installation.”<br />
Cable and Apply Power to the New RA<br />
1. Insert the new RA into the rack and apply power.<br />
2. Insert the Unisys <strong>SafeGuard</strong> <strong>Solutions</strong> RA Setup Disk CD-ROM into the CD/DVD<br />
drive of the RA. Ensure that this disk is the same version that is running in the other<br />
RAs.<br />
3. Power off and then power on the RA.<br />
4. As the RA boots, check the BIOS level as displayed in the Unisys banner and note<br />
the level displayed. At the end of the replacement procedure, you can compare the<br />
existing RA BIOS level with the new RA BIOS level. The RA BIOS might need to be<br />
updated.<br />
Connecting and Accessing the RA<br />
1. Power on the appropriate RA.<br />
2. Connect an Ethernet cable between the management PC used for installation and<br />
the WAN Ethernet segment to which the RA is connected.<br />
If you connect the management PC directly to the RA, use a crossover cable.<br />
3. Assign the following IP address and subnet mask to the management PC:<br />
10.77.77.50 (IP address)<br />
255.255.255.0 (subnet mask)<br />
4. Access the RA by using the SSH client. (See Appendix C.) Use the 10.77.77.77 IP<br />
address, which has a subnet mask of 255.255.255.0.<br />
D–4 6872 5688–002
Replacing a Replication Appliance (RA)<br />
5. Log in with the boxmgmt user name and the boxmgmt password.<br />
6. Provide the following information for the layout of the RA installation:<br />
a. When prompted about the number of sites in the environment<br />
• Type 2 to install in a geographic replication environment or a geographic<br />
clustered environment.<br />
• Type 1 to install in a continuous data protection environment.<br />
b. Type the number of RAs at the site, and press Enter.<br />
The Main Menu appears.<br />
Checking Storage-to-RA Access<br />
If the LUNs are not accessible, check your switch configuration and zoning. Verify that all<br />
LUNs are accessible by using the Main Menu of the Installation Manager and<br />
performing the following steps:<br />
1. Type 3 (Diagnostics).<br />
2. Type 2 (Fibre Channel diagnostics).<br />
3. Type 4 (Detect Fibre Channel LUNs).<br />
After a few minutes, a list of detected LUNs appears.<br />
4. Press the spacebar until all expected LUNs appear.<br />
5. Type B (Back).<br />
6. Type B again.<br />
The Main Menu appears.<br />
7. If you do not see all Fibre Channel LUNs in step 4, correct the environment and<br />
repeat steps 1 through 6.<br />
Enabling PCI-X Slot Functionality<br />
If your system is configured with a gigabit (Gb) WAN, which is used for the optical WAN<br />
connection, perform the following steps on the Main Menu of the replacement RA:<br />
1. Type 2 (Setup).<br />
2. Type 8 (Advanced option).<br />
3. Type 12 (Enable/disable additional remote interface).<br />
4. Type yes when prompted on whether to enable the additional remote interface.<br />
5. Type B twice to return to the Main Menu.<br />
6872 5688–002 D–5
Replacing a Replication Appliance (RA)<br />
Configuring the RA<br />
1. On the Main Menu, type 1 (Installation).<br />
2. Type 2 (Get Setup information from an installed RA). Press Enter.<br />
The Get Settings Wizard menu appears with Get Settings from Installed<br />
RA selected.<br />
3. Press Enter.<br />
4. Type 1 (Management interface) to view the settings from the installed RA.<br />
5. Type y when prompted to configure a temporary IP address.<br />
6. Type the IP address.<br />
7. Type the IP subnet mask and then press Enter.<br />
8. Type y or n, depending on your environment, when prompted to configure a<br />
gateway.<br />
9. Type the box management IP address of Site 1 RA 1 to import the settings from that<br />
RA.<br />
10. Type y to import the settings.<br />
11. Press Enter to continue when a message states that the configuration was<br />
successfully imported.<br />
The Get Settings Wizard menu appears with Apply selected.<br />
12. Perform the following steps to apply the configuration to the RA:<br />
a. Press Enter to continue.<br />
The complete list of settings is displayed. These settings are the same as the<br />
ones for Site 1 RA 1.<br />
b. Type y to apply these settings.<br />
c. Type 1 or 2 when prompted for a site number, depending on the site on which<br />
the RA is located.<br />
d. Type the RA number when prompted.<br />
A confirmation message appears when the settings are applied successfully.<br />
e. Press Enter.<br />
The Get Settings Wizard menu appears with Proceed to the Complete<br />
Installation Wizard selected.<br />
f. Press Enter to continue.<br />
The Complete Installation Wizard menu appears with Configure<br />
repository volume selected.<br />
13. Configure the repository volume by completing the following steps:<br />
a. Press Enter.<br />
b. Type 2 (Select a previously formatted repository volume).<br />
D–6 6872 5688–002
Replacing a Replication Appliance (RA)<br />
c. Select the number of the repository volume corresponding to the group of<br />
displayed volumes, and press Enter.<br />
d. Press Enter again.<br />
The Complete Installation Wizard menu appears with Attach to cluster<br />
selected.<br />
14. Attach the RA to the RA cluster by completing the following steps:<br />
a. Press Enter.<br />
b. Type y at the prompt to attach to the cluster.<br />
The RA reboots.<br />
c. Close the PuTTY session if necessary.<br />
Verifying the RA Installation<br />
To verify that the RA is correctly installed, you must<br />
• Verify the WAN bandwidth<br />
• Verify the clock synchronization<br />
Verifying WAN Bandwidth<br />
Use the following procedure to verify the actual versus the expected WAN bandwidth.<br />
Note: Correct any problems and rerun the verification.<br />
1. Open an SSH session to the box management IP address for the replacement RA.<br />
2. Type boxmgmt when prompted to log in, and then type the appropriate password<br />
if it has changed from the default password boxmgmt.<br />
The Main Menu is displayed.<br />
3. Type 3 (Diagnostics) and press Enter.<br />
The Diagnostics menu appears.<br />
4. Type 1 (IP diagnostics) and press Enter.<br />
The IP Diagnostics menu appears.<br />
5. Type 4 (Test throughput) and press Enter.<br />
6. Type the WAN IP address of the peer RA; for example, site 2 RA 1 is the peer for<br />
site 1 RA 1.<br />
7. Type 2 (WAN interface).<br />
8. At the prompt, type 20 to change the default value for the desired number of<br />
concurrent streams.<br />
9. At the prompt for the test duration, type 60 to change the default value.<br />
A message is displayed that the connection was established.<br />
6872 5688–002 D–7
Replacing a Replication Appliance (RA)<br />
10. After 60 seconds, make sure that the following information is displayed on the<br />
screen. Ignore any TCP Windows Size warnings.<br />
• IP connection for every stream<br />
• Interval, Transfer, and Bandwidth for every stream<br />
• Expected bandwidth in the [SUM] display at the bottom of the screen<br />
11. On the IP Diagnostics menu, type Q (Quit), and then type y.<br />
Verifying Clock Synchronization<br />
The timing of all Unisys <strong>SafeGuard</strong> 30m activities across all RAs in an installation must<br />
be synchronized against a single clock (for example, on the network time protocol [NTP]<br />
server). Consequently, you need to synchronize the replacement RA.<br />
For the procedure to verify RA synchronization, see the Unisys <strong>SafeGuard</strong> <strong>Solutions</strong><br />
Replication Appliance Installation <strong>Guide</strong>.<br />
Restoring Group Properties<br />
Perform the following steps on the Management Console for each group that needs<br />
to have the Preferred RA setting restored to an RA other than RA 1.. All Preferred RA<br />
settings are set to RA 1.<br />
1. Select the Policy tab for the consistency group.<br />
2. On the General Settings section, change the Preferred RA setting to the<br />
original setting, and then click Apply.<br />
3. Change the Global cluster mode under Advanced to the original setting if it<br />
was changed earlier.<br />
4. Click Apply.<br />
Ensuring the Existing RA Can Switch Over to the<br />
New RA<br />
Once the new RA is part of the configuration, the management console does not display<br />
any errors. Shut down any other RA at the site to ensure that the newly replaced RA can<br />
successfully complete the switchover. As the existing RA reboots, check the BIOS level<br />
as displayed in the Unisys banner and note it.<br />
Compare the BIOS level noted for the exiting (rebooting) RA with the BIOS level you<br />
noted for the replacement RA. If the BIOS levels do not match, contact the Unisys<br />
<strong>Support</strong> Center to obtain the correct BIOS.<br />
D–8 6872 5688–002
Appendix E<br />
Understanding Events<br />
Event Log<br />
Event Topics<br />
Various events generate entries to the Unisys <strong>SafeGuard</strong> 30m solution system log.<br />
These events are predefined in the system according to topic, level of severity, and<br />
scope. The Unisys <strong>SafeGuard</strong> 30m solution supports proactive notification of an event—<br />
either by sending e-mail messages or by generating system log events that are logged<br />
by a management application.<br />
The system records log entries in response to a wide range of predefined events. Each<br />
event carries an event ID. For manageability, the system divides the events into general<br />
and advanced types. In most cases, you can monitor system behavior effectively by<br />
viewing the general events only. For troubleshooting a problem, technical support<br />
personnel might want to review the advanced log events.<br />
Event topics correspond to the components where the events occur, including<br />
• Management (management console and CLI)<br />
• Site<br />
• RA<br />
• Consistency group<br />
• Splitter<br />
A single event can generate multiple log entries.<br />
6872 5688–002 E–1
Understanding Events<br />
Event Levels<br />
Event Scope<br />
The levels of severity for events are defined as follows (in ascending order):<br />
• Info<br />
These messages are informative in nature, usually referring to changes in the<br />
configuration or normal system state.<br />
• Warning<br />
These messages indicate a warning, usually referring to a transient state or to an<br />
abnormal condition that does not degrade system performance.<br />
• Error<br />
These messages indicate an important event that is likely to disrupt normal system<br />
behavior, performance, or both.<br />
A single change in the system—for example, an error over a communications line—can<br />
affect a wide range of system components and cause the system to generate a large<br />
number of log events. Many of these events contain highly technical information that is<br />
intended for use by Unisys service representatives. When all of the events are displayed,<br />
you might find it difficult to identify the particular events in which you are interested.<br />
You can use the scope to manage the type and quantity of events that are displayed in<br />
the log. An event belongs to one of the following scopes:<br />
• Normal<br />
Events with a Normal scope result when the system analyzes a wide range of<br />
system data to generate a single event that explains the root cause for an entire set<br />
of Detailed and Advanced events. Usually, these events are sufficient for effective<br />
monitoring of system behavior.<br />
• Detailed<br />
Events with a Detailed scope include all events for all components that are<br />
generated for users and that are not included among the events that have a Normal<br />
scope. The display of Detailed events includes Normal events also.<br />
• Advanced<br />
Events with an Advanced scope contain technical information. In some cases, such<br />
as troubleshooting a problem, a Unisys service representative might need to retrieve<br />
information from the Advanced log events.<br />
.<br />
E–2 6872 5688–002
Displaying the Event Log<br />
Understanding Events<br />
The event log is displayed either from the Management Console or using the CLI.<br />
To display event logs, select Logs in the navigation pane; the most recent events in the<br />
event log are displayed. For more information about a particular event log, double-click<br />
the event log. The Log Event Properties dialog box displays details of the individual<br />
event.<br />
You can sort the log events according to any of the columns (that is, level, scope, time,<br />
site, ID and topic) in ascending or descending order.<br />
Perform the following steps to display advanced logs:<br />
1. Click the Filter log tool bar option in the event pane.<br />
The Filter Log dialog box appears.<br />
2. Change the scope to Advanced.<br />
3. Click OK.<br />
For more information about using the management console, see the Unisys <strong>SafeGuard</strong><br />
<strong>Solutions</strong> Replication Appliance Administrator’s <strong>Guide</strong>.<br />
To display the event log from the CLI, run the get_logs command and specify values for<br />
each of the parameters. Specify the parameters carefully to avoid displaying unnecessary<br />
log information. You can use the terse display parameter to show more or less<br />
information for the displayed events as desired.<br />
For information about the CLI, see the Unisys <strong>SafeGuard</strong> <strong>Solutions</strong> Replication Appliance<br />
Command Line Interface (CLI) Reference <strong>Guide</strong>.<br />
Using the Event Log for <strong>Troubleshooting</strong><br />
The event log provides information that can be useful in determining the cause or nature<br />
of problems that might arise during operation.<br />
The “group capabilities” events provide an important tool for understanding the behavior<br />
of a consistency group. Each group capabilities event—such as group capabilities OK,<br />
group capabilities minor problem, or group capabilities<br />
problem—provides a high-level description of a current group situation with regard to<br />
each of the RAs and identifies the RA that is currently handling the group.<br />
6872 5688–002 E–3
Understanding Events<br />
The information reported for each RA includes the following:<br />
• RA status: Indicates whether an RA is currently a member of the RA cluster (that is,<br />
alive) or not a member (that is, dead).<br />
• Marking status: yes or no.<br />
• Transfer status: yes, no, no data loss (that is, flushing), or yes unstable (that is, the<br />
RA cannot be initialized if closed or detached).<br />
• Journal capability: yes (that is, distributing, logged access, and so forth), no, or static<br />
(that is, access to an image is enabled but access to a different image is not enabled,<br />
cannot distribute, and cannot support image access)<br />
• Preferred: yes or no.<br />
In addition, the event log reports the RA on which the group is actually running and the<br />
status of the link between the sites.<br />
A group capabilities event is generated whenever there is a change in the capabilities of<br />
a group on any RA. The message reports on any limitations to the capabilities of the<br />
group and provides reasons for these limitations.<br />
Tracking logged events can explain changes in a group state (for example, the reason<br />
replication was paused, the reason the group switched to another RA, and so forth).<br />
The group capabilities events might offer reasons that particular actions are not<br />
performed. For example, if you want to know the reason the group transfer was paused,<br />
you can check the event log for the “pause replication” action. If, however, you want to<br />
know the reason a group transfer did not start, you might check the most recent group<br />
capabilities event.<br />
The level of a group capabilities event can be INFO, WARNING, or ERROR, depending<br />
on the severity of the reported situation. These levels correspond to the OK, minor<br />
problem, and problem bookmarks that follow group capabilities in the message<br />
descriptions.<br />
List of Events<br />
The list of events is presented in tabular format with the following given for each event:<br />
• Event ID<br />
• Topic (for example, Management, Site, RA, Splitter, Group)<br />
• Level (for example, Info, Warning, Error )<br />
• Description<br />
• Scope<br />
• Time<br />
• Site<br />
E–4 6872 5688–002
List of Normal Events<br />
Event<br />
ID<br />
Understanding Events<br />
Normal events include both root-cause events (a single description for an event that can<br />
generate multiple events) and other selected basic events. Some Normal events do not<br />
have a topic or trigger. Table E–1 lists Normal events with their descriptions.<br />
Topic<br />
Table E–1. Normal Events<br />
Level<br />
Description<br />
1000 Management Info User logged in. (User<br />
)<br />
1001 Management Warning Log in failed. (User<br />
)<br />
1003 Management Warning Failed to generate SNMP<br />
trap. (Trap contents)<br />
1004 Management Warning Failed to send e-mail alert<br />
to specified address.<br />
(Address , Event summary<br />
)<br />
1005 Management Warning Failed to update file. (File<br />
<br />
1006 Management Info Settings changed. (User<br />
, Settings<br />
)<br />
1007 Management Warning Settings change failed.<br />
(User , Settings<br />
, Reason<br />
)<br />
1008 Management Info User action succeeded.<br />
(User , Action<br />
)<br />
Trigger<br />
User log-in action<br />
User failed to log in<br />
The system failed to<br />
send SNMP trap.<br />
The system failed to<br />
send an e-mail alert.<br />
The system failed to<br />
update the local<br />
configuration file<br />
(passwords, SSH<br />
keys, system log<br />
configuration, and<br />
SNMP configuration).<br />
The user changed<br />
settings.<br />
The system failed to<br />
change settings.<br />
The user performed<br />
one of these actions:<br />
bookmark_image,<br />
clear_markers,<br />
set_markers,<br />
undo_logged_<br />
writes, set_num_<br />
of_streams.<br />
6872 5688–002 E–5
Understanding Events<br />
Event<br />
ID<br />
Topic<br />
Table E–1. Normal Events<br />
Level<br />
Description<br />
1009 Management Warning User action failed. (User<br />
, Action ,<br />
Reason )<br />
1011 Management Error Grace period expired. You<br />
must install an activation<br />
code to activate your<br />
license.<br />
1014 Management Info User bookmarked an<br />
image. (Group ,<br />
Snapshot )<br />
1015 Management Warning RA-to-storage multipathing<br />
problem (RA ,<br />
Volume )<br />
1016 Management Warning<br />
Off<br />
RA- multipathing fixed.<br />
problem (RA ,<br />
Volume )<br />
1017 Management Warning RA- multipathing problem.<br />
(RA ,<br />
Splitter)<br />
1018 Management Warning<br />
Off<br />
RA- multipathing problem<br />
fixed. (RA , Splitter<br />
)<br />
1019 Management Warning User action succeeded.<br />
(Markers cleared. Group<br />
,)<br />
(Replication set attached<br />
as clean. Group)<br />
3001 RA Warning RA is no longer a cluster<br />
member. (RA )<br />
3005 RA Error Settings conflict between<br />
sites. (Reason )<br />
Trigger<br />
One of these actions<br />
failed:<br />
bookmark_image,<br />
clear_markers,<br />
set_markers,<br />
undo_logged_<br />
writes, set_num_<br />
of_streams.<br />
Grace period expired<br />
The user bookmarked<br />
an image.<br />
Single path only or<br />
more paths between<br />
RA and volume are<br />
not available.<br />
All paths between the<br />
RA and volume are<br />
available.<br />
One or more paths<br />
between the RA and<br />
the splitter are not<br />
available.<br />
All paths between the<br />
RA and the splitter<br />
are available.<br />
User cleared markers<br />
or attached replication<br />
set as clean.<br />
An RA is<br />
disconnected from<br />
site control.<br />
A settings conflict<br />
between the sites<br />
was discovered.<br />
E–6 6872 5688–002
Event<br />
ID<br />
Topic<br />
Table E–1. Normal Events<br />
Level<br />
Description<br />
3006 RA Error Off Settings conflict between<br />
sites resolved by user.<br />
(Using Site <br />
settings)<br />
3030 RA Warning RA switched path to<br />
storage. (RA ,<br />
Volume )<br />
4056 Group Warning No image was found in<br />
the journal to match the<br />
query. (Group )<br />
4090 Group Warning Target-side log is 90<br />
percent full. When log is<br />
full, writing by hosts at<br />
target side is disabled.<br />
(Group )<br />
4106 Group Warning Capacity reached; cannot<br />
write additional markers<br />
for this group to<br />
.<br />
Starting full sweep. (Group<br />
)<br />
4117 Group Warning Virtual access buffer is 90<br />
percent full. When the<br />
buffer is full, writing by<br />
hosts at the target side is<br />
disabled. (Group )<br />
5008 Splitter Warning Host shut down. (Host<br />
Splitter )<br />
5010 Splitter Warning Splitter stopped;<br />
depending on policy,<br />
writing by host might be<br />
disabled for some groups,<br />
and a full sweep might be<br />
required for other groups.<br />
(Splitter )<br />
5011 Splitter Warning Splitter stopped; full<br />
sweep is required. (Splitter<br />
)<br />
5012 Splitter Warning The splitter stopped; write<br />
operations to replication<br />
volumes are disabled.<br />
(Splitter )<br />
Understanding Events<br />
Trigger<br />
A settings conflict<br />
between the sites<br />
was resolved by the<br />
user.<br />
A storage path<br />
change was initiated<br />
by the RA.<br />
No image was found<br />
in the journal to<br />
match the query.<br />
The target-side log is<br />
90 percent full.<br />
The disk space for the<br />
markers was filled for<br />
the group.<br />
The usage of the<br />
virtual access buffer<br />
has reached 90<br />
percent.<br />
The host was shut<br />
down or restarted.<br />
The user stopped the<br />
splitter after removing<br />
volumes; volumes are<br />
disconnected.<br />
The user stopped the<br />
splitter after removing<br />
volumes; volumes are<br />
disconnected.<br />
The splitter stopped;<br />
host access to all<br />
volumes is disabled.<br />
6872 5688–002 E–7
Understanding Events<br />
Event<br />
ID<br />
Topic<br />
Table E–1. Normal Events<br />
Level<br />
Description<br />
10000 — Info Changes are occurring in<br />
the system. Analysis in<br />
progress.<br />
10001 — Info System changes have<br />
occurred. The system is<br />
now stable.<br />
10002 — Info The system activity has<br />
not stabilized—issuing an<br />
intermediate report.<br />
10101 — Error The cause of the system<br />
activity is unclear. To<br />
obtain more information,<br />
filter the events log using<br />
the Detailed scope.<br />
10102 — Info Site control recorded<br />
internal changes that do<br />
not affect system<br />
operation.<br />
10202 — Info Settings have changed. —<br />
10203 — Info The RA cluster is down. —<br />
10204 — Error One or more RAs are<br />
disconnected from the RA<br />
cluster.<br />
10205 — Error A communications<br />
problem occurred in an<br />
internal process.<br />
10206 — Info An internal process was<br />
restarted.<br />
10207 — Error An internal process was<br />
restarted.<br />
10210 — Error Initialization is<br />
experiencing high-load<br />
conditions.<br />
10211 — Error A temporary problem<br />
occurred in the Fibre<br />
Channel link between the<br />
splitters and the RAs.<br />
10212 — Error Off The temporary problem<br />
that occurred in the Fibre<br />
Channel link between the<br />
splitters and the RAs is<br />
resolved.<br />
Trigger<br />
E–8 6872 5688–002<br />
—<br />
—<br />
—<br />
—<br />
—<br />
—<br />
—<br />
—<br />
—<br />
—<br />
—<br />
—
Event<br />
ID<br />
Topic<br />
Table E–1. Normal Events<br />
Level<br />
Description<br />
10501 — Info Synchronization<br />
completed.<br />
10502 — Info Access to the target-side<br />
image is enabled.<br />
10503 — Error The system is transferring<br />
the latest snapshot before<br />
pausing transfer (no data<br />
loss).<br />
10504 — Info The journal was cleared. —<br />
10505 — Info The system completed<br />
undoing writes to the<br />
target-side log.<br />
10506 — Info The roll to the physical<br />
images is complete.<br />
Logged access to the<br />
physical image is now<br />
available.<br />
10507 — Info Because of system<br />
changes, the journal was<br />
temporarily out of service.<br />
The journal is now<br />
available.<br />
10508 — Info All data were flushed from<br />
the local-side RA;<br />
automatic failover<br />
proceeds.<br />
10509 — Info The initial long<br />
resynchronization has<br />
completed.<br />
10510 — Info Following a paused<br />
transfer, the system is<br />
now cleared to restart<br />
transfer.<br />
10511 — Info The system finished<br />
recovering the replication<br />
backlog.<br />
12001 — Error The splitter is down. —<br />
12002 — Error An error occurred in all<br />
WAN links to the other<br />
site. The other site is<br />
possibly down.<br />
Understanding Events<br />
Trigger<br />
6872 5688–002 E–9<br />
—<br />
—<br />
—<br />
—<br />
—<br />
—<br />
—<br />
—<br />
—<br />
—<br />
—
Understanding Events<br />
Event<br />
ID<br />
Topic<br />
Table E–1. Normal Events<br />
Level<br />
Description<br />
12003 — Error An error occurred in the<br />
WAN link to the RA at the<br />
other site.<br />
12004 — Error An error occurred in the<br />
data link over the WAN. All<br />
RAs are unable to transfer<br />
replicated data to the<br />
other site.<br />
12005 — Error An error occurred in the<br />
data link over the WAN.<br />
The RA is unable to<br />
transfer replicated data to<br />
the other site.<br />
12006 — Error The RA is disconnected<br />
from the RA cluster.<br />
12007 — Error All RAs are disconnected<br />
from the RA cluster.<br />
12008 — Error The RA is down. —<br />
12009 — Error The group entered high<br />
load.<br />
12010 — Error A journal error occurred.<br />
Full sweep is to be<br />
performed after the error<br />
is corrected.<br />
12011 — Error The target-side log or<br />
virtual buffer is full. Writing<br />
by hosts at the target side<br />
is disabled.<br />
12012 — Error The system cannot enable<br />
virtual access to the<br />
image.<br />
12013 — Error The system cannot enable<br />
access to a specified<br />
image.<br />
12014 — Error The Fibre Channel link<br />
between all RAs and all<br />
splitters and storage is<br />
down.<br />
12016 — Error The Fibre Channel link<br />
between all RAs and all<br />
storage is down.<br />
Trigger<br />
E–10 6872 5688–002<br />
—<br />
—<br />
—<br />
—<br />
—<br />
—<br />
—<br />
—<br />
—<br />
—<br />
—<br />
—
Event<br />
ID<br />
Topic<br />
Table E–1. Normal Events<br />
Level<br />
Description<br />
12022 — Error The Fibre Channel link<br />
between the RA and<br />
splitters or storage<br />
volumes (or both) is down.<br />
12023 — Error The Fibre Channel link<br />
between the RA and all<br />
splitters and storage is<br />
down.<br />
12024 — Error The Fibre Channel link<br />
between the RA and all<br />
splitters is down.<br />
12025 — Error The Fibre Channel link<br />
between the RA and all<br />
storage is down.<br />
12026 — Error An error occurred in the<br />
WAN link to the RA at the<br />
other site.<br />
12027 — Error All replication volumes<br />
attached to the<br />
consistency group (or<br />
groups) are not accessible.<br />
12029 — Error The Fibre Channel link<br />
between all RAs and one<br />
or more volumes is down.<br />
12033 — Error The repository volume is<br />
not accessible; data might<br />
be lost.<br />
12034 — Error Writes to storage occurred<br />
without corresponding<br />
writes to the RA.<br />
12035 — Error An error occurred in the<br />
WAN link to the RA cluster<br />
at the other site.<br />
12036 — Error A renegotiation of the<br />
transfer protocol is<br />
requested.<br />
12037 — Error All volumes attached to<br />
the consistency group (or<br />
groups) are not accessible.<br />
Understanding Events<br />
Trigger<br />
6872 5688–002 E–11<br />
—<br />
—<br />
—<br />
—<br />
—<br />
—<br />
—<br />
—<br />
—<br />
—<br />
—<br />
—
Understanding Events<br />
Event<br />
ID<br />
Topic<br />
Table E–1. Normal Events<br />
Level<br />
Description<br />
12038 — Error All journal volumes<br />
attached to the<br />
consistency group (or<br />
groups) are not accessible.<br />
12039 — Error A long resynchronization<br />
started.<br />
12040 — Error The system detected bad<br />
sectors in a volume.<br />
12041 — Error The splitter is up. —<br />
12042 — Error All WAN links to the other<br />
site are restored.<br />
12043 — Error The WAN link to the RA at<br />
the other site is restored.<br />
12044 — Error Problem with IP link<br />
between RA (in at least in<br />
one direction).<br />
12045 — Error Problem with all IP links<br />
between RA<br />
12046 — Error Problem with IP links<br />
between RA<br />
12047 — Error RA network interface card<br />
(NIC) problem.<br />
14001 — Error Off The splitter is up. —<br />
14002 — Error Off All WAN links to the other<br />
site are restored.<br />
14003 — Error Off The WAN link to the RA at<br />
the other site is restored.<br />
14004 — Error Off The data link over the<br />
WAN is restored. All RAs<br />
can transfer replicated<br />
data to the other site.<br />
14005 — Error Off The data link over the<br />
WAN is restored. The RA<br />
can transfer replicated<br />
data to the other site.<br />
14006 — Error Off The connection of the RA<br />
to the RA cluster is<br />
restored.<br />
Trigger<br />
E–12 6872 5688–002<br />
—<br />
—<br />
—<br />
—<br />
—<br />
—<br />
—<br />
—<br />
—<br />
—<br />
—<br />
—<br />
—<br />
—
Event<br />
ID<br />
Topic<br />
Table E–1. Normal Events<br />
Level<br />
Description<br />
14007 — Error Off The connection of all RAs<br />
to the RA cluster is<br />
restored.<br />
14008 — Error Off The RA is up. —<br />
14009 — Error Off The group exited high<br />
load. The initialization<br />
completed.<br />
14010 — Error Off The journal error was<br />
corrected. A full sweep<br />
operation is required.<br />
14011 — Error Off The target-side log or<br />
virtual buffer is no longer<br />
full.<br />
14012 — Error Off Virtual access to an image<br />
is enabled.<br />
14013 — Error Off The system is no longer<br />
trying to access a diluted<br />
image.<br />
14014 — Error Off The Fibre Channel link<br />
between all RAs and all<br />
splitters and storage is<br />
restored.<br />
14016 — Error Off The Fibre Channel link<br />
between all RAs and all<br />
storage is restored.<br />
14022 — Error Off The Fibre Channel link that<br />
was down between the<br />
RA and splitters or storage<br />
volumes (or both) is<br />
restored.<br />
14023 — Error Off The Fibre Channel link<br />
between the RA and all<br />
splitters and storage is<br />
restored.<br />
14024 — Error Off The Fibre Channel link<br />
between the RA and all<br />
splitters is restored.<br />
14025 — Error Off The Fibre Channel link<br />
between the RA and all<br />
storage is restored.<br />
14026 — Error Off The WAN link to the RA at<br />
the other site is restored.<br />
Understanding Events<br />
Trigger<br />
6872 5688–002 E–13<br />
—<br />
—<br />
—<br />
—<br />
—<br />
—<br />
—<br />
—<br />
—<br />
—<br />
—<br />
—<br />
—
Understanding Events<br />
Event<br />
ID<br />
Topic<br />
Table E–1. Normal Events<br />
Level<br />
Description<br />
14027 — Error Off Access to all volumes<br />
attached to the<br />
consistency group (or<br />
groups) is restored.<br />
14029 — Error Off The Fibre Channel link<br />
between all RAs and one<br />
or more volumes is<br />
restored.<br />
14033 — Error Off Access to the repository<br />
volume is restored.<br />
14034 — Error Off Replication consistency in<br />
writes to storage is<br />
restored.<br />
14035 — Error Off The WAN link to the RA at<br />
the other site is restored.<br />
14036 — Error Off The renegotiation of the<br />
transfer protocol is<br />
complete.<br />
14037 — Error Off Access to all replication<br />
volumes attached to the<br />
consistency group (or<br />
groups) is restored.<br />
14038 — Error Off Access to all journal<br />
volumes attached to the<br />
consistency group (or<br />
groups) is restored.<br />
14039 — Info The long resynchronization<br />
has completed.<br />
14040 — Error Off The system detected a<br />
correction of bad sectors<br />
in the volume.<br />
14041 — Error Off The system detected that<br />
the volume is no longer<br />
read-only.<br />
14042 — Error Off A synchronization is in<br />
progress to restore any<br />
failed writes in the group.<br />
14043 — Error Off A synchronization is in<br />
progress to restore any<br />
failed writes.<br />
Trigger<br />
E–14 6872 5688–002<br />
—<br />
—<br />
—<br />
—<br />
—<br />
—<br />
—<br />
—<br />
—<br />
—<br />
—<br />
—<br />
—
Event<br />
ID<br />
Topic<br />
Table E–1. Normal Events<br />
Level<br />
Description<br />
14044 — Error Off Problem with IP link<br />
between RAs (in at least in<br />
one direction) corrected.<br />
14045 — Error Off All IP links between RAs<br />
restored.<br />
14046 — Error Off IP link between RAs<br />
restored.<br />
14047 — Error Off RA network interface card<br />
(NIC) problem corrected.<br />
16000 — Error Transient root cause. —<br />
16001 — Error The splitter was down.<br />
The problem is corrected.<br />
16002 — Error An error occurred in all<br />
WAN links to the other<br />
site. The problem is<br />
corrected.<br />
16003 — Error An error occurred in the<br />
WAN link to the RA at the<br />
other site. The problem is<br />
corrected.<br />
16004 — Error An error occurred in the<br />
data link over the WAN. All<br />
RAs were unable to<br />
transfer replicated data to<br />
the other site. The<br />
problem is corrected.<br />
16005 — Error An error occurred in the<br />
data link over the WAN.<br />
The RA was unable to<br />
transfer replicated data to<br />
the other site. The<br />
problem is corrected.<br />
16006 — Error The RA was disconnected<br />
from the RA cluster. The<br />
connection is restored.<br />
16007 — Error All RAs were<br />
disconnected from the RA<br />
cluster. The problem is<br />
corrected.<br />
16008 — Error The RA was down. The<br />
problem is corrected.<br />
Understanding Events<br />
Trigger<br />
6872 5688–002 E–15<br />
—<br />
—<br />
—<br />
—<br />
—<br />
—<br />
—<br />
—<br />
—<br />
—<br />
—<br />
—
Understanding Events<br />
Event<br />
ID<br />
Topic<br />
Table E–1. Normal Events<br />
Level<br />
Description<br />
16009 — Error The group entered high<br />
load. The problem is<br />
corrected.<br />
16010 — Error A journal error occurred.<br />
The problem is corrected.<br />
A full sweep is required.<br />
16011 — Error The target-side log or<br />
virtual buffer was full.<br />
Writing by the hosts at the<br />
target side was disabled.<br />
The problem is corrected.<br />
16012 — Error The system could not<br />
enable virtual access to<br />
the image. The problem is<br />
corrected.<br />
16013 — Error The system could not<br />
enable access to the<br />
specified image. The<br />
problem is corrected.<br />
16014 — Error The Fibre Channel link<br />
between all RAs and all<br />
splitters and storage was<br />
down. The problem is<br />
corrected.<br />
16016 — Error The Fibre Channel link<br />
between all RAs and all<br />
storage was down. The<br />
problem is corrected.<br />
16022 — Error The Fibre Channel link<br />
between the RA and<br />
splitters or storage<br />
volumes (or both) was<br />
down. The problem is<br />
corrected.<br />
16023 — Error The Fibre Channel link<br />
between the RA and all<br />
splitters and storage was<br />
down. The problem is<br />
corrected.<br />
16024 — Error The Fibre Channel link<br />
between the RA and all<br />
splitters was down. The<br />
problem is corrected.<br />
Trigger<br />
E–16 6872 5688–002<br />
—<br />
—<br />
—<br />
—<br />
—<br />
—<br />
—<br />
—<br />
—<br />
—
Event<br />
ID<br />
Topic<br />
Table E–1. Normal Events<br />
Level<br />
Description<br />
16025 — Error The Fibre Channel link<br />
between the RA and all<br />
storage was down. The<br />
problem is corrected.<br />
16026 — Error An error occurred in the<br />
WAN link to the RA at the<br />
other site. The problem is<br />
corrected.<br />
16027 — Error All volumes attached to<br />
the consistency group (or<br />
groups) were not<br />
accessible. The problem is<br />
corrected.<br />
16029 — Error The Fibre Channel link<br />
between all RAs and one<br />
or more volumes was<br />
down. The problem is<br />
corrected.<br />
16033 — Error The repository volume<br />
was not accessible. The<br />
problem is corrected.<br />
16034 — Error Off Writes to storage occurred<br />
without corresponding<br />
writes to the RA. The<br />
problem is corrected.<br />
16035 — Error An error occurred in the<br />
WAN link to the RA at the<br />
other site. The problem is<br />
corrected.<br />
16036 — Error The renegotiation of the<br />
transfer protocol was<br />
requested and has been<br />
completed.<br />
16037 — Error All replication volumes<br />
attached to the<br />
consistency group (or<br />
groups) were not<br />
accessible. The problem is<br />
corrected.<br />
Understanding Events<br />
Trigger<br />
6872 5688–002 E–17<br />
—<br />
—<br />
—<br />
—<br />
—<br />
—<br />
—<br />
—<br />
—
Understanding Events<br />
Event<br />
ID<br />
Topic<br />
Table E–1. Normal Events<br />
Level<br />
Description<br />
16038 — Error All journal volumes<br />
attached to the<br />
consistency group (or<br />
groups) were not<br />
accessible. The problem is<br />
corrected.<br />
16039 — Info The system ran a long<br />
resynchronization.<br />
16040 — Error The system detected bad<br />
sectors in the volume. The<br />
problem is corrected.<br />
16041 — Error The system detected that<br />
the volume was read-only.<br />
The problem is corrected.<br />
16042 — Error The splitter write<br />
operation might have<br />
failed while the group was<br />
transferring data.<br />
16043 — Error The splitter write<br />
operations might have<br />
failed.<br />
16044 — Error There was a problem with<br />
an IP link between RAs (in<br />
at least in one direction)<br />
16045 — Error There was a problem with<br />
all IP links between RAs.<br />
Problem has been<br />
corrected<br />
16046 — Error There was a problem with<br />
an IP link between RAs.<br />
Problem has been<br />
corrected.<br />
16047 — Error There was an RA network<br />
interface card (NIC)<br />
problem. Problem has<br />
been corrected.<br />
18001 — Error Off The splitter was<br />
temporarily up but is down<br />
again.<br />
18002 — Error Off All WAN links to the other<br />
site were temporarily<br />
restored, but the problem<br />
has returned.<br />
Trigger<br />
E–18 6872 5688–002<br />
—<br />
—<br />
—<br />
—<br />
—<br />
—<br />
—<br />
—<br />
—<br />
—<br />
—<br />
—
Event<br />
ID<br />
Topic<br />
Table E–1. Normal Events<br />
Level<br />
Description<br />
18003 — Error Off The WAN link to the RA at<br />
the other site was<br />
temporarily restored, but<br />
the problem has returned.<br />
18004 — Error Off The data link over the<br />
WAN was temporarily<br />
restored, but the problem<br />
has returned. All RAs are<br />
unable to transfer<br />
replicated data to the<br />
other site.<br />
18005 — Error Off The data link over the<br />
WAN was temporarily<br />
restored, but the problem<br />
has returned. The RA is<br />
currently unable to<br />
transfer replicated data to<br />
the other site.<br />
18006 — Error Off The connection of the RA<br />
to the RA cluster was<br />
temporarily restored, but<br />
the problem has returned.<br />
18007 — Error Off All RAs were temporarily<br />
restored to the RA cluster,<br />
but the problem has<br />
returned.<br />
18008 — Error Off The RA was temporarily<br />
up, but is down again.<br />
18009 — Error Off The group temporarily<br />
exited high load, but the<br />
problem has returned.<br />
18010 — Error Off The journal error was<br />
temporarily corrected, but<br />
the problem has returned.<br />
18011 — Error Off The target-side log or<br />
virtual buffer was<br />
temporarily no longer full,<br />
and write operations by<br />
the hosts at the target<br />
side were re-enabled.<br />
However, the problem has<br />
returned.<br />
Understanding Events<br />
Trigger<br />
6872 5688–002 E–19<br />
—<br />
—<br />
—<br />
—<br />
—<br />
—<br />
—<br />
—<br />
—
Understanding Events<br />
Event<br />
ID<br />
Topic<br />
Table E–1. Normal Events<br />
Level<br />
Description<br />
18012 — Error Off Virtual access to the<br />
image was temporarily<br />
enabled, but the problem<br />
has returned.<br />
18013 — Error Off Access to an image was<br />
temporarily enabled, but<br />
the problem has returned.<br />
18014 — Error Off The Fibre Channel link<br />
between all RAs and all<br />
splitters and storage was<br />
temporarily restored, but<br />
the problem has returned.<br />
18016 — Error Off The Fibre Channel link<br />
between all splitters and<br />
all storage was temporarily<br />
restored, but the problem<br />
has returned.<br />
18022 — Error Off The Fibre Channel link that<br />
was down between the<br />
RA and splitters or storage<br />
volumes (or both) was<br />
temporarily restored, but<br />
the problem has returned.<br />
18023 — Error Off The Fibre Channel link<br />
between the RA and all<br />
storage was temporarily<br />
restored, but the problem<br />
has returned.<br />
18024 — Error Off The Fibre Channel link<br />
between the RA and all<br />
splitters was temporarily<br />
restored, but the problem<br />
has returned.<br />
18025 — Error Off The Fibre Channel link<br />
between the RA and all<br />
storage was temporarily<br />
restored, but the problem<br />
has returned.<br />
18026 — Error The WAN link to the RA at<br />
the other site was<br />
temporarily restored, but<br />
the problem has returned.<br />
Trigger<br />
E–20 6872 5688–002<br />
—<br />
—<br />
—<br />
—<br />
—<br />
—<br />
—<br />
—<br />
—
Event<br />
ID<br />
Topic<br />
Table E–1. Normal Events<br />
Level<br />
Description<br />
18027 — Error Off Access to all journal<br />
volumes attached to the<br />
consistency group (or<br />
groups) was temporarily<br />
restored, but the problem<br />
has returned.<br />
18029 — Error Off The Fibre Channel link<br />
between all RAs and one<br />
or more volumes was<br />
temporarily restored, but<br />
the problem has returned.<br />
18033 — Error Off Access to the repository<br />
volume was temporarily<br />
restored, but the problem<br />
has returned.<br />
18034 — Error Off Replication consistency in<br />
write operations to<br />
storage and to RAs was<br />
temporarily restored, but<br />
the problem has returned.<br />
18035 — Error Off The WAN link to the RA at<br />
the other site was<br />
temporarily restored, but<br />
the problem has returned.<br />
18036 — Error Off The negotiation of the<br />
transfer protocol was<br />
completed but is again<br />
requested.<br />
18037 — Error Off Access to all volumes<br />
attached to the<br />
consistency group (or<br />
groups) was temporarily<br />
restored, but the problem<br />
has returned.<br />
18038 — Error Off Access to all replication<br />
volumes attached to the<br />
consistency group (or<br />
groups) was temporarily<br />
restored, but the problem<br />
has returned.<br />
18039 — Info The long resynchronization<br />
completed but has now<br />
restarted.<br />
Understanding Events<br />
Trigger<br />
6872 5688–002 E–21<br />
—<br />
—<br />
—<br />
—<br />
—<br />
—<br />
—<br />
—<br />
—
Understanding Events<br />
Event<br />
ID<br />
Topic<br />
Table E–1. Normal Events<br />
Level<br />
Description<br />
18040 — Error Off The user marked the<br />
volume as OK, but the<br />
bad-sectors problem<br />
persists.<br />
18041 — Error Off The user marked the<br />
volume as OK, but the<br />
read-only problem<br />
persists.<br />
18042 — Error Off The synchronization<br />
restored any failed write<br />
operations in the group,<br />
but the problem has<br />
returned.<br />
18043 — Error Off An internal problem has<br />
occurred.<br />
18044 — Error Off Problem with IP link<br />
between RAs (in at least<br />
one direction) was<br />
corrected, but problem<br />
has returned.<br />
18045 — Error Off Problem with all IP links<br />
between RAs (in at least in<br />
one direction) was<br />
corrected, but problem<br />
has returned.<br />
18046 — Error Off Problem with IP link<br />
between RAs was<br />
corrected, but problem<br />
has returned.<br />
18047 — Error Off RA network interface card<br />
(NIC) problem was<br />
corrected, but problem<br />
has returned.<br />
List of Detailed Events<br />
Trigger<br />
Detailed events are all events with respect to components generated for use by users<br />
and do not have a normal scope. Table E–2 lists these events and their descriptions.<br />
E–22 6872 5688–002<br />
—<br />
—<br />
—<br />
—<br />
—<br />
—<br />
—<br />
—
Event<br />
ID<br />
Topic<br />
Table E–2. Detailed Events<br />
Level<br />
Description<br />
Understanding Events<br />
Trigger<br />
1002 Management Info User logged out. (User ) The user logged<br />
out of the system.<br />
1010 Management Warning Grace period expires in 1 day.<br />
You must install an activation<br />
code to activate your Unisys<br />
<strong>SafeGuard</strong> solution license.<br />
1012 Management Warning License expires in 1 day. You<br />
must obtain a new Unisys<br />
<strong>SafeGuard</strong> 30m solution<br />
license.<br />
1013 Management Error License expired. You must<br />
obtain a new Unisys <strong>SafeGuard</strong><br />
30m solution license.<br />
2000 Site Info Site management running on<br />
.<br />
3000 RA Info RA as become a cluster<br />
member. (RA )<br />
3002 RA Warning Site management switched<br />
over to this RA. (RA ,<br />
Reason )<br />
3007 RA Warning<br />
Off<br />
The grace period<br />
expires in 1 day.<br />
The Unisys<br />
<strong>SafeGuard</strong> 30m<br />
solution license<br />
expires in 1 day.<br />
The Unisys<br />
<strong>SafeGuard</strong> 30m<br />
solution license<br />
expired.<br />
Site control is<br />
open; the RA has<br />
become the<br />
cluster leader.<br />
The RA is<br />
connected to site<br />
control.<br />
Leadership is<br />
transferred from<br />
an RA to another<br />
RA.<br />
RA is up. (RA ) The RA that was<br />
previously down<br />
came up.<br />
3008 RA Warning RA appears to be down. (RA<br />
)<br />
3011 RA Info RA access to a volume or<br />
volumes restored. (RA ,<br />
Volume , Volume<br />
Type )<br />
3012 RA Warning RA unable to access a volume<br />
or volumes. (RA , Volume<br />
, Volume Type<br />
)<br />
An RA suspects<br />
that the other RA<br />
is down.<br />
Volumes that were<br />
inaccessible<br />
became<br />
accessible.<br />
Volumes ceased to<br />
be accessible to<br />
the RA.<br />
6872 5688–002 E–23
Understanding Events<br />
Event<br />
ID<br />
Topic<br />
Table E–2. Detailed Events<br />
Level<br />
3013 RA Warning<br />
Off<br />
Description<br />
RA access to restored. (RA ,<br />
Volume )<br />
3014 RA Warning RA unable to access<br />
. (RA<br />
, Volume )<br />
3020 RA Warning<br />
Off<br />
WAN connection to an RA at<br />
other site is restored. (RA at<br />
other site: )<br />
3021 RA Warning Error in WAN connection to an<br />
RA at other site. (RA at other<br />
site: )<br />
3022 RA Warning<br />
Off<br />
LAN connection to RA<br />
restored. (RA )<br />
3023 RA Warning Error in LAN connection to an<br />
RA. RA )<br />
4000 Group Info Group capabilities OK. (Group<br />
)<br />
4001 Group Warning Group capabilities minor<br />
problem. (Group )<br />
Trigger<br />
The repository<br />
volume that was<br />
inaccessible<br />
became<br />
accessible.<br />
The repository<br />
volume became<br />
inaccessible to a<br />
single RA.<br />
The RA regained<br />
the WAN<br />
connection to an<br />
RA at the other<br />
site.<br />
The RA lost the<br />
WAN connection<br />
to an RA at the<br />
other site.<br />
The RA regained<br />
the LAN<br />
connection to an<br />
RA at the local<br />
site.<br />
The RA lost the<br />
LAN connection to<br />
an RA at the local<br />
site, without losing<br />
the connection<br />
through the<br />
repository volume.<br />
Capabilities are full<br />
and previous<br />
capabilities are<br />
unknown.<br />
Capabilities are<br />
either temporarily<br />
not full on the RA<br />
on which the<br />
group is currently<br />
running, or<br />
indefinitely not full<br />
on the RA on<br />
which the group is<br />
not running.<br />
E–24 6872 5688–002
Event<br />
ID<br />
Topic<br />
Table E–2. Detailed Events<br />
Level<br />
Description<br />
4003 Group Error Group capabilities problem.<br />
(Group )<br />
4007 Group Info Pausing data transfer. (Group<br />
, Reason: )<br />
4008 Group Warning Pausing data transfer. (Group<br />
, Reason: )<br />
4009 Group Error Pausing data transfer. (Group<br />
, Reason: )<br />
4010 Group Info Starting data transfer. (Group<br />
)<br />
4015 Group Info Transferring latest snapshot<br />
before pausing transfer (no<br />
data loss). (Group )<br />
4016 Group Warning Transferring latest snapshot<br />
before pausing transfer (no<br />
data loss). (Group )<br />
4017 Group Error Transferring latest snapshot<br />
before pausing transfer (no<br />
data loss). (Group )<br />
4018 Group Warning Transfer of latest snapshot<br />
from source is complete (no<br />
data loss). (Group )<br />
Understanding Events<br />
Trigger<br />
Capabilities are not<br />
full indefinitely on<br />
the RA on which<br />
the group is<br />
running.<br />
The user stopped<br />
the transfer.<br />
The system<br />
temporarily<br />
stopped the<br />
transfer.<br />
The system<br />
stopped the<br />
transfer<br />
indefinitely.<br />
The user<br />
requested a start<br />
transfer.<br />
In a total storage<br />
disaster, the<br />
system flushed<br />
the buffer before<br />
stopping<br />
replication.<br />
In a total storage<br />
disaster, the<br />
system flushed<br />
the buffer before<br />
stopping<br />
replication.<br />
In a total storage<br />
disaster, the<br />
system flushed<br />
the buffer before<br />
stopping<br />
replication.<br />
In a total storage<br />
disaster, the last<br />
snapshot from the<br />
source site is<br />
available at the<br />
target site.<br />
6872 5688–002 E–25
Understanding Events<br />
Event<br />
ID<br />
Topic<br />
Table E–2. Detailed Events<br />
Level<br />
Description<br />
4019 Group Warning Group in high load; transfer is<br />
to be paused temporarily.<br />
(Group )<br />
4020 Group Warning<br />
Off<br />
Group is no longer in high load.<br />
(Group )<br />
4021 Group Error Journal full—initialization<br />
paused. To complete<br />
initialization, enlarge the journal<br />
or allow long<br />
resynchronization. (Group<br />
)<br />
4022 Group Error Off Initialization resumed. (Group<br />
)<br />
4023 Group Error Journal full—transfer paused.<br />
To restart the transfer, first<br />
disable access to image.<br />
(Group )<br />
4024 Group Error Off Transfer restarted. (Group<br />
)<br />
4025 Group Warning Group in high load—<br />
initialization to be restarted.<br />
(Group )<br />
4026 Group Warning<br />
Off<br />
Group no longer in high load.<br />
(Group )<br />
4027 Group Error Group in high load—the journal<br />
is full. The roll to physical<br />
image is paused, and transfer<br />
is paused. (Group )<br />
4028 Group Error Off Group no longer in high load.<br />
(Group )<br />
Trigger<br />
The disk manager<br />
has a high load.<br />
The disk manager<br />
no longer has a<br />
high load.<br />
In initialization, the<br />
journal is full and<br />
a long<br />
resynchronization<br />
is not allowed.<br />
End of an<br />
initialization<br />
situation in which<br />
the journal is full<br />
and a long<br />
resynchronization<br />
was not allowed.<br />
Access to the<br />
image is enabled<br />
and the journal is<br />
full.<br />
End of a situation<br />
in which access to<br />
the image is<br />
enabled and the<br />
journal is full.<br />
The group has a<br />
high load;<br />
initialization is to<br />
be restarted.<br />
The group no<br />
longer has a high<br />
load.<br />
No space remains<br />
to which to write<br />
during roll.<br />
Journal capacity<br />
was added, or<br />
image access was<br />
disabled.<br />
E–26 6872 5688–002
Event<br />
ID<br />
Topic<br />
Table E–2. Detailed Events<br />
Level<br />
Description<br />
4040 Group Error Journal error—full sweep to be<br />
performed. (Group )<br />
4041 Group Info Group activated. (Group<br />
, RA )<br />
4042 Group Info Group deactivated. (Group<br />
, RA )<br />
4043 Group Warning Group deactivated. (Group<br />
, RA )<br />
4044 Group Error Group deactivated. (Group<br />
, RA )<br />
4051 Group Info Disabling access to image—<br />
resuming distribution. (Group<br />
)<br />
4054 Group Error Enabling access to image.<br />
(Group )<br />
4057 Group Warning Specified image was removed<br />
from the journal. Try a later<br />
image. (Group )<br />
4062 Group Info Access enabled to latest<br />
image. (Group ,<br />
Failover site )<br />
4063 Group Warning Access enabled to latest<br />
image. (Group ,<br />
Failover site )<br />
Understanding Events<br />
Trigger<br />
A journal volume<br />
error occurred.<br />
The group is<br />
replication-ready;<br />
that is, replication<br />
could take place if<br />
other factors are<br />
acceptable, such<br />
as RAs, network,<br />
and storage<br />
access.<br />
A user action<br />
deactivated the<br />
group.<br />
The system<br />
temporarily<br />
deactivated the<br />
group.<br />
The system<br />
deactivated the<br />
group indefinitely.<br />
The user disabled<br />
access to an<br />
image (that is,<br />
distribution is<br />
resumed).<br />
The system<br />
enabled access to<br />
an image<br />
indefinitely.<br />
The specified<br />
image was<br />
removed from the<br />
journal (that is,<br />
FIFO).<br />
Access was<br />
enabled to the<br />
latest image during<br />
automatic failover.<br />
Access was<br />
enabled to the<br />
latest image during<br />
automatic failover.<br />
6872 5688–002 E–27
Understanding Events<br />
Event<br />
ID<br />
Topic<br />
Table E–2. Detailed Events<br />
Level<br />
Description<br />
4064 Group Error Access enabled to latest<br />
image. (Group ,<br />
Failover site )<br />
4080 Group Warning Current lag exceeds maximum<br />
lag. (Group , Lag<br />
, Maximum lag<br />
)<br />
4081 Group Warning<br />
off<br />
Current lag within policy.<br />
(Group , Lag ,<br />
Maximum lag )<br />
4082 Group Warning Starting full sweep. (Group<br />
)<br />
4083 Group Warning Starting volume sweep. (Group<br />
, Pair )<br />
4084 Group Info Markers cleared. (Group<br />
)<br />
4085 Group Warning Unable to clear markers.<br />
(Group )<br />
4086 Group Info Initialization started. (Group<br />
)<br />
4087 Group Info Initialization completed. (Group<br />
)<br />
4091 Group Error Target-side log is full; write<br />
operations by the hosts at the<br />
target side is disabled. (Group<br />
, Site )<br />
4095 Group Info Writing target-side log to<br />
storage; writes to log cannot<br />
be undone. (Group )<br />
Trigger<br />
Access was<br />
enabled to the<br />
latest during<br />
automatic failover.<br />
The group lag<br />
exceeds the<br />
maximum lag<br />
(when not<br />
regulating an<br />
application).<br />
The group lag<br />
drops from above<br />
the maximum lag<br />
to below 90<br />
percent of the<br />
maximum.<br />
Group markers<br />
were set.<br />
Volume markers<br />
were set.<br />
Group markers<br />
were cleared.<br />
An attempt to<br />
clear the group<br />
markers failed.<br />
Initialization<br />
started.<br />
Initialization<br />
completed.<br />
The target-side log<br />
is full.<br />
Started marking to<br />
retain write<br />
operations in the<br />
target-side log.<br />
E–28 6872 5688–002
Event<br />
ID<br />
Topic<br />
Table E–2. Detailed Events<br />
Level<br />
Description<br />
4097 Group Warning Maximum journal lag<br />
exceeded. Distribution in fastforward—older<br />
images<br />
removed from journal. (Group<br />
)<br />
4098 Group Warning<br />
Off<br />
Maximum journal lag within<br />
limit. Distribution normal—<br />
rollback information retained.<br />
(Group )<br />
4099 Group Info Initializing in long<br />
resynchronization mode.<br />
(Group )<br />
4110 Group Info Enabling virtual access to<br />
image. (Group )<br />
4111 Group Info Virtual access to image<br />
enabled. (Group )<br />
4112 Group Info Rolling to physical image.<br />
(Group )<br />
4113 Group Info Roll to physical image stopped.<br />
(Group )<br />
4114 Group Info Roll to physical image<br />
complete—logged access to<br />
physical image is now enabled.<br />
(Group )<br />
Understanding Events<br />
Trigger<br />
Fast-forward<br />
action started<br />
(causing a loss of<br />
snapshots taken<br />
before as<br />
maximum journal<br />
lag was<br />
exceeded).<br />
Five minutes have<br />
passed since the<br />
fast-forward action<br />
stopped.<br />
The system<br />
started a long<br />
resynchronization.<br />
The user initiated<br />
enabling virtual<br />
access to an<br />
image.<br />
The user enabled<br />
virtual access to an<br />
image.<br />
Rolling to the<br />
image (in<br />
background) while<br />
virtual access to<br />
the image is<br />
enabled.<br />
Rolling to the<br />
image (that is, the<br />
background, while<br />
virtual access to<br />
the image is<br />
enabled) is<br />
stopped.<br />
The system<br />
completed the roll<br />
to the physical<br />
image.<br />
6872 5688–002 E–29
Understanding Events<br />
Event<br />
ID<br />
Topic<br />
Table E–2. Detailed Events<br />
Level<br />
Description<br />
4115 Group Error Unable to enable access to<br />
virtual image because of<br />
partition table error. (The<br />
partition table on at least one<br />
of the volumes in group<br />
has been modified<br />
since logged access was last<br />
enabled to a physical image. To<br />
enable access to a virtual<br />
image, first enable logged<br />
access to a physical image.)<br />
4116 Group Error Virtual access buffer is full—<br />
writing by hosts at the target<br />
side is disabled. (Group<br />
)<br />
4118 Group Error Cannot enable virtual access to<br />
an image. (Group )<br />
4119 Group Error Initiator issued an out-ofbounds<br />
I/O operation. Contact<br />
technical support. (Initiator<br />
, Group<br />
, Volume )<br />
4120 Group Warning Journal usage (with logged<br />
access enabled) now exceeds<br />
this threshold. (Group<br />
, )<br />
4121 Group Error Unable to gain permissions to<br />
write to replica.<br />
Trigger<br />
An attempt to<br />
pause on a virtual<br />
image is<br />
unsuccessful<br />
because of a<br />
change in the<br />
partition table of a<br />
volume or volumes<br />
in the group.<br />
An attempt to<br />
write to the virtual<br />
image is<br />
unsuccessful<br />
because the virtual<br />
access buffer<br />
usage is 100<br />
percent.<br />
An attempt to<br />
enable virtual<br />
access to the<br />
image is<br />
unsuccessful<br />
because of<br />
insufficient<br />
memory.<br />
A configuration<br />
problem exists.<br />
Journal usage<br />
(with logged<br />
access enabled)<br />
has passed a<br />
specified<br />
threshold.<br />
RAs unable to<br />
write to replication<br />
or journal volumes<br />
because they do<br />
not have proper<br />
permissions.<br />
E–30 6872 5688–002
Event<br />
ID<br />
Topic<br />
Table E–2. Detailed Events<br />
Level<br />
Description<br />
4122 Group Trying to regain permissions to<br />
write to replica.<br />
4123 Group Error Unable to access volumes –<br />
bad sectors encountered.<br />
4124 Group Error Off Trying to access volumes that<br />
previously had bad sectors.<br />
5000 Splitter Info Splitter or splitters are attached<br />
to a volume. (Splitter<br />
, Volume )<br />
5001 Splitter Info Splitter or splitters are<br />
detached from a volume.<br />
(Splitter , Volume<br />
)<br />
5002 Splitter Error RA is unable to access splitter.<br />
(Splitter , RA )<br />
5003 Splitter Error Off RA access to splitter is<br />
restored. (Splitter ,<br />
RA )<br />
5004 Splitter Error Splitter is unable to access a<br />
replication volume or volumes.<br />
(Splitter , Volume<br />
)<br />
5005 Splitter Error Off Splitter access to replication<br />
volume or volumes is restored.<br />
(Splitter , Volume<br />
)<br />
5006 OBSOLETE<br />
5007 OBSOLETE<br />
Understanding Events<br />
Trigger<br />
User has indicated<br />
that the<br />
permissions<br />
problem has been<br />
corrected.<br />
RAs unable to<br />
write to replication<br />
or journal volumes<br />
due to bad sectors<br />
on the storage.<br />
User has indicated<br />
that the bad<br />
sectors problem<br />
has been<br />
corrected.<br />
The user attached<br />
a splitter to a<br />
volume.<br />
The user detached<br />
a splitter from a<br />
volume.<br />
The RA is unable<br />
to access a<br />
splitter.<br />
The RA can access<br />
a splitter that was<br />
previously<br />
inaccessible.<br />
The splitter cannot<br />
access a volume.<br />
The splitter can<br />
access a volume<br />
that was<br />
previously<br />
inaccessible.<br />
6872 5688–002 E–31
Understanding Events<br />
Event<br />
ID<br />
Topic<br />
Table E–2. Detailed Events<br />
Level<br />
Description<br />
5013 Splitter Error Splitter is down. (Splitter<br />
)<br />
5015 Splitter Error Off Splitter is up. (Splitter<br />
)<br />
5016 Splitter Warning Splitter has restarted. (Splitter<br />
)<br />
5030 Splitter Error Splitter write failed. (Splitter<br />
, Group )<br />
5031 Splitter Warning Splitter is not splitting to<br />
replication volumes; volume<br />
sweeps are required. (Host<br />
, Volumes , Groups )<br />
5032 Splitter Info Splitter is splitting to replication<br />
volumes. (Host ,<br />
Volumes ,<br />
Groups (Groups)<br />
5035 Splitter Info Writes to replication volumes<br />
are disabled. (Splitter<br />
, Volumes , Groups )<br />
5036 Splitter Warning Writes to replication volumes<br />
are disabled. (Host< host>,<br />
Volumes ,<br />
Groups )<br />
5037 Splitter Error Writes to replication volumes<br />
are disabled. (Splitter<br />
, Volumes , Groups )<br />
Trigger<br />
Connection to the<br />
splitter was lost<br />
with no warning;<br />
splitter crashed or<br />
the connection is<br />
down.<br />
Connection to the<br />
splitter was<br />
regained after a<br />
splitter crash.<br />
The boot<br />
timestamp of the<br />
splitter has<br />
changed.<br />
The splitter write<br />
operation to the<br />
RA was<br />
successful; the<br />
write operation to<br />
the storage device<br />
was not<br />
successful.<br />
The splitter is not<br />
splitting to the<br />
replication<br />
volumes.<br />
The splitter started<br />
splitting to the<br />
replication<br />
volumes.<br />
Write operations<br />
to the replication<br />
volumes are<br />
disabled.<br />
Write operations<br />
to the replication<br />
volumes are<br />
disabled.<br />
Write operations<br />
to the replication<br />
volumes are<br />
disabled.<br />
E–32 6872 5688–002
Event<br />
ID<br />
Topic<br />
Table E–2. Detailed Events<br />
Level<br />
Description<br />
5038 Splitter Info Splitter delaying writes.<br />
(Splitter , Volumes<br />
, Groups<br />
)<br />
5039 Splitter Warning Splitter delaying writes.<br />
(Splitter , Volumes<br />
, Groups<br />
)<br />
5040 Splitter Error Splitter delaying writes.<br />
(Splitter , Volumes<br />
, Groups<br />
)<br />
5041 Splitter Info Splitter is not splitting to<br />
replication volumes. (Splitter<br />
, Volumes , Groups )<br />
5042 Splitter Warning Splitter is not splitting to<br />
replication volumes. (Splitter<br />
, Volumes , Groups )<br />
5043 Splitter Error Splitter not splitting to<br />
replication volumes. (Splitter<br />
, Volumes , Groups )<br />
5045 Splitter Warning Simultaneous problems<br />
reported in splitter and RA.<br />
Full-sweep resynchronization is<br />
required after restarting data<br />
transfer.<br />
5046 Splitter Warning Transient error—reissuing<br />
splitter write.<br />
Understanding Events<br />
Trigger<br />
—<br />
6872 5688–002 E–33<br />
—<br />
—<br />
The splitter is not<br />
splitting to the<br />
replication<br />
volumes because<br />
of a user decision.<br />
The splitter is not<br />
splitting to the<br />
replication<br />
volumes.<br />
The splitter is not<br />
splitting to the<br />
replication<br />
volumes because<br />
of a system action.<br />
The marking<br />
backlog on the<br />
splitter was lost as<br />
a result of<br />
concurrent<br />
disasters to the<br />
splitter and the<br />
RA.<br />
—
Understanding Events<br />
E–34 6872 5688–002
Appendix F<br />
Configuring and Using SNMP Traps<br />
The RA in the Unisys <strong>SafeGuard</strong> 30m solution is SNMP capable—that is, the solution<br />
supports monitoring and problem notification using the standard Simple Network<br />
Management Protocol (SNMP), including support for SNMPv3. The solution supports<br />
various SNMP queries to the agent and can be configured so that events generate<br />
SNMP traps, which are sent to designated servers.<br />
Software Monitoring<br />
To configure SNMP traps for monitoring, see the Unisys <strong>SafeGuard</strong> 30m Solution<br />
Planning and Installation <strong>Guide</strong>.<br />
You cannot query the RA software management information base (MIB). You can query<br />
the MIB-II. The RA SNMP agent includes MIB-II support. Also see “Hardware<br />
Monitoring.” For more information on MIB-II, see the document at<br />
http://www.faqs.org/rfcs/rfc1213.html<br />
All of the management console log events listed in Appendix E generate SNMP traps<br />
depending on the severity of the trap configuration.<br />
The Unisys MIB OID is 1.3.6.1.4.1.21658.<br />
The trap identifiers for Unisys traps are as follows:<br />
1: Info<br />
2: Warning<br />
3: Error<br />
6872 5688–002 F–1
Configuring and Using SNMP Traps<br />
The Unisys trap variables and their possible values are defined in Table F–1.<br />
Table F–1. Trap Variables and Values<br />
Variable OID Description Value<br />
dateAndTime 3.1.1.1 Date and time that the trap was<br />
sent<br />
eventID 3.1.1.2 Unique event identifier (See<br />
values in “List of Events” in<br />
Appendix E.)<br />
siteName 3.1.1.3 Name of site where event<br />
occurred<br />
eventLevel 3.1.1.4 See values 1: info<br />
2: warning<br />
3: warning off<br />
4: error<br />
5: error off<br />
eventTopic 3.1.1.5 See values 1: site<br />
2: K-Box<br />
3: group<br />
4: splitter<br />
5: management<br />
hostName 3.1.1.6 Name of host —<br />
kboxName 3.1.1.7 Name of RA —<br />
volumeName 3.1.1.8 Name of volume —<br />
groupName 3.1.1.9 Name of group —<br />
eventSummary 3.1.1.10 Short description of event —<br />
eventDescription 3.1.1.11 More detailed description of<br />
event<br />
F–2 6872 5688–002<br />
—<br />
—<br />
—<br />
—
Configuring and Using SNMP Traps<br />
SNMP Monitoring and Trap Configuration<br />
To configure SNMP traps, see the Unisys <strong>SafeGuard</strong> <strong>Solutions</strong> Planning and Installation<br />
<strong>Guide</strong>.<br />
On the management console, use the SNMP Settings menu (in the System menu) to<br />
manage the SNMP capabilities. Through that menu, you can enable and disable the<br />
agent or the SNMP traps feature, modify the configuration for SNMP traps, and add or<br />
remove SNMP users.<br />
In addition, the RA provides several CLI commands for SNMP, as follows:<br />
• The enable_snmp command to enable the SNMP agent<br />
• The disable_snmp command to disable the SNMP agent<br />
• The set_snmp_community command to define a community of users (for SNMPv1)<br />
• The add_snmp_user command to add SNMP users (for SNMPv3)<br />
• The remove_snmp_user command to remove SNMP users (for SNMPv3)<br />
• The get_snmp_settings command to display whether the agent is currently set to be<br />
enabled, the current configuration for SNMP traps, and the list of registered SNMP<br />
users<br />
• The config_snmp_traps command to configure the SNMP traps feature so that<br />
events generate traps. Before you enable the feature, you must designate the IP<br />
address or DNS name for a host at one or more sites to receive the SNMP traps.<br />
Note: You can designate a DNS name for a host only in installations for which a<br />
DNS has been configured.<br />
• The test_snmp_trap command to send a test SNMP trap<br />
When the SNMP agent is enabled, SNMP users can submit queries to retrieve various<br />
types of information about the RA.<br />
You can also designate the minimum severity for which an event should generate an<br />
SNMP trap (that is, info, warning, or error in order from less severe to more severe with<br />
error as the initial default). Once the SNMP traps feature is enabled, the system sends<br />
an SNMP trap to the designated host whenever an event of sufficient severity occurs.<br />
Installing MIB Files on an SNMP Browser<br />
Install the RA MIB file (\MIBS\mib.txt on the Unisys <strong>SafeGuard</strong> <strong>Solutions</strong> Splitter Install<br />
Disk CD-ROM) on an SNMP browser. Follow the instructions for your browser to load<br />
the MIB file.<br />
6872 5688–002 F–3
Configuring and Using SNMP Traps<br />
Resolving SNMP Issues<br />
For SNMP issues, first determine whether the issue is an SNMP trap or an SNMP<br />
monitoring issue by performing the procedure for verifying SNMP traps in the Unisys<br />
<strong>SafeGuard</strong> <strong>Solutions</strong> Planning and Installation <strong>Guide</strong>.<br />
If you do not receive traps, perform the steps in “Monitoring Issues” and then in “Trap<br />
Issues.”<br />
Monitoring Issues<br />
Trap Issues<br />
1. Ping the RA management IP address from the management server that has the<br />
SNMP browser.<br />
2. Ensure that the community name used on the RA configuration matches the<br />
management server running the SNMP browser (version 1 and 2). Use public as a<br />
community name.<br />
3. Ensure that the user and password used on the RA configuration matches the<br />
management server running the SNMP browser (version 3).<br />
1. Ensure that the trap destination is on the same network as the management<br />
network and that a firewall has not blocked SNMP traffic.<br />
2. Ensure that the same version of SNMP is configured in the management software<br />
that receives traps.<br />
F–4 6872 5688–002
Appendix G<br />
Using the Unisys <strong>SafeGuard</strong> 30m<br />
Collector<br />
The Unisys <strong>SafeGuard</strong> 30m Collector utility enables you to easily collect information<br />
about the environment so that you can solve problems. An enterprise solution requires<br />
many logs, and gathering the log information can be time intensive. Often the person<br />
who collects the information is not familiar with all the interfaces to the hardware. The<br />
Collector solves these problems. An experienced installer configures log collection one<br />
time, and then other personnel can use a “one-button” approach to log collection.<br />
You can use this utility to create custom scripts to complete tasks tailored to your<br />
environment. You choose which CLI commands to include in the custom scripts so that<br />
you build the capabilities you need. Refer to the Unisys <strong>SafeGuard</strong> <strong>Solutions</strong> Introduction<br />
to Replication Appliance Command Line Interface (CLI) for more information about CLI<br />
commands.<br />
The Collector gathers configuration information from RAs, storage subsystems, and<br />
switches. No information is collected from the servers in the environment.<br />
Installing the <strong>SafeGuard</strong> 30m Collector<br />
This utility offers two modes: Collector and View. You determine the available modes<br />
when you install the program. If you install the Collector and specify Collector mode,<br />
both modes are enabled. If you install the Collector and specify View mode, the Collector<br />
mode functions are disabled. The View mode is primarily used by support personnel at<br />
the Unisys <strong>Support</strong> Center.<br />
If you are installing the Collector at a customer installation, be sure to install the utility on<br />
PCs at both sites.<br />
The utility requires .NET Framework 2.0 and J# redistributable, which are on the Unisys<br />
<strong>SafeGuard</strong> 30m Solution Control Install Disk CD-ROM in the Redistributable folder.<br />
The directories under this folder are dotNet Framework 2.0 and JSharp.<br />
6872 5688–002 G–1
Using the Unisys <strong>SafeGuard</strong> 30m Collector<br />
Notes:<br />
• The readme file on that CD-ROM contains the same information as this appendix.<br />
• If you installed a previous version of the Collector, uninstall this utility and remove<br />
the folder and all of the files in the folder before you begin this installation.<br />
Perform the following steps to install the Collector:<br />
1. Insert the CD-ROM in the CD/DVD drive, and start the file Unisys <strong>SafeGuard</strong> 30m<br />
Collector.msi.<br />
2. On the Installation Wizard welcome screen, click Next.<br />
3. On the Customer Information screen, type the user name and organization, and<br />
click Next.<br />
4. On the Destination Folder screen, select a destination folder and click Next.<br />
Note: If you are using the Windows Vista operating system, install the Collector<br />
into a separate directory named C:\Unisys\30m\Collector.<br />
5. On the Select Options: screen, select Collector mode –install at site or<br />
select View mode –install at support center, and then click Next.<br />
6. On the Ready to Install the Program screen, click Install.<br />
The Installation wizard begins installing the files, and the Installing Unisys<br />
<strong>SafeGuard</strong> 30m Collector screen is displayed to indicate the status of the<br />
installation.<br />
After the files are installed, the Installation Wizard Completed screen is<br />
displayed.<br />
7. Click Finish.<br />
Before You Begin the Configuration<br />
Before you begin configuring the Collector, be sure you have the following information:<br />
• IP addresses<br />
− SAN switches<br />
− Network switches<br />
− RA site management<br />
• Log-in names<br />
− SAN switches<br />
− Network switches<br />
− RA (for custom scripts only)<br />
G–2 6872 5688–002
Using the Unisys <strong>SafeGuard</strong> 30m Collector<br />
• Passwords<br />
− SAN switches<br />
− Network switches<br />
− RA (for custom scripts only)<br />
• EMC Navisphere CLI<br />
− Storage<br />
• Autologon configuration<br />
− SAN switches (Consult your SAN switch documentation for the autologon<br />
configuration.)<br />
If you are using a Cisco SAN switch, enable the SSH server before you begin the<br />
configuration. See “Configuring RA, Storage, and SAN Switch Component Types Using<br />
Built-Ins” in this appendix.<br />
Handling the Security Breach Warning<br />
If you previously installed the Collector and have uninstalled the utility and all the files,<br />
when you begin configuring RAs or adding RAs, you might get this message:<br />
WARNING – POTENTIAL SECURITY BREACH!<br />
If you receive this message, complete these steps:<br />
1. Delete the IP address for the RA.<br />
2. Use the following plink command:<br />
C:\>plink -l admin -pw admin get_version<br />
Messages about the host key and a new key are displayed.<br />
3. Type Y in response to the message “Update cached key?”<br />
Once you have updated the cached key, complete the steps in “Configuring RAs” to<br />
discover the IP addresses for the RAs.<br />
6872 5688–002 G–3
Using the Unisys <strong>SafeGuard</strong> 30m Collector<br />
Using Collector Mode<br />
Installing the utility in Collector mode enables all the capabilities to gather log information<br />
using scripts and also enables View mode.<br />
Getting Started<br />
To access the Collector, follow these steps:<br />
1. On the Start menu, point to Programs, then click Unisys, then click <strong>SafeGuard</strong><br />
30m Collector; and click <strong>SafeGuard</strong> 30m Collector.<br />
2. Select the Components.ssc file on the Open Unisys <strong>SafeGuard</strong> 30m Collector<br />
File dialog box.<br />
The Unisys <strong>SafeGuard</strong> 30m Collector program window is displayed with two panes<br />
open.<br />
Configuring RAs<br />
To collect data, specify the site management IP address of either of the RA clusters for a<br />
site. The “built-in” scripts are a preconfigured set of CLI commands that facilitate easy<br />
data collection.<br />
The other site management IP address is automatically discovered when you specify<br />
either of the RA site management addresses.<br />
To configure the RA, perform these steps:<br />
1. Start the Collector.<br />
2. If needed, expand the Components tree in the left pane.<br />
3. Select BI Built-In (under RA), right-click, and click Copy Built-In (Discover RA).<br />
4. On the Script dialog box, type the RA site management IP address in the IP<br />
Address field and click Save.<br />
If you have multiple <strong>SafeGuard</strong> solutions, repeat steps 3 and 4 for each set of RA<br />
clusters.<br />
After you enter the IP address, the Collector window is updated with the folder of each<br />
site management IP address appearing below the RA folder. Each IP folder contains the<br />
built-in scripts that are enabled.<br />
The following sample window shows the IP address folders listed in the left pane. In this<br />
figure, two <strong>SafeGuard</strong> solutions are configured—the set of IP addresses (172.16.17.50<br />
and 172.16.17.60) for the two RA clusters in solution 1 and the IP address 172.16.7.50<br />
for the continuous data protection (CDP) solution, which always has only one RA cluster.<br />
G–4 6872 5688–002
Adding Customer Information<br />
Using the Unisys <strong>SafeGuard</strong> 30m Collector<br />
Add information about the Unisys service representative, customer, and architect so that<br />
the Unisys <strong>Support</strong> Center can contact the site easily. To add the information, perform<br />
the following steps on the Unisys <strong>SafeGuard</strong> 30m Collector program window.<br />
1. On the File menu, click Properties.<br />
2. On the Properties dialog box, select the appropriate tab: Customer, Architect,<br />
or CIR.<br />
3. Type in the information for each field on each tab. (For instance, type text in the<br />
Name, Office, Mobile, E-mail, and Additional Info fields for the CIR tab.)<br />
The Architect tab provides an Installed Date field. Use the Additional Info field for any<br />
other information that the Unisys <strong>Support</strong> Center might need, such as a support<br />
request number.<br />
4. Click OK.<br />
6872 5688–002 G–5
Using the Unisys <strong>SafeGuard</strong> 30m Collector<br />
Running All Scripts<br />
To collect data from all enabled scripts in a <strong>SafeGuard</strong> <strong>Solutions</strong> Components (SSC) file,<br />
perform these steps on the Unisys <strong>SafeGuard</strong> 30m Collector program window.<br />
1. Select Components.<br />
2. Right-click, and click Run, or click the Run button.<br />
Note: The status bar shows the progress of script executions and the amount of data<br />
collected.<br />
Compressing an SSC File to Send to the <strong>Support</strong> Center<br />
Once you run the utility to collect information, you can compress the SSC file to send to<br />
the Unisys <strong>Support</strong> Center.<br />
Note: A Collector components file has the .ssc suffix. Once an SSC file is compressed,<br />
the corresponding <strong>SafeGuard</strong> <strong>Solutions</strong> Data (SSD) file has the .ssd suffix.<br />
On the Unisys <strong>SafeGuard</strong> 30m Collector program window, follow these steps to<br />
compress an SSC file:<br />
1. Click Compress SSC on the File menu.<br />
Once the file is compressed, the file name and path are displayed at the top in the<br />
right pane of the window. The data is exported to the file named Components.ssd in<br />
the directory C:\Program Files\Unisys\30m\Collector\Data.<br />
Note: For the Microsoft Vista operating system, the SSD file resides in the<br />
directory where the Collector is installed. A typical location for this file is<br />
C:\Unisys\30m\Collector\Components.ssd.<br />
2. Send the SSD file to the Unisys <strong>Support</strong> Center at<br />
Safeguard30msupport@unisys.com.<br />
Duplicating the Installation on Another PC<br />
To duplicate the installation of the Collector at a different PC (for example, on the second<br />
site), perform these steps:<br />
1. Copy the SSD file from the PC with the installed Collector to the second PC, placing<br />
it in the C:\Program Files\Unisys\30m\Collector\Data directory.<br />
2. Start the Collector.<br />
3. Click Cancel on the Open Unisys <strong>SafeGuard</strong> 30m Collector File dialog box.<br />
The Unisys <strong>SafeGuard</strong> 30m Collector program window is displayed.<br />
Note: Once an SSD file is extracted, you can select the .ssc file.<br />
4. On the File menu, select Uncompress SSD.<br />
G–6 6872 5688–002
Using the Unisys <strong>SafeGuard</strong> 30m Collector<br />
5. On the Open <strong>SafeGuard</strong> 30m Data File dialog box, select from the list of<br />
available files the SSD file that you wish to uncompress.<br />
If a message appears asking about overwriting the SSC file, click Yes.<br />
6. Ensure that all scripts run from this PC by selecting each component type and<br />
running the scripts for each component.<br />
Understanding Operations in Collector Mode<br />
The Components.ssc file contains the configuration information. If you make changes to<br />
the Components.ssc file—such as adding, deleting, editing, enabling, and disabling<br />
scripts—these changes are automatically saved. You can also make these changes to a<br />
saved SSC file except that you cannot delete scripts from a saved SSC file. You must<br />
open the Components.ssc file to delete scripts.<br />
Understanding and Saving SSC Files<br />
Because you can enable and disable scripts in any SSC file, you can create saved SSC<br />
files for specific uses. If you want to run a subset of the available scripts, save the<br />
Components.ssc file as a new SSC file with a unique name. You can then enable or<br />
disable scripts in the saved SSC file. The saved SSC file is always updated from the<br />
Components.ssc file for information such as the available scripts and the details within<br />
each script. In addition, all changes that are made to any SSC file are updated in the<br />
Components.ssc file. Only scripts that were enabled in the saved SSC file are enabled<br />
when updated from a Components.ssc file.<br />
For example, you could save an SSC file with all RAs except one disabled. You might<br />
name it “radisabled.ssc”. If you have the radisabled.ssc file open and add a new script to<br />
it, the script is automatically added to the Components.ssc file.<br />
Whenever the Components.ssc file is updated with a new script, that script is<br />
automatically added to any saved SSC files.<br />
If you add a new RA to the configuration, the Components.ssc file and any existing<br />
saved SSC files are updated with the component and its scripts are disabled.<br />
If you make deletions to the Components.ssc file, the deletions are automatically<br />
removed from any saved SSC files.<br />
6872 5688–002 G–7
Using the Unisys <strong>SafeGuard</strong> 30m Collector<br />
Sample Scenario<br />
If you want to collect data at one site only or if you want to view the data from one site,<br />
you can create a new saved SSC file for each site. Follow these steps to create the<br />
saved SSC files.<br />
1. Add any desired scripts to the Components.ssc file.<br />
2. Open an SSC file.<br />
3. Click Save As on the File menu, and enter a unique name for the file.<br />
4. Enable and disable scripts as desired.<br />
For example, you might disable one site. To do so, follow these steps:<br />
a. Select the IP address of a component (perhaps Site 1 RA cluster management<br />
IP.)<br />
b. Right-click and click Disable.<br />
Repeat steps 2 through 4 to create additional customized files.<br />
Opening an SSC File<br />
On the Unisys <strong>SafeGuard</strong> 30m Collector program window, perform the following steps<br />
to open an SSC file:<br />
1. Click Open on the File menu.<br />
2. Select an SSC file and click Open.<br />
Configuring RA, Storage, and SAN Switch Component Types Using<br />
Built-In Scripts<br />
The built-in scripts are preconfigured; they contain CLI commands for RAs, navicli<br />
commands for Clariion storage, and CLI commands for switches that facilitate easy data<br />
collection. It takes about 4 minutes for the built-in scripts for one RA to run and about 2<br />
minutes for the built-in scripts for a SAN switch to run.<br />
After you configure built-in scripts, the left pane is updated with the IP addresses below<br />
the component type. Each IP folder contains the built-in scripts that are enabled.<br />
See the previous sample window with the IP address folders listed in the left pane. In<br />
that figure, two <strong>SafeGuard</strong> solutions are configured—the set of IP addresses<br />
(172.16.17.50 and 172.16.17.60) for the two RA clusters and the IP address 172.16.7.50<br />
for the continuous data protection (CDP) setup, which always has only one RA cluster.<br />
G–8 6872 5688–002
Using the Unisys <strong>SafeGuard</strong> 30m Collector<br />
On the Unisys <strong>SafeGuard</strong> 30m Collector program window, follow these steps to use<br />
built-in scripts to configure RA, Storage, and SAN Switch component types:<br />
1. Expand a component type—RA, Storage, or SAN Switch—and select BI Built-<br />
In.<br />
2. Right-click and click Copy Built-In.<br />
3. On the Script dialog box, complete the available fields and click Save.<br />
Note: You can select one script instead of all scripts by selecting a script name instead<br />
of selecting BI-Built-In.<br />
For the RA Component Type<br />
To collect data, specify the site management IP address of either of the RA clusters for a<br />
site. The other site management IP address is automatically discovered when you<br />
specify either of the RA site management addresses.<br />
If you have multiple <strong>SafeGuard</strong> solutions, repeat the three previous steps for each set of<br />
RA clusters.<br />
For the Storage Component Type<br />
Clariion is the only storage component with built-in scripts available.<br />
For the SAN Switch Component Type<br />
Before configuring a Cisco SAN switch, enter config mode on the switch and type #ssh<br />
server enable. To determine the state of the SSH server, type show ssh server<br />
when not in config mode. Refer to the Cisco MDS 9020 Fabric Switch Configuration<br />
<strong>Guide</strong> and Command Reference for more information about switch commands.<br />
If you run the tech-support command under SAN Switch from the Collector, the data<br />
capture might take a long time. You can follow the progress in the status bar of the<br />
window.<br />
If you run commands for a Brocade switch and receive the following message, the<br />
Brocade switch is downlevel and does not support the SSH protocol:<br />
rbash: switchShow: command not found<br />
Upgrade the switch software to a later version that supports the SSH protocol.<br />
6872 5688–002 G–9
Using the Unisys <strong>SafeGuard</strong> 30m Collector<br />
Enabling Scripts<br />
You can interactively enable all the scripts in any SSC file, the scripts for one component<br />
in the SSC file, or a single script. To enable a disabled script, you must open the SSC file<br />
containing the script. Perform the following steps on the Unisys <strong>SafeGuard</strong> 30m<br />
Collector program window.<br />
Enable All Scripts<br />
1. Select Components.<br />
2. Right-click and click Enable.<br />
Enabled scripts are shown in green.<br />
Enable Scripts for One Component<br />
1. Select the IP address of the component.<br />
2. Right-click and click Enable.<br />
Enabled scripts are shown in green.<br />
Enable a Single Script<br />
1. Select the script name.<br />
2. Right-click and click Enable.<br />
The enabled script is shown in green.<br />
Disabling Scripts<br />
You can interactively disable all the scripts in any SSC file, the scripts for one component<br />
in the SSC file, or a single script. Perform the following steps on the Open Unisys<br />
<strong>SafeGuard</strong> 30m Collector program window.<br />
Disable All Scripts<br />
1. Select Components.<br />
2. Right-click and click Disable.<br />
Disabled scripts are shown in red.<br />
Disable Scripts for One Component<br />
1. Select the IP address of the component.<br />
2. Right-click and click Disable.<br />
Disabled scripts are shown in red.<br />
Disable a Single Script<br />
1. Select the script name.<br />
2. Right-click and click Disable.<br />
The disabled script is shown in red.<br />
G–10 6872 5688–002
Running Scripts<br />
Using the Unisys <strong>SafeGuard</strong> 30m Collector<br />
You can interactively run all the scripts in any SSC file; the scripts for one component<br />
type such as RA, Storage, SAN Switch, or Other; the scripts for one component in the<br />
SSC file; or a single script.<br />
Note: You can use the Run button on the Collector toolbar or the Run command in the<br />
following procedures.<br />
Perform the following steps on the Unisys <strong>SafeGuard</strong> 30m Collector program window.<br />
Run All Scripts<br />
1. Select Components.<br />
2. Right-click and click Run.<br />
Run Scripts for One Component Type<br />
1. Select a component type—RA, Storage, SAN Switch, or Other.<br />
2. Right-click and click Run.<br />
The status of the executing scripts is displayed in the right pane. The status bar<br />
shows the component type that is running, the IP address, the script name, and<br />
instructions for halting script execution. A progress bar indicates that the Collector is<br />
running the script and shows the amount of data being captured by the script. Once<br />
script execution completes, the status bar shows the last script run.<br />
Run Scripts for One Component<br />
1. Select either the IP address or custom-named component.<br />
2. Right-click and click Run.<br />
The status of the executing scripts is displayed in the right pane. The status bar<br />
shows the component type that is running, the IP address, the script name, and<br />
instructions for halting script execution. A progress bar indicates that the Collector is<br />
running the script and shows the amount of data being captured by the script. Once<br />
script execution completes, the status bar shows the last script run.<br />
Run a Single Script<br />
1. Select a script name.<br />
2. Right-click and click Run.<br />
The status of the executing scripts is displayed in the right pane. The status bar<br />
shows the component type that is running, the IP address, the script name, and<br />
instructions for halting script execution. A progress bar indicates that the Collector is<br />
running the script and shows the amount of data being captured by the script. Once<br />
script execution completes, the status bar shows the last script run.<br />
Stopping Script Execution<br />
To stop a script while it is executing, click Stop on the Collector toolbar. All scripts that<br />
have been stopped are marked with a green X. The status of the stopped script is<br />
displayed in the right pane.<br />
6872 5688–002 G–11
Using the Unisys <strong>SafeGuard</strong> 30m Collector<br />
Deleting Scripts<br />
You can interactively delete scripts only in the Components.ssc file. Perform the<br />
following steps on the Unisys <strong>SafeGuard</strong> 30m Collector program window.<br />
Delete Scripts for One Component<br />
1. Select the IP address or custom-named component.<br />
2. Right-click and click Delete.<br />
Delete a Single Script<br />
1. Expand an IP address or a custom-named component; then select a script name.<br />
2. Right-click and click Delete.<br />
Adding Scripts for RA, Storage, and SAN Switch Component Types<br />
You can interactively add custom scripts to any SSC file by copying an existing script or<br />
by specifying a new script. Perform the following steps on the Unisys <strong>SafeGuard</strong> 30m<br />
Collector program window.<br />
Add New Script for a Component Type<br />
1. Select a component type—RA, Storage, or SAN Switch.<br />
2. Right-click and click New.<br />
3. Complete the script form.<br />
4. Click Save.<br />
Add a New Script Based on an Existing Custom Script<br />
1. Select a script name.<br />
2. Right-click and click New.<br />
3. Complete the form. Change the script name and the command.<br />
4. Click Save.<br />
Adding Scripts for the Other Component Type<br />
Perform the following steps on the Unisys <strong>SafeGuard</strong> 30m Collector program window.<br />
1. Select the component type Other.<br />
2. Right-click and click New.<br />
3. On the Select Program dialog box, navigate to the appropriate directory and<br />
choose the file to run. Then click Open.<br />
4. On the Script dialog box, type a component name in the Component field.<br />
5. Type a unique name for the script in the Script Name field.<br />
6. Review the selected file name that is displayed in the Command field. Modify the<br />
file name as necessary.<br />
G–12 6872 5688–002
Using the Unisys <strong>SafeGuard</strong> 30m Collector<br />
The following example illustrates using a custom component (adding a new script as<br />
shown in the previous procedure) to mount and unmount drives.<br />
Note: In this example, the Collector must be installed on the server with the kutils<br />
utility installed or with the stand-alone kutils utility installed.<br />
C:\batch_File\mount_r.bat<br />
%This command, when run, mounts the specified drive<br />
Echo ON<br />
cd c:\program files\kdriver\kutils<br />
kutils.exe umount r:<br />
kutils.exe mount r:<br />
echo "Finished"<br />
C:\batch_File\unmount_r.bat<br />
%This command, when run, unmounts the specified drive<br />
cd c:\program files\kdriver\kutils<br />
kutils.exe flushedFS r:<br />
kutils.exe unmount r:<br />
Scheduling an SSC File<br />
Perform the following steps on the Unisys <strong>SafeGuard</strong> 30m Collector program window.<br />
1. Click Schedule on the menu bar.<br />
2. On the Schedule Unisys <strong>SafeGuard</strong> 30m Collector File dialog box, enter the<br />
information required for each field as follows:<br />
a. Type the password.<br />
b. Type the date and start time.<br />
c. Select a Perform task option, which determines how often the schedule runs.<br />
d. Enter the end date if shown. (You do not need an end date for a Perform task of<br />
Once.)<br />
3. Click Select.<br />
4. On the Select Unisys <strong>SafeGuard</strong> 30m Collector dialog box, select the<br />
appropriate SSC file for which you wish to run the schedule, and then click Open.<br />
The Schedule Unisys <strong>SafeGuard</strong> 30m Collector File dialog box is again<br />
displayed. The Collector opens the selected SSC file as the current SSC file.<br />
5. Click Add.<br />
6. Click Exit.<br />
Note: You can create one schedule for an SSC file. To create additional schedules,<br />
create additional SSC files with the desired scripts enabled. The resultant scheduled data<br />
is appended to any current data (if available). For example, if you run the Collector using<br />
Windows Scheduler three times, three outputs are displayed in the right pane one after<br />
another with the timestamps for each.<br />
6872 5688–002 G–13
Using the Unisys <strong>SafeGuard</strong> 30m Collector<br />
Querying a Scheduled SSC File<br />
Perform the following steps on the Unisys <strong>SafeGuard</strong> 30m Collector program window.<br />
1. Click Schedule from the menu bar.<br />
2. On the Schedule Unisys <strong>SafeGuard</strong> 30m Collector File dialog box, click<br />
Query.<br />
3. On the Tasks window, select the task name that is the same as the scheduled SSC<br />
file.<br />
4. Right-click and click Properties.<br />
5. View the details of the scheduled task in the window; then click OK to close the<br />
task Properties window.<br />
6. Close the Tasks window and then select the Schedule Unisys <strong>SafeGuard</strong> 30m<br />
Collector window.<br />
7. Click Exit.<br />
Note: For the Microsoft Vista operating system, if you want to see the scheduled task<br />
after scheduling a task, click Query on the Schedule Unisys <strong>SafeGuard</strong> 30m<br />
Collector File dialog box. The Vista Microsoft Management Control (mmc) window is<br />
displayed. Press F5 to see the scheduled task.<br />
Deleting a Scheduled SSC File<br />
Perform the following steps on the Unisys <strong>SafeGuard</strong> 30m Collector program window.<br />
1. Select Schedule from the menu bar.<br />
2. On the Schedule Unisys <strong>SafeGuard</strong> 30m Collector File dialog box, click<br />
Query.<br />
3. On the Tasks window, select the task name that is the same as the scheduled SSC<br />
file.<br />
4. Right-click and click Delete.<br />
5. Close the Tasks window and then select the Schedule Unisys <strong>SafeGuard</strong> 30m<br />
Collector window.<br />
6. Click Exit.<br />
G–14 6872 5688–002
Using View Modde<br />
6872 5688–002<br />
If you installed the Collector in View mode, the support personnel at the<br />
Unisys <strong>Support</strong><br />
Center can use Vieww<br />
Mode to view the information. To access the Collector,<br />
follow<br />
these steps:<br />
1. Start the Collecctor.<br />
2. On the Open UUnisys<br />
<strong>SafeGuard</strong> 30m Collector File dialog box, b click Cancel.<br />
The Unisys <strong>SafeGuard</strong><br />
30m Collector program window is displayed d.<br />
Note: Once aan<br />
SSD file is extracted, you can select the . ssc file.<br />
3. On the File meenu,<br />
click Uncompress SSD.<br />
4. On the Open S<strong>SafeGuard</strong><br />
30m Data File dialog box, select from m the list of<br />
available files thhe<br />
SSD file that you wish to uncompress.<br />
5. In View mode, expand the components tree and then expand a com mponent type:<br />
RA, Storage, SAN Switch, or Other.<br />
6. Click a script naame<br />
from those displayed to view the data collected d from that script.<br />
The data is dispplayed<br />
in the right pane.<br />
The following figure<br />
displays a sample of View mode with data disp played in the right<br />
pane.<br />
7. On the File meenu,<br />
click Exit.<br />
Using the Unisys <strong>SafeGuard</strong> d 30m Collector<br />
G–15
Using the Unisys <strong>SafeGuard</strong> 30m Collector<br />
G–16 6872 5688–002
Appendix H<br />
Using kutils<br />
Usage<br />
The server-based kutils utility enables you to manage host splitters across all platforms.<br />
This utility is installed automatically when you install the Unisys <strong>SafeGuard</strong> 30m splitter<br />
on a host machine. When the splitting function is performed by an intelligent fabric<br />
switch, you can install a stand-alone version of the kutils utility separately on host<br />
machines.<br />
For details on the syntax and use of the ktuils commands, see the Unisys <strong>SafeGuard</strong><br />
<strong>Solutions</strong> Replication Appliance Administrator’s <strong>Guide</strong>.<br />
A kutils command is always introduced with the kutils string. If you enter the string<br />
independently—that is, without any parameters—the ktuils utility returns usages notes,<br />
as follows:<br />
C:\program files\kdriver\kutils>kutils<br />
Usage: kutils <br />
Path Designations<br />
You can designate the path to a device in the following ways:<br />
• Device path example<br />
“SCSI\DISK&VEN_KASHYA&PROD_MASTER_RIGHT&REV_0001\5&133EF78A&0&000”<br />
• Storage path example<br />
“SCSI#DISK&VEN_KASHYA&PROD_MASTER_RIGHT&REV_0001#5&133EF78A&0&000#{53<br />
f56307-b6bf-11d0-94f2-00a0c91efb8b}”<br />
• Volume path example<br />
“\\?\Volume{33b4a391-26af-11d9-b57b-505054503030}”<br />
Each command notes the particular designation to use. In addition, some commands,<br />
such as showDevices and showFS, return the symbolic link for a device. The symbolic<br />
link generally provides additional information about the characteristics of the specific<br />
devices.<br />
6872 5688–002 H–1
Using kutils<br />
The following are examples of symbolic links:<br />
“\Device\0000005c”<br />
“\Device\EmcPower\Power2”<br />
“\Device\Scsi\q123001Port2Path0Target0Lun2”<br />
Command Summary<br />
The kutils utility offers the following commands:<br />
• disable: Removes host access to the specified device or volume (Windows only).<br />
• enable: Restores host access to a specified device or volume (Windows only).<br />
• flushFS: Initiates an operating system flush of the file system (Windows only).<br />
• manage_auto_host_info_collection: Indicates whether the automatic host<br />
information collection is enabled or disabled, or enables or disables automatic host<br />
information collection.<br />
• mount: Mounts a file system (Windows only).<br />
• rescan: Scans storage for all existing disks (Windows only).<br />
• showDevices: Presents a list of physical devices to which the host has access,<br />
providing (as available) the device path, storage path, and symbolic link for each<br />
device (Windows only).<br />
• showFS: Presents the drive designation and, as available, the device path, storage<br />
path, and symbolic link for each mounted physical device (Windows only).<br />
• show_vol_info: Presents information on the specified volume, including: the Unisys<br />
<strong>SafeGuard</strong> 30m solution name (if “created” in Unisys <strong>SafeGuard</strong> <strong>Solutions</strong>), size, and<br />
storage path.<br />
• show_vols: Presents information on all volumes to which the host has access<br />
including: the Unisys <strong>SafeGuard</strong> 30m solution name (if “created” in Unisys<br />
<strong>SafeGuard</strong> <strong>Solutions</strong>), size, and storage path<br />
• sqlRestore: Restores an image previously created by the sqlSnap command<br />
(Windows only)<br />
• sqlSnap: Performs a VDI-based SQL Server image (Windows only).<br />
• start: Resumes the splitting of write operations.<br />
• stop: Discontinues the splitting of write operations to an RA (that is, places the host<br />
splitter in pass-through mode in which data is written to storage only).<br />
• umount: Unmounts the file system (Windows only).<br />
H–2 6872 5688–002
Appendix I<br />
Analyzing Cluster Logs<br />
Samples of cluster log messages for problems and situations are listed throughout this<br />
guide. You can search on text strings from cluster log messages to find specific<br />
references.<br />
The information gathered in cluster logs is critical in determining the cause of a given<br />
cluster problem. Without the diagnostic information from the cluster logs, you might find<br />
it difficult to determine the root cause of a cluster problem.<br />
This appendix provides information to help you use the cluster log as a diagnostic tool.<br />
Introduction to Cluster Logs<br />
The cluster log is a text log file updated by the Microsoft Cluster Service (MSCS) and its<br />
associated cluster resource. The cluster log contains diagnostic messages about cluster<br />
events that occur on an individual cluster member or node. This file provides more<br />
detailed information than the cluster events written in the system event log.<br />
A cluster log reports activity for one node. All member nodes in a cluster perform as a<br />
single unit. Therefore, when a problem occurs, it is important to gather log information<br />
from all member nodes in the cluster. This information gathering is typically done using<br />
the Microsoft MPS Report Utility. Gather the information immediately after a problem<br />
occurs to ensure cluster log data is not overwritten.<br />
By default, the cluster log name and location are as follows:<br />
• C:\Winnt\Cluster\cluster.log<br />
Note: For windows 2003 cluster.log file is located in the following path:<br />
C:\WINDOWS\Cluster<br />
• Captured with MPS Report Utility: _Cluster.log<br />
6872 5688–002 I–1
Analyzing Cluster Logs<br />
Creating the Cluster Log<br />
In Windows 2000 Advanced Server and Windows 2000 Datacenter Server, by default,<br />
cluster logging is enabled on all nodes. You can define the characteristics and behavior of<br />
the cluster log with system environment variables.<br />
To access the system environment variables, perform the following actions:<br />
1. In Control Panel, double-click System.<br />
2. Select the Advanced tab.<br />
3. Click Environment Variables.<br />
You can get additional information regarding the system environment variables in<br />
Microsoft Knowledge Base article 16880, “How to Turn On Cluster Logging in Microsoft<br />
Cluster Server” at this URL:<br />
http://support.microsoft.com/default.aspx?scid=kb;en-us;168801<br />
The default cluster settings are listed in Table I–1. Some parameters might not be listed<br />
when viewing the system environment variables. If a variable is not listed, its default<br />
value is still in effect.<br />
Table I–1. System Environment Variables Related to Clustering<br />
Variable Name Default Setting Comment<br />
ClusterLog %SystemRoot%<br />
\Cluster\Cluster.log<br />
Determines the location and name<br />
of cluster log file.<br />
ClusterLogSize 8 MB Determines the size of the cluster<br />
log. The default size is usually not<br />
large enough to retain history on<br />
enterprise systems. The<br />
recommended setting is 64 MB.<br />
ClusterLogLevel 2 Sets the level of detail for log<br />
entries, as follows:<br />
0 = No logging<br />
1 = Errors only<br />
2 = Errors and Warnings<br />
3 = Everything that occurs<br />
Used only with the /debug<br />
parameter on MSCS startup.<br />
Review Microsoft Knowledge Base<br />
article 258078 for more information<br />
about using the /debug parameter.<br />
I–2 6872 5688–002
Analyzing Cluster Logs<br />
Table I–1. System Environment Variables Related to Clustering<br />
Variable Name Default Setting Comment<br />
ClusterLogOverwrite<br />
Note: By default, the<br />
ClusterLogOverwrite setting is<br />
disabled. Unisys recommends that<br />
this setting remain disabled. When<br />
this setting is enabled, all cluster<br />
log history is lost if MSCS is<br />
restarted twice in succession.<br />
Understanding the Cluster Log Layout<br />
Process ID<br />
Thread ID<br />
Date<br />
GMT<br />
0 Determines whether a new cluster<br />
log is to be created when MSCS<br />
starts.<br />
0 = Disabled<br />
1 = Enabled<br />
Figure I–1 illustrates the layout of the cluster log. The paragraphs following the figure<br />
explain the various parts of the layout.<br />
Figure I–1. Layout of the Cluster Log<br />
The process ID is the process number assigned by the operating system to a service or<br />
application.<br />
The thread ID is a thread of a particular process. A process typically has multiple threads<br />
listed. Within a large cluster log, it is particularly useful to search by thread ID to find the<br />
messages related to the same thread.<br />
The date listed is the date of the entry. You can use this date to match the date of the<br />
problem in the system event log.<br />
The time entered in the Windows 2000 cluster log is always in Greenwich Mean Time<br />
(GMT). The format of the entry is HH:MM:SS.SSS. The SS.SSS entry represents<br />
seconds carried out to the thousandths of a second. There can be multiple .SSS entries<br />
for the same thousandth of a second. Therefore, there can be more than 999 cluster log<br />
entries vsn exist for any given second.<br />
6872 5688–002 I–3
Analyzing Cluster Logs<br />
Cluster Module<br />
Table I–2 lists the various modules of MSCS. These module names are logged within<br />
square brackets in the cluster log.<br />
Table I–2. Modules of MSCS<br />
API API <strong>Support</strong><br />
ClMsg Cluster messaging<br />
ClNet Cluster network engine<br />
CP Checkpoint Manager<br />
CS Cluster service<br />
DM Database Manager<br />
EP Event Processor<br />
FM Failover Manager<br />
GUM Global Update Manager<br />
INIT Initialization<br />
JOIN Join<br />
LM Log Manager<br />
MM Membership Manager<br />
NM Node Manager<br />
OM Object Manager<br />
RGP Regroup<br />
RM Resource Monitor<br />
For additional descriptions of the cluster components, refer to the Windows 2000 Server<br />
Resource Kit at this URL:<br />
http://www.microsoft.com/technet/prodtechnol/windows2000serv/reskit/default.msp<br />
x?mfr=true<br />
Click the following link for Windows 2003 to refer to the Windows 2003 Server Resource<br />
Kit:<br />
http://www.microsoft.com/windowsserver2003/techinfo/reskit/tools/default.mspx<br />
Click the following link to interpret the cluster logs:<br />
http://technet2.microsoft.com/windowsserver/en/library/16eb134d-584e-46d9-9bf4-<br />
6836698cd26a1033.mspx?mfr=true<br />
I–4 6872 5688–002
Sample Cluster Log<br />
Analyzing Cluster Logs<br />
The sample cluster log that follows illustrates the component names in brackets.<br />
Cluster Operation<br />
00000848.00000ba0::2008/05/05-16:11:31.000 [RGP] Node 1: REGROUP INFO:<br />
regroup engine requested immediate shutdown.<br />
00000848.00000ba0::2008/05/05-16:11:31.000 [NM] Prompt shutdown is requested<br />
by a membership engine<br />
00000adc.00000acc::2008/05/05-16:11:31.234 [RM] Going away, Status = 1,<br />
Shutdown = 0.<br />
The cluster operation is the task currently being performed by the cluster. Each cluster<br />
module (listed in Table I–2) can perform hundreds of operations, such as forming a<br />
cluster, joining a cluster, checkpointing, moving a group manually, and moving a group<br />
because of a failure.<br />
Posting Information to the Cluster Log<br />
The cluster log file is organized by date and time. Process threads of MSCS and<br />
resources post entries in an intermixed fashion. As the threads are performing various<br />
cluster functions, they constantly post entries to the cluster log in an interspersed<br />
manner.<br />
The following sample cluster log shows various disks in the process of coming online.<br />
The entries are not logically grouped by disk; rather, the entries are logged as each<br />
thread posts its unique information.<br />
In the left navigation pane, click on Windows 2000 Server Resource Kit and click<br />
on Distributed Systems <strong>Guide</strong>, then Enterprise Technologies, and then<br />
Interpreting the Cluster Log.<br />
Sample Cluster Log<br />
Thread ID<br />
↓<br />
00000444.00000600::2008/11/18-18:23:48.307 Physical Disk :<br />
[DiskArb] Issuing GetSectorSize on signature 9a042144.<br />
00000444.000005e0::2008/11/18-18:23:48.307 Physical Disk :<br />
[DiskArb]Successful read (sector 12) [:0] (0,00000000:00000000).<br />
00000444.00000608::2008/11/18-18:23:48.307 Physical Disk :<br />
[DiskArb]DisksOpenResourceFileHandle: CreateFile successful.<br />
6872 5688–002 I–5
Analyzing Cluster Logs<br />
00000444.00000600::2008/11/18-18:23:48.307 Physical Disk :<br />
[DiskArb] GetSectorSize completed, status 0.<br />
00000444.00000608::2008/11/18-18:23:48.307 Physical Disk :<br />
DiskArbitration must be called before DisksOnline.<br />
00000444.00000600::2008/11/18-18:23:48.307 Physical Disk :<br />
[DiskArb] ArbitrationInfo.SectorSize is 512<br />
00000444.00000608::2008/11/18-18:23:48.307 Physical Disk :<br />
[DiskArb] Arbitration Parameters (1 9999).<br />
00000444.00000600::2008/11/18-18:23:48.307 Physical Disk :<br />
[DiskArb] Issuing GetPartInfo on signature 9a042144.<br />
Because the cluster performs many operations simultaneously, the log entries pertaining<br />
to a particular thread are interwoven along with the threads of the other cluster<br />
operations. Depending on the number of cluster groups and resources, reading a cluster<br />
log can become difficult.<br />
Tip: To follow a particular operation, search by the thread ID. For instance, to follow<br />
online events for Physical Disk V, perform these steps using the preceding sample<br />
cluster log:<br />
1. Anchor the cursor in the desired area.<br />
2. Search up or down for thread 00000600.<br />
Diagnosing a Problem Using Cluster Logs<br />
The following topics provide you with useful information for diagnosing problems using<br />
cluster logs:<br />
• Gathering Materials<br />
• Opening the Cluster Log<br />
• Converting GMT to Local Time<br />
• Converting Cluster Log GUIDs to Text Resource Names<br />
• Understanding State Codes<br />
• Understanding Persistent State<br />
• Understanding Error and Status Codes<br />
I–6 6872 5688–002
Gathering Materials<br />
Analyzing Cluster Logs<br />
You need to gather the following pieces of information, tools, and files to use with the<br />
cluster logs to diagnose problems:<br />
• Information<br />
− Date and time of problem occurrence<br />
− Server time zone<br />
• Tools<br />
− Notepad or Wordpad text viewer<br />
− This command-line tool is embedded in Windows. The command syntax is Net<br />
Helpmsg ).<br />
• Output from the MPS Report Utility from all cluster nodes<br />
• Files from the MPS Report Utility run<br />
− Cluster log (Mandatory)<br />
The file name is _Cluster.log.<br />
− System event log (Mandatory)<br />
The file name is _Event_Log_System.txt.<br />
− .nfo system information file for installed adapters and driver versions (Reference)<br />
The file name is _Msinfo.nfo.<br />
− Cluster registry hive for cross-referencing information used in the cluster log<br />
(Reference)<br />
The file name is _Cluster_Registry.hiv.<br />
− Cluster configuration file for a basic listing of cluster nodes, groups, resources,<br />
and dependencies (available in MPS Report Utility version 7.2 or later)<br />
The file name is _Cluster_mps_Information.txt.<br />
Opening the Cluster Log<br />
Use a text editor to view the cluster log file in the MPS Report Utility. Notepad or<br />
Wordpad works well. Notepad allows text searches up or down the document. Wordpad<br />
allows text searches only down the document.<br />
Note: Do not open the cluster.log file on a production cluster. Logging stops while the<br />
file is open. Instead, copy the cluster.log file first and then open the copy to read the file.<br />
The cluster log is on the local system in the directory Winnt/Cluster/Cluster.log.<br />
6872 5688–002 I–7
Analyzing Cluster Logs<br />
Converting GMT/UCT to Local Time<br />
The time posted in the cluster log is given as GMT/UCT. You must convert GMT/UCT to<br />
the local time to cross-reference cluster log entries with system and application event<br />
log entries.<br />
You can find the local time zone in the .nfo file in MPS Reports under system summary.<br />
You can also use the Web site www.worltimeserver.com to find accurate local time for a<br />
given city, GMT/UCT, and the difference between the two in hours.<br />
Converting Cluster Log GUIDs to Text Resource Names<br />
A globally unique identifier (GUID) is a 32-character hexadecimal string used to identify a<br />
unique entity in the cluster. A unique entry can be a node name, group name, resource<br />
name, or cluster name.<br />
The GUID format is nnnnnnnn-nnnn-nnnn-nnnn-nnnnnnnnnnnn.<br />
The following are examples of GUIDs in the cluster log:<br />
000007d0.00000808::2008/04/23-21:48:23.105 [FM] FmpHandleResourceTransition: resource<br />
Name = ae775058-af20-4ba2-a911-af138b1f65bd old state=130 new state=3<br />
000007d0.00000808::2008/04/23-21:48:23.448 [FM] FmpRmOfflineResource: RMOffline() for<br />
6060dc33-5737-4277-b2f2-9cc45629ef0 returned error 997<br />
000007d0.00001970::2008/05/02-21:41:58.846 [FM] OnlineResource: e65bc275-66d1-41ff-<br />
8a4e-89ad6643838b depends on 758bb9bb-7d1f-4148-a994-684dd4f8c969. Bring online<br />
first.<br />
000007d0.0000081::2008/05/04-17:21:06.888 [FM] New owner of Group b072608c-b7f3-48b0-<br />
83f8-7c922c14e709 is 2, state 0, curstate 1.<br />
Mapping a Text Name to a GUID<br />
The two methods for mapping a text name to a GUID are<br />
• Automatic mapping<br />
• Reviewing the cluster registry hive<br />
I–8 6872 5688–002
Automatic Mapping<br />
Analyzing Cluster Logs<br />
The simplest method of mapping a text name to a GUID is the automatic mapping<br />
performed by some versions of the MPS Report tool. However, most versions of the<br />
MPS Report tool do not perform this automatic function.<br />
For those versions with the automatic mapping feature, you can find the information in<br />
the cluster configuration file (_Cluster_Mps_Information.txt). The<br />
following listing shows this mapping:<br />
f9f0b528-b674-40fb-9770-c65e17a2a387 = SQL Network Name<br />
f0dd1852-acc8-4921-b33a-a77dd5cdcfee = SQL Server Fulltext (SQL1)<br />
f0aca2c4-049f-4255-9332-92a69cc07326 = MSDTC<br />
eff360f3-d987-4a020-8f3c-4118056a50b2 = MSDTC IP Address<br />
e74769f8-67e1-43b2-9bec-93171c31d182 = SQL IP Address 1<br />
e09f61cf-8ebf-4cd1-9ae3-58ed4d2b0fbc = Disk K:<br />
Reviewing the Cluster Registry Hive<br />
The second method of mapping a text name to a GUID is more complex and involves<br />
opening the cluster registry hive from the MPS Report tool and then reviewing the<br />
contents.<br />
Follow these steps to open and review the cluster registry hive:<br />
1. Start the Registry Editor (Regedt32.exe).<br />
2. Click the HKEY_LOCL_MACHINE hive.<br />
3. Click the HKEY_LOCAL_MACHINE root folder.<br />
4. Click Load Hive on the Registry menu.<br />
5. Select the _Cluster_Registry.hiv file; then press Ctrl-C.<br />
6. Select Open.<br />
7. Press Ctrl-V to obtain the key name.<br />
8. Expand the cluster hive and review the GUIDS, which are located in the subkeys<br />
Groups, Resources, Networks, and NetworkInterfaces, as shown in Figure I–2.<br />
6872 5688–002 I–9
Analyzing Cluster Logs<br />
I–10<br />
Figure I–2. Expandded<br />
Cluster Hive (in Windows 2000 Server)<br />
Scroll through the GUUIDs<br />
until you find the one that matches the GUID from<br />
the<br />
cluster log. You can aalso<br />
open each key until you find the matching GUID D.<br />
Tip: Under each GUID iss<br />
a TYPE field. This field identifies a resource type such<br />
as<br />
physical disk, IP addresss,<br />
network name, generic application, generic service e, and so<br />
forth. You can use this fiield<br />
to find a specific resource type and then map it to the GUID.<br />
Understanding State CCodes<br />
MSCS uses state codes to determine the status of a cluster component. The e state varies<br />
depending on the type off<br />
cluster components, which are nodes, groups, resources,<br />
networks, and network innterfaces.<br />
Some state codes are posted in the cluster<br />
log using<br />
the numeric code and others<br />
using the actual value for the code.<br />
68 872 5688–002
Examples of State Codes in the Cluster Log<br />
Analyzing Cluster Logs<br />
The following example entries show state codes for the resource, group, network<br />
interface, node, and network types of cluster component:<br />
• Resource<br />
In this example, the resource is changing states from online pending (129) to online<br />
(2).<br />
00000850.00000888::2008/05/05-17:37:29.125 [FM] FmpHandleResource<br />
Transition: Resource Name = 87e55402-87cb-4354-95e7-6dd864b79039 old state =<br />
129 new state=2<br />
• Group<br />
In this example, the group state is set to offline (1).<br />
00000898.000008a0::2008/05/05-06:25:55:062 [FM] Setting group 1951e272-6271-<br />
4ea3-b0f9-cd767537f245 owner to node 2, state 1<br />
• Network interface<br />
This example provides the actual value of the state code, not the numeric code.<br />
00000898.00000598:2008/05/05-06:28:40;921 [ClMsg] Received interface<br />
unreachable event for node 2 network 1<br />
• Node<br />
This example provides the actual value of the state code, not the numeric code.<br />
00000898.0000060c::2008/05/05-06:28:45:953 [EP] Node down event received<br />
00000898.000008a8:2008/05/05-06:28:45:953 [Gum] Nodes down: 0002. Locker=1,<br />
Locking=1<br />
• Network<br />
This example provides the actual value of the state code, not the numeric code.<br />
00000898.000008a4::2008/05/05-06:25:53:703 [NM] Processing local interface<br />
up event for network 0433c4e2-a577-4325-9ebd-a9d3d2b9b81f.<br />
6872 5688–002 I–11
Analyzing Cluster Logs<br />
State Codes<br />
Table I–3 lists the state codes from the Windows 2000 Resource Kit for nodes.<br />
Table I–3. Node State Codes<br />
State Code State<br />
–1 ClusterNodeStateUnknown<br />
0 ClusterNodeUp<br />
1 ClusterNodeDown<br />
2 ClusterNodePaused<br />
3 ClusterNodeJoining<br />
Table I–4 lists the state codes from the Windows 2000 Resource Kit for groups.<br />
Table I–4. Group State Codes<br />
State Code State<br />
–1 ClusterGroupStateUnknown<br />
0 ClusterGroupOnline<br />
1 ClusterGroupOffline<br />
2 ClusterGroupFailed<br />
3 ClusterGroupPartialOnline<br />
Table I–5 lists the state codes from the Windows 2000 Resource Kit for resources.<br />
Table I–5. Resource State Codes<br />
State Code State<br />
–1 ClusterResourceStateUnknown<br />
0 ClusterResourceInherited<br />
1 ClusterResourceInitializing<br />
2 ClusterResourceOnline<br />
3 ClusterResourceOffline<br />
4 ClusterResourceFailed<br />
128 ClusterResourcePending<br />
I–12 6872 5688–002
Table I–5. Resource State Codes<br />
State Code State<br />
129 ClusterResourceOnlinePending<br />
130 ClusterResourceOfflinePending<br />
Analyzing Cluster Logs<br />
Table I–6 lists the state codes from the Windows 2000 Resource Kit for network<br />
interfaces.<br />
Table I–6. Network Interface State Codes<br />
State Code State<br />
–1 ClusterNetInterfaceStateUnknown<br />
0 ClusterNetInterfaceUnavailable<br />
1 ClusterNetInterfaceFailed<br />
2 ClusterNetInterfaceUnreachable<br />
3 ClusterNetInterfaceUp<br />
Table I–7 lists the state codes from the Windows 2000 Resource Kit for networks<br />
Table I–7. Network State Codes<br />
State Code State<br />
–1 ClusterNetworkStateUnknown<br />
0 ClusterNetworkUnavailable<br />
1 ClusterNetworkDown<br />
2 ClusterNetworkPartitioned<br />
3 ClusterNetworkUp<br />
6872 5688–002 I–13
Analyzing Cluster Logs<br />
Understanding Persistent State<br />
Persistent state is not a state code, but rather a key in the cluster registry hive for groups<br />
and resources. The persistent state key reflects the current state of a resource or group.<br />
This key is not a permanent value; it changes value when a group or resource changes<br />
states.<br />
You can change the value of the persistent state key, which can be useful for<br />
troubleshooting or managing the cluster. For example, you can change the value before a<br />
manual failover or shutdown to prevent a particular group or resource from starting<br />
automatically.<br />
The value for the persistent state can be 0 (disabled or offline) or 1 (enabled or online).<br />
The default value is 1.<br />
If the value for persistent state is 0, the group or resource remains in an offline state<br />
until it is manually brought online.<br />
The following is an example cluster log reference to persistent state:<br />
000008bc.00000908::2008/05/12-23:45:36/687 [FM] FmpPropagateGroupState:<br />
Group 1951e272-6271-4ea3-b0f9-cd767537f245 state = 3, persistent state = 1<br />
For more information about persistent state, view Microsoft Knowledge Base article<br />
259243, “How to Set the Startup Value for a Resource on a Clustered Server” at this<br />
URL:<br />
http://support.microsoft.com/default.aspx?scid=kb;en-us;259243<br />
I–14 6872 5688–002
Understanding Error and Status Codes<br />
Analyzing Cluster Logs<br />
You can easily interpret error and status codes that occur in cluster log entries by issuing<br />
the following command from the command line:<br />
Net Helpmsg <br />
This command returns a line of explanatory text that corresponds to the number.<br />
Examples<br />
• For the error code value of 5 as shown in the following example, the Net Helpmsg<br />
command returns “Access is denied.”<br />
00000898.000008f0:2008/30-16:03:31.979 [DM] DmpCheckpointTimerCb -Failed to<br />
reset log, error=5<br />
• For the status code value of 997 as shown in the following example, the Net<br />
Helpmsg command returns “Overlapped I/O operation is in progress.” This status<br />
code is also known as “I/O pending.”<br />
00000898.00000a8c::2008/05/05-06:38:14.187 [FM] FmpOnlineResource: Returning<br />
Resource 87e55402-87cb-4354-95e7-6dd864b79039, state 129, statue 997<br />
• For the status code value of 170 as shown in the following example, the Net<br />
Helpmsg command returns “The requested resource is in use.”<br />
000009a4.000009c4::2008/05/15-07:28:42.303 Physicsl Disk :[DiskArb]<br />
CompletionRoutine, status 170<br />
6872 5688–002 I–15
Analyzing Cluster Logs<br />
I–16 6872 5688–002
Index<br />
A<br />
accessing an image, 3-2<br />
analyzing<br />
intelligent fabric switch logs, A-16<br />
RA log collection files, A-8<br />
server (host) logs, A-16<br />
B<br />
bandwidth, verifying, D-7<br />
bin directory, A-14<br />
C<br />
changes for this release, 1-2<br />
clearing the system event log (SEL), B-1<br />
ClearPath MCP<br />
bringing data consistency group online, 3-5<br />
manual failover, 3-5<br />
recovery tasks, 3-5<br />
CLI file, A-10<br />
clock synchronization, verifying, D-8<br />
cluster failure, recovering, 4-19<br />
cluster log<br />
cluster registry hive, I-9<br />
definition, I-1<br />
error and status codes, I-15<br />
GUID format, I-8<br />
GUIDs, I-8<br />
layout, I-3<br />
mapping GUID to text name, I-8<br />
name and location, I-1<br />
opening, I-7<br />
overview, 2-9<br />
persistent state, I-14<br />
state codes, I-10, I-12<br />
cluster registry hive, I-9<br />
cluster service modules, I-4<br />
cluster settings<br />
system environment variables, I-2<br />
cluster setup, checking, 4-1<br />
collecting host logs<br />
using host information collector (HIC)<br />
utility, A-7<br />
using MPS utility, A-6<br />
collecting RA logs, A-1, A-3<br />
Collector (See Unisys <strong>SafeGuard</strong> 30m<br />
Collector)<br />
collector directory, A-11<br />
configuration settings, saving, D-2<br />
configuring additional RAs, D-4<br />
configuring the replacement RA, D-6<br />
connecting, accessing the replacement<br />
RA, D-4<br />
connectivity testing tool messages, C-8<br />
converting local time to GMT or UTC, A-3<br />
6872 5688–002 Index–1<br />
D<br />
data consistency group<br />
bringing online, 3-3, 4-9<br />
bringing online for ClearPath MCP, 3-5<br />
manual failover, 3-2, 4-8<br />
manual failover for ClearPath MCP, 3-5<br />
recovery tasks, 3-2, 3-5, 4-7<br />
recovery tasks for ClearPath MCP, 3-5<br />
taking offline, 4-7, 5-9<br />
data flow, overview, 2-3<br />
detaching the failed RA, D-3<br />
determining when the failure occurred, A-2<br />
diagnostics<br />
Installation Manager, C-1<br />
RA hardware, B-2<br />
directory<br />
bin, A-14<br />
collector, A-11<br />
etc, A-11<br />
files, A-11<br />
home, A-11, A-14<br />
host log extraction, A-15<br />
InfoCollect, A-12<br />
processes, A-12<br />
rreasons, A-11
Index<br />
E<br />
sbin, A-12<br />
tmp, A-14<br />
usr, A-13<br />
e-mail notifications<br />
configuring a diagnostic e-mail<br />
notification, 2-8<br />
overview, 2-8<br />
enabling PCI-X slot functionality, D-5<br />
environment settings, restoring, D-2<br />
etc directory, A-11<br />
event log, E-1<br />
displaying, E-3<br />
event levels, E-2<br />
event scope, E-2<br />
event topics, E-1<br />
list of Detailed events, E-22<br />
list of Normal events, E-5<br />
overview, 2-7<br />
using for troubleshooting, E-3<br />
events<br />
event log, E-1<br />
understanding, E-1<br />
events that cause journal distribution, 2-10<br />
F<br />
Fabric Splitter, 2-4<br />
Fibre Channel diagnostics<br />
detecting Fibre Channel LUNs, C-13<br />
detecting Fibre Channel Scsi3 Reserved<br />
LUNs, C-15<br />
detecting Fibre Channel targets, C-12<br />
performing I/O to LUN, C-15<br />
running SAN diagnostics, C-9<br />
viewing Fibre Channel details, C-11<br />
Fibre Channel HBA LEDs<br />
location, 8-12<br />
files directory, A-11<br />
full-sweep initialization, 4-4<br />
G<br />
geographic clustered environment<br />
basic configuration diagram, 2-2<br />
definition, 2-1<br />
overview, 2-2<br />
recovery from total failure of one site, 4-19<br />
geographic replication environment, 2-1<br />
definition, 2-1<br />
server failure, 9-20<br />
total storage loss, 5-13<br />
GMT<br />
converting local time to, A-3<br />
example of local time conversion, A-3<br />
group initialization effects on move-group<br />
operation, 4-3<br />
Index–2 6872 5688–002<br />
H<br />
HIC (See host information collector (HIC)<br />
utility)<br />
high load<br />
disk manager reports, 10-4<br />
general description, 10-3<br />
home directory, A-11, A-14<br />
host information collector (HIC) utility<br />
overview, 2-9<br />
using, A-7<br />
host logs collection<br />
using host information collector (HIC)<br />
utility, A-7<br />
using MPS utility, A-6<br />
I<br />
InfoCollect directory, A-12<br />
initialization<br />
from marking mode, 4-5<br />
full sweep, 4-4<br />
long resynchronization, 4-4<br />
initiate_failover command, 4-6<br />
Installation Manager<br />
diagnostics, 2-9<br />
Diagnostics menu, 8-17, 8-21, C-2<br />
steps to run, C-2<br />
Installation Manager diagnostics<br />
collect system info, C-18<br />
Fibre Channel diagnostics, C-9<br />
IP diagnostics, C-2<br />
synchronization diagnostics, C-17<br />
installing and configuring the replacement<br />
RA, D-4<br />
IP diagnostics<br />
port diagnostics, C-5<br />
site connectivity tests, C-3<br />
system connectivity, C-6, C-7
K<br />
test throughput, C-4<br />
view IP details, C-3<br />
view routing table, C-4<br />
kutils<br />
command summary, H-2<br />
overview, 2-10<br />
path designations, H-1<br />
string, H-1<br />
using, H-1<br />
L<br />
Local Replication by CDP, 2-5<br />
log extraction directory<br />
host, A-15<br />
RA, A-9<br />
log file, A-10<br />
long resynchronization, 4-4<br />
M<br />
management console<br />
locked user, 8-4<br />
RA attached to cluster, 8-4<br />
understanding access, 8-4<br />
manual failover<br />
data consistency group, 3-2, 4-8<br />
performing, 4-7<br />
performing with data consistency group<br />
(older image), 4-8<br />
quorum consistency groups, 4-14, 4-23<br />
manual failover for ClearPath MCP<br />
data consistency group, 3-5<br />
manual failover of volumes and data<br />
consistency groups<br />
accessing an image, 3-2<br />
marking mode, initializing from, 4-5<br />
MIB<br />
OID Unisys, F-1<br />
RA file, F-3<br />
MIB II, F-1<br />
Microsoft Cluster Service, 2-1<br />
modifying the Preferred RA setting, D-3<br />
move group operation, initialization<br />
effects, 4-3<br />
MPS utility, A-6<br />
MSCS (See Microsoft Cluster Service)<br />
MSCS properties, checking, 4-1<br />
Index<br />
6872 5688–002 Index–3<br />
N<br />
network bindings<br />
checking, 4-2<br />
cluster specific, 4-3<br />
host network specific, 4-2<br />
network LEDs<br />
location, 8-11<br />
networking problem<br />
cluster node public NIC failure (geographic<br />
clustered environment), 7-3<br />
management network failure (geographic<br />
clustered environment), 7-11<br />
port information, 7-32<br />
private cluster network failure (geographic<br />
clustered environment), 7-22<br />
public or client WAN failure (geographic<br />
clustered environment), 7-6<br />
replication network failure (geographic<br />
clustered environment), 7-15<br />
temporary WAN failures, 7-21<br />
total communication failure (geographic<br />
clustered environment), 7-26<br />
new for this release, 1-2<br />
P<br />
parameters file, A-9<br />
performance problem<br />
failover time lengthens, 10-5<br />
high load<br />
disk manager, 10-4<br />
distributer, 10-5<br />
slow initialization, 10-2<br />
persistent state key, I-14<br />
port information, 7-32<br />
processes directory, A-12<br />
Q<br />
quorum consistency group<br />
manual failover, 4-14, 4-23
Index<br />
R<br />
RA problem<br />
all RAs at one site fail, 8-25<br />
all RAs not attached, 8-27<br />
all SAN Fibre Channel HBAs fail, 8-14<br />
onboard management network adapter<br />
fails, 8-23<br />
onboard WAN network adapter fails, 8-19<br />
optional Gigabit Fibre Channel WAN<br />
network adapter fails, 8-19<br />
reboot regulation failover, 8-12<br />
single hard disk fails, 8-24<br />
single RA failure, 8-4<br />
single RA failures with switchover, 8-5<br />
single RA failures without switchover, 8-21<br />
single SAN Fibre Channel HBA on one RA<br />
fails, 8-21<br />
rear panel indicators, 8-11<br />
recording group properties and saving<br />
settings, D-2<br />
recovery<br />
all RAs fail on site, 4-11<br />
from site failure, 4-19<br />
from total failure of one site in geographic<br />
clustered environment, 4-19<br />
site 1 failure with quorum owner located<br />
on site 2, 4-25<br />
site 1 failure with quorum resource owned<br />
by site 1, 4-19<br />
using older image, 4-7<br />
recovery tasks<br />
data consistency group, 3-2, 4-7<br />
data consistency group for ClearPath<br />
MCP, 3-5<br />
reformatting the repository volume, 5-8<br />
removing Fibre Channel host bus<br />
adapters, D-4<br />
replacing an RA, D-1<br />
replication appliance (RA)<br />
connecting, accessing, D-4<br />
diagnostics, B-2<br />
LCD status messages, B-4<br />
replacing, D-1<br />
replication appliance (RA)<br />
analyzing logs from, A-8<br />
collecting logs from, A-1<br />
replication, reversing direction, 4-10, 4-15<br />
repository volume<br />
not accessible, 5-6<br />
reformatting, 5-8<br />
restoring environment settings, D-2<br />
restoring failover settings, 4-24<br />
restoring group properties, D-8<br />
resynchronization, long, 4-4<br />
rreasons directory, A-11<br />
runCLI file, A-14<br />
Index–4 6872 5688–002<br />
S<br />
<strong>SafeGuard</strong> 30m Control<br />
behavior during move group, 4-5<br />
SAN connectivity problem<br />
RAs not accessible to splitter, 6-12<br />
total SAN switch failure (geographic<br />
clustered environment), 6-17<br />
volume not accessible to RAs, 6-3<br />
volume not accessible to splitter, 6-7<br />
saving configuration settings, D-2<br />
sbin directory, A-12<br />
server problem<br />
cluster node failure (georgraphic clustered<br />
environment), 9-2<br />
infrastructure (NTP) server fails, 9-18<br />
server crash or restart, 9-12<br />
server failure (georgraphic replication<br />
environment), 9-20<br />
server HBA fails, 9-17<br />
server unable to connect with SAN, 9-14<br />
unexpected server shutdown because of a<br />
bug check, 9-8<br />
Windows server reboot, 9-3<br />
SNMP traps<br />
configuring and using, F-1<br />
MIB, F-1<br />
resolving issues, F-4<br />
variables and values, F-2<br />
SSH client, using, C-1<br />
state codes, I-10, I-12<br />
storage problem<br />
journal volume not accessible, 5-11<br />
repository volume not accessible, 5-6<br />
storage failure on one site (geographic<br />
clustered environment), 5-16<br />
total storage loss (geographic replicated<br />
environment), 5-13<br />
user or replication volume not<br />
accessible, 5-4<br />
storage-to-RA access, checking, D-5<br />
summary file, A-11<br />
system event log (SEL), clearing, B-1<br />
system status<br />
using CLI commands, 2-8
T<br />
using the management console, 2-7<br />
tar file, A-15<br />
testing FTP connectivity, A-2<br />
tmp directory, A-14<br />
troubleshooting<br />
general procedures, 2-11<br />
recovering from site failure, 4-19<br />
U<br />
Unisys <strong>SafeGuard</strong> 30m Collector, G-1<br />
Collector mode, G-4<br />
adding customer information, G-5<br />
adding scripts, G-12<br />
automatic discovery of RAs, G-4<br />
compressing an SSC file, G-6<br />
configuring component types using<br />
built-ins scripts, G-8<br />
configuring RAs, G-4<br />
configuring SAN switches, G-9<br />
deleting a scheduled SSC file, G-14<br />
deleting scripts, G-12<br />
disabling scripts, G-10<br />
duplicating installation on another<br />
PC, G-6<br />
enabling scripts, G-10<br />
opening an SSC file, G-8<br />
querying a scheduled SSC file, G-14<br />
running all scripts, G-6<br />
running scripts, G-11<br />
scheduling an SSC file, G-13<br />
stopping script execution, G-11<br />
installing, G-1<br />
prior to configuring, G-2<br />
security breach warning, G-3<br />
View mode, G-15<br />
Unisys <strong>SafeGuard</strong> 30m solution<br />
definition, 2-1<br />
unmounting volumes<br />
at production site, 3-4<br />
at remote site, 3-3<br />
unmounting volumes at source site, 3-4<br />
user types, preconfigured for RAs, 2-8<br />
using the SSH client, C-1<br />
using this guide, 1-3<br />
usr directory, A-13<br />
UTC<br />
converting local time to, A-3<br />
example of local time conversion, A-3<br />
Index<br />
6872 5688–002 Index–5<br />
V<br />
verify_failover command, 4-6<br />
verifying clock synchronization, D-8<br />
verifying the replacement RA installation, D-7<br />
volumes<br />
unmounting at source site, 3-4<br />
W<br />
WAN bandwidth, verifying, D-7<br />
webdownload/webdownload, 2-8, C-20
Index<br />
Index–6 6872 5688–002
© 2008 Unisys Corporation.<br />
All rights reserved.<br />
*68725688-002*<br />
6872 5688–002