PCWA-L 480.pdf - PCWA Middle Fork American River Project ...
PCWA-L 480.pdf - PCWA Middle Fork American River Project ...
PCWA-L 480.pdf - PCWA Middle Fork American River Project ...

Create successful ePaper yourself
Turn your PDF publications into a flip-book with our unique Google optimized e-Paper software.
Creating a Cohort<br />
4-4<br />
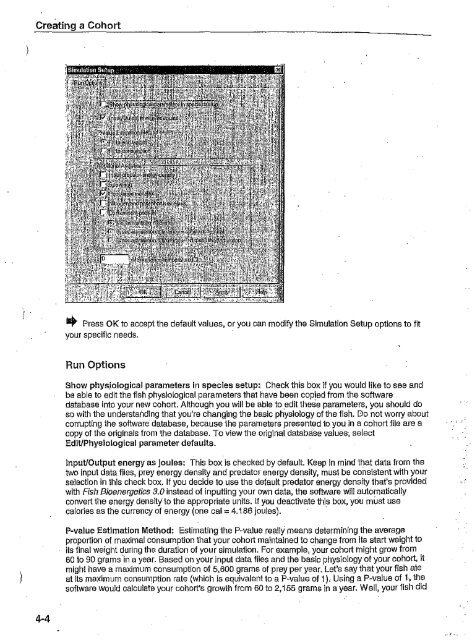
.. Press OK to accept the default values, or you can modify the Simulation Setup options to fit<br />
your specific needs.<br />
Run Options<br />
Show phys,iologiGal parameters in species setup: Check this box if you would like to see and<br />
be able to edit the fish physlologlcai parameters that have been copied from the software<br />
database into your new cohort. Although you will be able to .edlt these parameters, you should do<br />
so with the understatJding that you're changing the basic physiology of the fish. Do not worry about<br />
corrupting the software database, because the parameters presented to you In a cohort file are a<br />
copy of the originals from the database. To view the original database values', select<br />
Edit/PhysiologIcal parameter defaults.<br />
Input/Output energy as Joules: This box is checked by default. Keep in mind that data from the<br />
two input data files, prey energy density and predator energy density, must be consistent with your<br />
seleclion in this check box. If you decide to use the defauli predator energy density that's provided<br />
with Fish Bioenergetics 3.0 instead of inputting your own data, the software will automatically<br />
convert the energy density to the appropriate units. If you deactivate this box, you must use<br />
calories as the currency of energy (one cal = 4.186 jouies). .<br />
P-value Estimation Method: Estimating the P-value really means determining the average<br />
proportion of maximal consumption that your cohort maintained to change from its start weight to<br />
its final weight during the duration of your simulation. For example, your cohort might grow from<br />
60 to 90 grams 'in a year. Based on your Input data flies and the basic physiology of your cohort, it<br />
might have a maximum consumption of 5,600 grams of prey per year. Let's say that your fish ate<br />
at Its maximum consumption rate (which is equivalent to a P-value of 1), Using a P-value of 1, the<br />
software would calculate your cohort's growth from 60 to 2,155 grams In a year. Well, your fish did<br />
.' :.:<br />
.. 1,