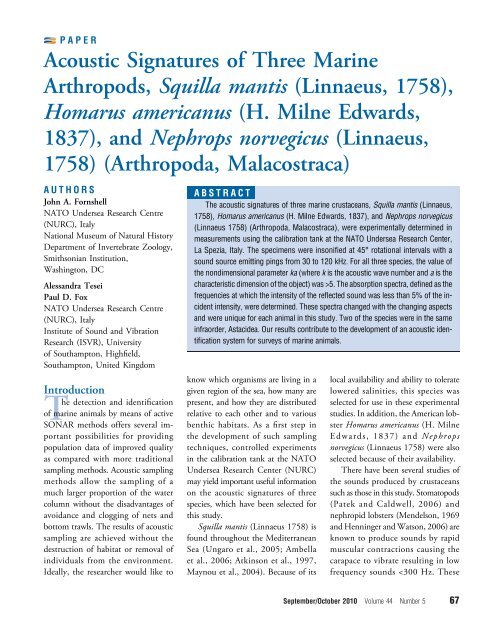
Acoustic Signatures of Three Marine Arthropods, Squilla mantis ...
Acoustic Signatures of Three Marine Arthropods, Squilla mantis ...
Acoustic Signatures of Three Marine Arthropods, Squilla mantis ...
Create successful ePaper yourself
Turn your PDF publications into a flip-book with our unique Google optimized e-Paper software.
PAPER<br />
<strong>Acoustic</strong> <strong>Signatures</strong> <strong>of</strong> <strong>Three</strong> <strong>Marine</strong><br />
<strong>Arthropods</strong>, <strong>Squilla</strong> <strong>mantis</strong> (Linnaeus, 1758),<br />
Homarus americanus (H. Milne Edwards,<br />
1837), and Nephrops norvegicus (Linnaeus,<br />
1758) (Arthropoda, Malacostraca)<br />
AUTHORS<br />
John A. Fornshell<br />
NATO Undersea Research Centre<br />
(NURC), Italy<br />
National Museum <strong>of</strong> Natural History<br />
Department <strong>of</strong> Invertebrate Zoology,<br />
Smithsonian Institution,<br />
Washington, DC<br />
Alessandra Tesei<br />
Paul D. Fox<br />
NATO Undersea Research Centre<br />
(NURC), Italy<br />
Institute <strong>of</strong> Sound and Vibration<br />
Research (ISVR), University<br />
<strong>of</strong> Southampton, Highfield,<br />
Southampton, United Kingdom<br />
Introduction<br />
The detection and identification<br />
<strong>of</strong> marine animals by means <strong>of</strong> active<br />
SONAR methods <strong>of</strong>fers several important<br />
possibilities for providing<br />
population data <strong>of</strong> improved quality<br />
as compared with more traditional<br />
sampling methods. <strong>Acoustic</strong> sampling<br />
methods allow the sampling <strong>of</strong> a<br />
much larger proportion <strong>of</strong> the water<br />
column without the disadvantages <strong>of</strong><br />
avoidance and clogging <strong>of</strong> nets and<br />
bottom trawls. The results <strong>of</strong> acoustic<br />
sampling are achieved without the<br />
destruction <strong>of</strong> habitat or removal <strong>of</strong><br />
individuals from the environment.<br />
Ideally, the researcher would like to<br />
ABSTRACT<br />
The acoustic signatures <strong>of</strong> three marine crustaceans, <strong>Squilla</strong> <strong>mantis</strong> (Linnaeus,<br />
1758), Homarus americanus (H. Milne Edwards, 1837), and Nephrops norvegicus<br />
(Linnaeus 1758) (Arthropoda, Malacostraca), were experimentally determined in<br />
measurements using the calibration tank at the NATO Undersea Research Center,<br />
La Spezia, Italy. The specimens were insonified at 45° rotational intervals with a<br />
sound source emitting pings from 30 to 120 kHz. For all three species, the value <strong>of</strong><br />
the nondimensional parameter ka (where k is the acoustic wave number and a is the<br />
characteristic dimension <strong>of</strong> the object) was >5. The absorption spectra, defined as the<br />
frequencies at which the intensity <strong>of</strong> the reflected sound was less than 5% <strong>of</strong> the incident<br />
intensity, were determined. These spectra changed with the changing aspects<br />
and were unique for each animal in this study. Two <strong>of</strong> the species were in the same<br />
infraorder, Astacidea. Our results contribute to the development <strong>of</strong> an acoustic identification<br />
system for surveys <strong>of</strong> marine animals.<br />
know which organisms are living in a<br />
given region <strong>of</strong> the sea, how many are<br />
present, and how they are distributed<br />
relative to each other and to various<br />
benthic habitats. As a first step in<br />
the development <strong>of</strong> such sampling<br />
techniques, controlled experiments<br />
in the calibration tank at the NATO<br />
Undersea Research Center (NURC)<br />
may yield important useful information<br />
on the acoustic signatures <strong>of</strong> three<br />
species, which have been selected for<br />
this study.<br />
<strong>Squilla</strong> <strong>mantis</strong> (Linnaeus 1758) is<br />
found throughout the Mediterranean<br />
Sea (Ungaro et al., 2005; Ambella<br />
et al., 2006; Atkinson et al., 1997,<br />
Maynou et al., 2004). Because <strong>of</strong> its<br />
local availability and ability to tolerate<br />
lowered salinities, this species was<br />
selected for use in these experimental<br />
studies. In addition, the American lobster<br />
Homarus americanus (H. Milne<br />
Edwards, 1837) and Nephrops<br />
norvegicus (Linnaeus 1758) were also<br />
selected because <strong>of</strong> their availability.<br />
There have been several studies <strong>of</strong><br />
the sounds produced by crustaceans<br />
such as those in this study. Stomatopods<br />
(Patek and Caldwell, 2006) and<br />
nephropid lobsters (Mendelson, 1969<br />
and Henninger and Watson, 2006) are<br />
known to produce sounds by rapid<br />
muscular contractions causing the<br />
carapace to vibrate resulting in low<br />
frequency sounds
sounds are believed to be defensive<br />
in nature (Staaterman et al., 2010;<br />
Bouwma and Herrnkind, 2009; Patek<br />
and Caldwell, 2006). In this study, active<br />
SONAR is being used to identify<br />
the animals.<br />
The density, compressibility, and<br />
speed <strong>of</strong> sound in these animals are<br />
not know with certainty, but Greenlaw<br />
and Johnson (1982) and Foote (1990)<br />
provide measurements for several different<br />
marine arthropods showing<br />
that values for the ratio <strong>of</strong> the density<br />
<strong>of</strong> the organism to the density <strong>of</strong> sea<br />
water vary between 1.010 and 1.088,<br />
that values for the ratio <strong>of</strong> celerity in<br />
the organism to celerity in seawater<br />
vary between 0.997 and 1.075, and<br />
that values for the ratio <strong>of</strong> the compressibility<br />
in the organism(s) to the<br />
compressibility <strong>of</strong> seawater vary between<br />
0.850 and 1.075. Maaβ and<br />
Kuhnapfel (2009, personal communication)<br />
give sound speed values for<br />
various organs in the human body<br />
ranging from 1400 to 1600 m/s.<br />
These values correspond to 0.93 to<br />
1.07 for a ratio <strong>of</strong> sound speed in s<strong>of</strong>t<br />
tissues to sound speed in seawater. It<br />
seems reasonable then to assume a<br />
value <strong>of</strong> 1.04 to 1.12 for the ratio <strong>of</strong><br />
sound speed in the animal to that <strong>of</strong><br />
fresh water in the tank.<br />
A considerable amount <strong>of</strong> research<br />
into the acoustic signature(s) <strong>of</strong> marine<br />
organisms has been accumulated,<br />
demonstrating the potential to identify<br />
marine animals by their acoustic signature.<br />
This work has included experimental<br />
studies in tanks, field observations,<br />
computer modeling, and theoretical<br />
work (Greenlaw and Johnson, 1982;<br />
Foote, 1990; Stanton et al., 1998a,b;<br />
Stanton and Chu, 2000; Roberts and<br />
Jaffe, 2008; Fornshell, 2008; Jones<br />
et al., 2009). The work done so far has<br />
clearly established the efficacy and the<br />
potential <strong>of</strong> using acoustic detection<br />
68 <strong>Marine</strong> Technology Society Journal<br />
methods to sample the plankton. The<br />
ability to differentiate between taxa<br />
has been achieved (Wiebe et al., 1996;<br />
Stanton et al., 1998a,b; Lavery et al.,<br />
2007; Roberts and Jaffe, 2008). Identification<br />
to taxonomic categories below<br />
the phylum or the class level requires a<br />
significant amount <strong>of</strong> data processing<br />
and sampling at multiple frequencies<br />
(see Stanton et al. in Medwin, 2005).<br />
In our current study, we have<br />
used the absorption between 30 and<br />
120 kHz, notably a significantly narrow<br />
range <strong>of</strong> frequencies, compared<br />
withearlierworkwheretwoorthree<br />
orders <strong>of</strong> magnitude frequency ranges<br />
were employed and generally speaking<br />
implying reduced hardware, signal<br />
processing, and data storage demands<br />
than higher frequency methods. The<br />
species in our study are much more<br />
closely related to each other than<br />
those in earlier works where taxa were<br />
differentiated. S. <strong>mantis</strong>, N. norvegicus,<br />
FIGURE 1<br />
H. americanus are all members <strong>of</strong> the<br />
class Malacostraca. The last two are<br />
in the same order, Decapoda, and family,<br />
Nephropidae (Ruppert et al.,<br />
1996). The morphology <strong>of</strong> the three<br />
species is similar in that they display<br />
the basic crustacean body plan but<br />
sufficiently different that it may be<br />
expected to produce significantly different<br />
acoustic signatures.<br />
Experimental studies on the acoustic<br />
signature <strong>of</strong> various manmade targets,<br />
some with internal inconsistencies in<br />
their physical and acoustic properties,<br />
have displayed acoustic signatures,<br />
which could be related to nonuniformities<br />
in internal structure <strong>of</strong> the SONAR<br />
target. In earlier research projects,<br />
Whispering-gallery Waves or Rayleigh<br />
Waves with wave spectra characteristics<br />
<strong>of</strong> physical nonuniformities in<br />
the targets were used to identify internal<br />
flaws in the structure <strong>of</strong> the SONAR targets.<br />
This resulted from the condition<br />
The experimental set up in the calibration tank at the NURC. The arrival times at the receiving<br />
transducer for the initial signal, target, surface, and bottom reverberation are shown. Data collection<br />
was always terminated before sidewall reverberations arrived.
that Rayleigh Waves display dispersion<br />
in the presence <strong>of</strong> density/sound velocity<br />
variations in the medium. Such waves<br />
are relatively easy to detect in the reverberation<br />
from an object in water (Tesei<br />
et al., 2007, 2008). The back scattering<br />
may also include Lamb waves, a special<br />
form <strong>of</strong> Rayleigh Waves resulting from<br />
the displacement <strong>of</strong> a boundary between<br />
layers <strong>of</strong> significantly differing densities<br />
and sound velocities (Oraevsky, 2002).<br />
These displacements propagate both in<br />
the plane <strong>of</strong> the boundary layer and perpendicular<br />
to it. These waves are produced<br />
in experimental studies and in<br />
field studies in pelagic and benthic environments<br />
(Zampolli et al., 2008).<br />
The acoustic backscattering from the<br />
periwinkle, Littorina littorea, has been<br />
shown to be characterized by Lamb<br />
waves (Warren et al., 2002). In the present<br />
work, we take advantage <strong>of</strong> this phenomenon<br />
to observe the backscattering<br />
spectrum <strong>of</strong> living organisms. A clear<br />
view <strong>of</strong> the knowledge <strong>of</strong> the spectrum<br />
<strong>of</strong> the backscatter from marine crustaceans<br />
can best be obtained in carefully<br />
controlled tank experiments. With<br />
such knowledge, it may eventually be<br />
possible to identify objects on or imbedded<br />
in bottom sediments.<br />
Experimental Methods<br />
The experimental setup and procedures<br />
follow closely those described in<br />
experiments on solid spheres (Tesei<br />
et al., 2008). The acoustic signature<br />
<strong>of</strong> each <strong>of</strong> the three species was measured<br />
in the calibration tank at the<br />
NATO Undersea Research Center,<br />
whichis4.5×3×2.3m,hassteel<br />
walls and bottom, and is filled with<br />
fresh water. The animals were suspended<br />
with a thin nylon wire with<br />
their dorsal side up and long axis <strong>of</strong><br />
the body in the horizontal. The source<br />
ResonTC2138waslocatedatmid-<br />
FIGURE 2<br />
(A) Normalized acoustic intensity as a function <strong>of</strong> wavelength from 20 to 120 kHz for <strong>Squilla</strong><br />
<strong>mantis</strong>. (B) Normalized intensity as a function <strong>of</strong> wavelength from 20 to 120 kHz for Homarus<br />
americanus. (C) Normalized intensity as a function <strong>of</strong> wavelength from 20 to 120 kHz for Nephrops<br />
norvegicus.<br />
water at one end <strong>of</strong> the tank. Although<br />
its sensitivity is roughly flat between<br />
40 and 100 kHz, the high signal-tonoise<br />
ratio made it possible to obtain<br />
useful data from about 15 to 100 kHz.<br />
The receiver was an omni-directional<br />
hydrophone with a roughly flat response<br />
between 1 and 300 kHz. As shown in<br />
Figure 1, it was located on the transmission<br />
axis between transmitter and target<br />
September/October 2010 Volume 44 Number 5 69
FIGURE 3<br />
(A) Absorption spectra for <strong>Squilla</strong> <strong>mantis</strong> from 20 to 120 kHz. The frequencies indicated are those for which the reflected intensity was less than 5% <strong>of</strong><br />
the incident intensity.<br />
<strong>Squilla</strong> <strong>mantis</strong> acoustic signature<br />
Rotation angles 000-315 (degrees) and frequency (kHz)<br />
000<br />
(m)<br />
045<br />
(m)<br />
090<br />
(m)<br />
135<br />
(m)<br />
180<br />
(m)<br />
225<br />
(m)<br />
270<br />
(m)<br />
315<br />
(m)<br />
Frequency<br />
(kHz)<br />
20<br />
22<br />
X X X 24<br />
X X X X 26<br />
X X 28<br />
30<br />
X X 32<br />
X 34<br />
X X 36<br />
X X X X X 38<br />
X X X X 40<br />
X X X X 42<br />
X X X X X 44<br />
X X 46<br />
X X 48<br />
X X X X 50<br />
X X X X 52<br />
X X X X X X 54<br />
X X X X 56<br />
X X 58<br />
60<br />
X 62<br />
64<br />
66<br />
68<br />
X 70<br />
X 72<br />
X 74<br />
X X 76<br />
X 78<br />
X 80<br />
X X 82<br />
continued<br />
70 <strong>Marine</strong> Technology Society Journal
Continued<br />
<strong>Squilla</strong> <strong>mantis</strong> acoustic signature<br />
Rotation angles 000-315 (degrees) and frequency (kHz)<br />
000<br />
(m)<br />
045<br />
(m)<br />
090<br />
(m)<br />
135<br />
(m)<br />
180<br />
(m)<br />
225<br />
(m)<br />
270<br />
(m)<br />
315<br />
(m)<br />
X 84<br />
X X 86<br />
X X 88<br />
X X X 90<br />
X X 92<br />
X X X X 94<br />
X X X X X 96<br />
X X 98<br />
X X X X X 100<br />
X X X X 102<br />
X X X X 104<br />
X X 106<br />
X X 108<br />
X X 110<br />
Frequency<br />
(kHz)<br />
(B) Absorption spectra for Homarus americanus from 20 to 120 kHz. The frequencies indicated are those for which the reflected intensity was less<br />
than 5% <strong>of</strong> the incident intensity.<br />
Homarus americanus acoustic signature<br />
Rotation angles 000-315 (degrees) and frequency (kHz)<br />
000 045 090 135<br />
(m)<br />
(m)<br />
(m)<br />
(m)<br />
180<br />
(m)<br />
225<br />
(m)<br />
270<br />
(m)<br />
315<br />
(m)<br />
Frequency<br />
(kHz)<br />
20<br />
22<br />
X X 24<br />
X X 26<br />
28<br />
X X X 30<br />
X X 32<br />
34<br />
X 36<br />
38<br />
40<br />
X 42<br />
X 44<br />
continued<br />
September/October 2010 Volume 44 Number 5 71
Continued<br />
Homarus americanus acoustic signature<br />
Rotation angles 000-315 (degrees) and frequency (kHz)<br />
000<br />
(m)<br />
045<br />
(m)<br />
090<br />
(m)<br />
135<br />
(m)<br />
180<br />
(m)<br />
225<br />
(m)<br />
270<br />
(m)<br />
315<br />
(m)<br />
X 46<br />
X X 48<br />
X X 50<br />
X X X 54<br />
X 56<br />
Frequency<br />
(kHz)<br />
52<br />
X 58<br />
X 60<br />
62<br />
X 64<br />
X X 66<br />
X 68<br />
X 70<br />
X 72<br />
X 74<br />
76<br />
78<br />
80<br />
X 82<br />
X 84<br />
X X X 86<br />
X X X 88<br />
X X 90<br />
X X 92<br />
X X X 94<br />
X 96<br />
98<br />
100<br />
X X 102<br />
X X 104<br />
106<br />
X 108<br />
110<br />
72 <strong>Marine</strong> Technology Society Journal<br />
continued
(C) Absorption spectra for Nephrops norvegicus from 20 to 120 kHz. The frequencies indicated are those for which the reflected intensity was less<br />
than 5% <strong>of</strong> the incident intensity. The letter (m) refers to experimentally measured values and the letter (i) refers to inferred values.<br />
Nephrops norvegicus acoustic signature<br />
Rotation angles 000-315 (degrees) and frequency (kHz)<br />
000<br />
(m)<br />
045<br />
(m)<br />
090<br />
(m)<br />
135<br />
(m)<br />
180<br />
(m)<br />
225<br />
(i)<br />
270<br />
(i)<br />
315<br />
(i)<br />
Frequency<br />
(kHz)<br />
20<br />
22<br />
X X 24<br />
26<br />
28<br />
30<br />
32<br />
34<br />
X 36<br />
X X 38<br />
40<br />
X X 42<br />
44<br />
46<br />
X 48<br />
50<br />
52<br />
54<br />
X 56<br />
58<br />
60<br />
62<br />
64<br />
X X 66<br />
68<br />
70<br />
72<br />
74<br />
X X 76<br />
78<br />
80<br />
82<br />
X X 84<br />
continued<br />
September/October 2010 Volume 44 Number 5 73
Continued<br />
Nephrops norvegicus acoustic signature<br />
Rotation angles 000-315 (degrees) and frequency (kHz)<br />
000<br />
(m)<br />
045<br />
(m)<br />
090<br />
(m)<br />
in such a way as to minimize the surface<br />
and the bottom interference. This constraint<br />
made it necessary to locate the<br />
object at about 1.1 m from the transducer<br />
and at about 0.6 m from the<br />
hydrophone. This is sufficient to<br />
allow far field measurements <strong>of</strong> the<br />
smallest animals at 30 kHz and values<br />
<strong>of</strong> ka > 5. The directionality <strong>of</strong> the<br />
source, having 30° <strong>of</strong> beam width<br />
null to null at 50 kHz and side lobes<br />
−20 dB down, allowed the complete illumination<br />
<strong>of</strong> a target without strong<br />
interferences with the tank boundaries<br />
and the water surface. The residual reverberation<br />
was mitigated by subtracting<br />
a coherent average <strong>of</strong> 20 pings <strong>of</strong><br />
scattering from the tank boundaries.<br />
Data were coherently averaged over<br />
20 pings and equalized in the spectral<br />
domain by using the direct measurement<br />
<strong>of</strong> the transmitted pulse on the<br />
same hydrophone. The target strength<br />
data were Hamming windowed before<br />
applying an inverse Fourier transform<br />
135<br />
(m)<br />
180<br />
(m)<br />
X X X X 88<br />
90<br />
92<br />
94<br />
X X X 96<br />
98<br />
100<br />
X 102<br />
104<br />
106<br />
X 108<br />
110<br />
74 <strong>Marine</strong> Technology Society Journal<br />
225<br />
(i)<br />
to get a smooth time response. The<br />
transmitting and receiving transducers<br />
were calibrated to insure their proper<br />
functioning before beginning the<br />
data collection runs with live/fresh<br />
animals.<br />
The three crustaceans species were<br />
suspended with their anterior/posterior<br />
axis in the horizontal plane. These animals<br />
were alive when placed in the<br />
tank or very fresh with no signs <strong>of</strong><br />
decay or decomposition. The three<br />
crustacean species were insonified at<br />
30 to 120 kHz at eight different aspects:<br />
0°, 45°, 90°, 135°, 180°, 225°,<br />
270°, and 315°. The separate source,<br />
receiver, and targets (specimens) were<br />
positioned so that there was a minimum<br />
<strong>of</strong> effects from surface, bottom,<br />
and tank sidewall reverberations. The<br />
calibration tank is 2.5 m deep, 3.5 m<br />
long, and 4.5 m wide. It is filled with<br />
fresh water. The tank geometry is<br />
shown diagrammatically in Figure 1.<br />
All acoustic observations were made<br />
270<br />
(i)<br />
315<br />
(i)<br />
Frequency<br />
(kHz)<br />
86<br />
at ka values greater than 5, where k is<br />
the acoustic wave number, 2π/λ, with<br />
λ = wave length, and a is the object<br />
characteristic dimension (the length<br />
or width <strong>of</strong> the animal depending on<br />
whetheritisviewedend-onorfrom<br />
the side). This insured that geometrical<br />
backscattering was occurring, resulting<br />
in minimizing the effects <strong>of</strong> frequency<br />
on the target strength.<br />
The data were analyzed by performing<br />
a finite fast Fourier analysis<br />
to determine the spectra <strong>of</strong> the<br />
backscattered signal. Only the acoustic<br />
signal during a narrow time gate<br />
corresponding to the arrival time <strong>of</strong><br />
the backscattered signal form the target<br />
animals was analyzed. The spectra<br />
were examined to determine at which<br />
frequencies the signal strength was<br />
very weak,
correspondingly all plots given contain<br />
valid data only over this interval. (Note<br />
that any data plotted outside <strong>of</strong> this<br />
interval is present only as a by-product<br />
<strong>of</strong> convenient data/signal processing<br />
procedures and does not affect the<br />
accuracy <strong>of</strong> the 20- to 120-kHz band<br />
<strong>of</strong> interest.)<br />
Each specimen was insonified in the<br />
frequency range <strong>of</strong> 30 to 120 kHz at<br />
different aspects (0°, 45°, 90°, 135°,<br />
and 180° for all three specimens and<br />
225°, 270°, and 315° for H. americanus<br />
and S. <strong>mantis</strong>). Each species studied<br />
showed a unique absorption spectrum.<br />
The plotting routine used in the data<br />
analysis displayed the acoustic signal<br />
strength in 2-kHz bands.<br />
Results<br />
S. <strong>mantis</strong>, <strong>mantis</strong>shrimp,was<br />
placed in the tank with its longitudinal<br />
axis horizontal with the head toward<br />
the source and rotated clockwise—as<br />
in all three crustaceans. S. <strong>mantis</strong> has<br />
more absorption bands in the 20- to<br />
60-kHz range than it does in the<br />
60- to 120-kHz range (Figures 2A<br />
and3A).Italsoshowedmorewideabsorption<br />
bands when viewed from<br />
the right-hand side, 225° to 315°,<br />
than from the left-hand side, 45° to<br />
135°. There is an anterior posterior<br />
asymmetry in the morphology <strong>of</strong> the<br />
<strong>mantis</strong> shrimp. The specimen used in<br />
this experiment was in the process <strong>of</strong><br />
regenerating its right-hand raptorial<br />
appendage. The regenerating appendage<br />
present was much smaller than<br />
the normal-sized raptorial appendage<br />
on the left-hand side <strong>of</strong> this specimen.<br />
The absorption bands were wider on<br />
the right-hand side than on the lefthand<br />
side. This may have accounted<br />
for the observed differences. A similar<br />
asymmetry naturally exists in<br />
H. americanus (Williams, 1984).<br />
FIGURE 4<br />
(A) Time–frequency spectrogram for <strong>Squilla</strong> <strong>mantis</strong> at an aspect <strong>of</strong> 0°. The signal is normalized<br />
to the maximum backscatter as 0 dB. (B) Time–frequency spectrogram for Homarus americanus<br />
at an aspect <strong>of</strong> 0°. The signal is normalized to the maximum backscatter as 0 dB. (C) Time–<br />
frequency spectrogram for Nephrops norvegicus at an aspect <strong>of</strong> 0°. The signal is normalized to<br />
the maximum backscatter as 0 dB.<br />
The frequency versus time representation<br />
(spectrogram) <strong>of</strong> S. <strong>mantis</strong><br />
data for the 0° aspect shows two very<br />
strong pulses arriving about 0.1 ms be-<br />
fore the main reverberation response.<br />
The main response persists for 0.1 ms<br />
and is followed by a weaker response,<br />
about 30% <strong>of</strong> the initial reverberation<br />
September/October 2010 Volume 44 Number 5 75
strength for another 0.3 ms (Figures<br />
4A and 5A). The spectrogram<br />
for S. <strong>mantis</strong> for the 180° aspect displays<br />
three closely spaced reverberations followed<br />
by weaker reverberations lasting<br />
for 0.3 ms (Figures 6A and 7A).<br />
H. americanus, the American lobster,<br />
displays fewer strong absorption<br />
bands on the left-hand side than on<br />
the right-hand side. As is normal, the<br />
left-hand claw <strong>of</strong> this specimen was<br />
modified as a crushing claw, which is<br />
much stronger and larger than the<br />
right-hand tearing claw. Except for<br />
the right posterior quarter and righthand<br />
side, all <strong>of</strong> the absorption bands<br />
are relatively narrow. In general, the<br />
acoustic signature <strong>of</strong> H. americanus<br />
was much stronger than that <strong>of</strong> the preceding<br />
specimens (Figures 2B and 3B).<br />
The spectrogram for the 0° aspect<br />
shows a strong narrow band followed<br />
by a weaker band about 30% <strong>of</strong> the<br />
maximum, reverberation arriving in<br />
the following 0.05 ms (Figures 4B<br />
and5B).Between0.2and0.3ms<br />
after the initial signal arrives, a much<br />
weaker signal, 10% to 15% <strong>of</strong> the initial<br />
target strength, arrives. The latter<br />
may either come from internal reflections<br />
or the uropods and telson. The<br />
frequency versus time spectrogram<br />
for the 180° aspect showed a very strong<br />
initial reverberation quickly, followed<br />
by reverberations about 30% <strong>of</strong> the initial<br />
intensity during the first 0.1 ms<br />
(Figures 6B and 7B). There are relatively<br />
weak,
FIGURE 6<br />
(A) Time–frequency spectrogram for <strong>Squilla</strong> <strong>mantis</strong> at an aspect <strong>of</strong> 180°. The signal is normalized<br />
to the maximum backscatter as 0 dB. (B) Time–frequency spectrogram for Homarus americanus<br />
at an aspect <strong>of</strong> 180°. The signal is normalized to the maximum backscatter as 0 dB. (C) Time–<br />
frequency spectrogram for Nephrops norvegicus at an aspect <strong>of</strong> 180°. The signal is normalized to<br />
the maximum backscatter as 0 dB.<br />
N. norvegicus, the Norway lobster,<br />
had the highest reflectivity <strong>of</strong> the four<br />
species in this study. This animal is<br />
bilaterally symmetric, lacking the<br />
crushing/tearing claw pattern <strong>of</strong> the<br />
American lobster. In anterior view, it<br />
reflected more than 5% <strong>of</strong> the incident<br />
acoustic energy throughout the entire<br />
spectrum <strong>of</strong> this study. There were<br />
no absorption bands in the frontal,<br />
0° aspect. When viewed from the<br />
side, 90°, there was only one absorption<br />
band, three in the 45° aspect,<br />
five in the 135° aspect, and six in the<br />
posterior, 180° aspect. There was a significant<br />
anterior posterior asymmetry<br />
in N. norvegicus (Figures 2C & 3C).<br />
The spectrogram for the 0° aspect<br />
<strong>of</strong> N. norvegicus showed a sharp initial<br />
peak with closely spaced weaker<br />
reverberations. A second wave <strong>of</strong> reverberations<br />
at about 30% <strong>of</strong> the<br />
initial intensity arrived 0.1 ms later<br />
(Figures 4C and 5C). The frequency<br />
versus time spectrogram for the 180°<br />
aspect <strong>of</strong> N. norvegicus showed a reverberation<br />
<strong>of</strong> about 50% <strong>of</strong> the peak reverberation<br />
strength, arriving 0.1 ms<br />
before the peak, a second such peak<br />
at about 0.05 ms before the peak,<br />
and a third about 0.1 ms after the arrival<br />
<strong>of</strong> the peak strength reverberation<br />
(Figures 6C and 7C). There were several<br />
reverberations at about 15% <strong>of</strong> the<br />
peak level throughout the spectrogram.<br />
These additional reverberations<br />
may have resulted from interaction <strong>of</strong><br />
the incident sound waves with the<br />
animal’s appendages and/or they were<br />
internal reflections.<br />
The spectra change with aspect, but<br />
none were common between species.<br />
Previous papers have shown the potential<br />
to differentiate between very different<br />
species, such as periwinkles and<br />
euphausiids, which are on the order<br />
<strong>of</strong> tens <strong>of</strong> millimeters, but with fundamentally<br />
different body plans (Jones,<br />
2009, and Stanton et al. in Medway,<br />
2005). Alternately, Stanton and Chu<br />
(2000) showed the capacity to differentiate<br />
between crustaceans, euphausiids,<br />
and copepods, albeit the size differences<br />
were two orders <strong>of</strong> magnitude, tens <strong>of</strong><br />
September/October 2010 Volume 44 Number 5 77
FIGURE 7<br />
(A) Frequency response in graphical form is shown in this figure. These are the data displayed in<br />
Figure 6A for the 180° aspect. (B) Frequency response in graphical form is shown in this figure.<br />
These are the data displayed in Figure 6B for the 180° aspect. (C) Frequency response in graphical<br />
form is shown in this figure. These are the data displayed in Figure 6C for the 180° aspect.<br />
78 <strong>Marine</strong> Technology Society Journal<br />
mm versus hundreds <strong>of</strong> microns. The<br />
species in this study were all in the order<br />
<strong>of</strong> hundreds <strong>of</strong> millimeters. All were<br />
arthropod crustaceans and two in fact<br />
were decapods. This was a positive<br />
step in developing an acoustic classification<br />
system for use in marine surveys.<br />
Discussion<br />
The potential for using acoustic<br />
spectra <strong>of</strong> marine animals as a taxonomic<br />
indicator was shown here to<br />
be a realistic objective. From this<br />
study, it appears that closely related<br />
species, like the decapods N. norvegicus<br />
and H. americanus, can be differentiated.<br />
This can also be done using a<br />
relatively narrow band <strong>of</strong> acoustic frequencies,<br />
20 to 120 kHz. The method<br />
suggested by Stanton et al. in Medway<br />
(2005) requires using a bandwidth <strong>of</strong><br />
twotothreeorders<strong>of</strong>magnitude.<br />
<strong>Acoustic</strong> signatures will require computer<br />
processing as is true <strong>of</strong> almost<br />
all oceanographic data. The acoustic<br />
signature <strong>of</strong> a single species will be a<br />
set <strong>of</strong> five to eight aspect specific absorption<br />
spectra with anywhere from<br />
one to tens <strong>of</strong> strong absorption regions<br />
in each aspect. Because they appear<br />
to be aspect dependent, relatively<br />
large numbers <strong>of</strong> potential spectra will<br />
be needed to identify different species.<br />
As <strong>of</strong> this writing, it is not possible to<br />
correlate with any certainty these differences<br />
in spectra with internal anatomy<br />
or external morphology. Such factors<br />
as chemical composition <strong>of</strong> s<strong>of</strong>t tissues,<br />
mineralization, or relative mineralization<br />
<strong>of</strong> the exoskeleton are also possible<br />
causative factors. A much larger database<br />
<strong>of</strong> course is required to make this<br />
method a viable option for population<br />
studies in the marine environment.<br />
Although the specimens were<br />
insonified at 30 to 120 kHz, the reverberations<br />
recorded were from as low as
20 to 120 kHz. The maximum reverberation<br />
frequency reported was<br />
115 kHz. This was an artifact <strong>of</strong> the<br />
data processing procedures.<br />
Although the specimens were suspended<br />
in the calibration tanks for<br />
these experiments, it is important to<br />
note that similar initial studies were<br />
applicable to the detection <strong>of</strong> targets<br />
on and in bottom sediments (Tesei et al.,<br />
2007, 2008). The use <strong>of</strong> this data to detect<br />
similar specimens on or in bottom<br />
sediments is a realistic expectation.<br />
Conclusions<br />
Different marine arthropod crustaceans<br />
have distinct acoustic absorption<br />
spectra, which can potentially be used<br />
for the identification <strong>of</strong> the animal.<br />
The absorption spectra are aspect dependent.<br />
These spectra are distinctly<br />
different for relatively closely related<br />
species such as members <strong>of</strong> the order<br />
Decapoda and the Infraorder Astacidea.<br />
Acknowledgments<br />
The NATO Undersea Research<br />
Centre (Italy) is gratefully acknowledged<br />
for having hosted John Fornshell<br />
and Paul Fox as Visiting Scientists during<br />
the period <strong>of</strong> the experimental work<br />
undertaken under the NURC Visiting<br />
Researchers Program 2009 and for<br />
providing all related facilities, support,<br />
and finance during that period. The<br />
Smithsonian Institution (USA) and<br />
the Institute <strong>of</strong> Sound and Vibration<br />
Research (UK) are also thanked for<br />
their affiliated support during the completion<br />
<strong>of</strong> the work.<br />
Lead Author:<br />
John A. Fornshell, Ph.D.<br />
NATO Undersea Research Centre<br />
(NURC) and National Museum<br />
<strong>of</strong> Natural History Department<br />
<strong>of</strong> Invertebrate Zoology, Smithsonian<br />
Institution, Washington, DC 20560<br />
Email: johnfornshell@hotmail.com<br />
References<br />
Ambella, A.M., Mancusi, R., Mancusi, C.<br />
2006. Assessment <strong>of</strong> the status <strong>of</strong> the coastal<br />
ground fish assemblage exploited by the<br />
Viareggio fleet. Agenzia Regionale Protezione<br />
Ambiente Tuscona, Area MARE, Via Marradi<br />
114, Livorno, Italy.<br />
Atkinson, James, R., Froglia, C., Arneri, E.,<br />
Antonolini, B. 1997. Observations on the<br />
burrows and burrowing behaviour <strong>of</strong>: <strong>Squilla</strong><br />
<strong>mantis</strong> L. Crustacea:Stomatopoda. Mar Ecol.<br />
18(4):337-59. doi:10.1111/j.1439-0485.<br />
1997.tb00446.x.<br />
Bouwma, P.E., Herrnkind, W.F. 2009.<br />
Sound production in Caribbean spiny lobster<br />
Panulirus argus and its role in escape<br />
during predatory attack By Octopus briareus.<br />
N Z J Mar Freshw Res. 43:3-13. doi:10.1080/<br />
00288330909509977.<br />
Foote, K.G. 1990. Speed <strong>of</strong> sound if in<br />
Euphausia superba. J Acoust Soc Am.<br />
87(4):1405-8. doi:10.1121/1.399436.<br />
Fornshell, J.A. 2008. <strong>Acoustic</strong> detection <strong>of</strong><br />
small mesoplankton such as copepod nauplii<br />
in the marine environment. Mar Technol<br />
Soc J. 42(2):62-4. doi:10.4031/<br />
002533208786829089.<br />
Greenlaw, C.F., Johnson, R.K. 1982. Physical<br />
and acoustical properties <strong>of</strong> zooplankton.<br />
J Acoust Soc Am. 72(6):1706-10.<br />
doi:10.1121/1.388663.<br />
Henninger, H.P., Watson, W.H., III 2006.<br />
Mechanisms underlying the production <strong>of</strong><br />
carapace vibrations and associated waterborne<br />
sounds in the American lobster. J Exp Biol.<br />
208:3421-9. doi:10.1242/jeb.01771.<br />
Jones, B.A., Lavery, A.C., Stanton, T.K.<br />
2009. Use <strong>of</strong> the distorted wave born<br />
approximation to predict scattering by<br />
inhomogeneous objects: Application to squid.<br />
J Acoust Soc Am. 125(1):73-88.<br />
doi:10.1121/1.3021298.<br />
Lavery, A.C., Wiebe, P. H., Stanton, T.K.,<br />
Lawson, G.L., Benfield, M.C., Copley, N.<br />
2007. Determining dominant scatters <strong>of</strong><br />
sound in mixed populations <strong>of</strong> zooplankton.<br />
J Acoust Soc Am.122(6):3304-26.<br />
doi:10.1121/1.2793613.<br />
Maaβ, H., Kuhnapfel, U. 2009. Noninvasive<br />
measurement <strong>of</strong> elastic properties <strong>of</strong> living<br />
tissue. Personal communication.<br />
Maynou, F., Abello, P., Sartor, P. 2004. A<br />
review <strong>of</strong> the Fisheries biology <strong>of</strong> the <strong>mantis</strong><br />
shrimp, <strong>Squilla</strong> <strong>mantis</strong> (Linnaeus, 1758)<br />
(Stomatopoda, Squillidae) in the Mediterranean.<br />
Crustaceana. 77(9):1081-99.<br />
Medwin, H. 2005. Sounds in the Sea: From<br />
Ocean <strong>Acoustic</strong>s to <strong>Acoustic</strong>al Oceanography.<br />
New York: Cambridge University Press.<br />
643 pp.<br />
Mendelson, M. 1969. Electrical and<br />
mechanical characteristics <strong>of</strong> a very fast<br />
Lobster muscle. J Cell Biol. 42:548-63.<br />
doi:10.1083/jcb.42.2.548.<br />
Oraevsky, A.N. 2002. Whispering-gallery<br />
waves. Quantum Elec. 32(5):377-400.<br />
doi:10.1070/QE2002v032n05ABEH002205.<br />
Patek, S.N., Caldwell, R.L. 2006. The<br />
Stomatopod rumble: Low frequency sound<br />
production in Hemisquilla californiensis.<br />
Mar. Freshw. Behav. Physiol. 39(2):99-111.<br />
doi:10.1080/10236240600563289.<br />
Roberts, P.L.D., Jaffe, J.S. 2008. Classification<br />
<strong>of</strong> live, untethered zooplankton from observations<br />
<strong>of</strong> multiple-angle acoustic scatter.<br />
J Acoust Soc Am. 124(2):796-802.<br />
doi:10.1121/1.2945114.<br />
Ruppert, E.L., Barnes, R.D. 1996. Invertebrate<br />
Zoology. 6th ed. Fort Worth,<br />
Texas: Saunders College Publishing Co.<br />
1056 pp.<br />
Staaterman, E.R., Claverie, T., Patek, S.N.<br />
2010. Disentangling defence: The function <strong>of</strong><br />
spiny lobster sounds. Behavior. 147:235-58.<br />
doi:10.1163/000579509X12523919243428.<br />
September/October 2010 Volume 44 Number 5 79
Stanton, T.K., Chu, D. 2000. Review and<br />
recommendations for the modeling <strong>of</strong> acoustic<br />
back scattering by fluid-like elongated<br />
zooplankton: Euphausids and copepods. ICES<br />
J Mar Sci. 57:793-807. doi:10.1006/<br />
jmsc.1999.0517.<br />
Stanton, T.K., Chu, D., Wiebe, P.H. 1998a.<br />
Sound scattering by several zooplankton<br />
groups: II. Scattering models. J Acoust Soc<br />
Am. 103(1):236-53. doi:10.1121/1.421110.<br />
Stanton, T.K., Chu, D., Wiebe, P.H.,<br />
Martin, L.V., Eastwood, R.L. 1998b. Sound<br />
scattering by several zooplankton groups:<br />
I. Experimental determination <strong>of</strong> dominate<br />
scattering mechanisms. J Acoust Soc Am.<br />
103(1):225-35. doi:10.1121/1.421469.<br />
Tesei, A., Fawcett, J.A., Lim, R. 2007.<br />
Physics-based detection <strong>of</strong> man-made elastic<br />
objects buried in high-density-clutter areas <strong>of</strong><br />
saturated sediments. Appl Acoust. 69:422-37.<br />
doi:10.1016/j.apacoust.2007.04.002.<br />
Tesei, A., Guerrini, P., Zampolli, M. 2008.<br />
Tank measurements <strong>of</strong> scattering from a<br />
resin-filled fiberglass spherical shell with<br />
internal flaws. J Acoust Soc Am. 124(2):827-40.<br />
doi:10.1121/1.2945701.<br />
Ungaro, N., Marano, C.A., Ceriola, C.,<br />
Ceriola, L. 2005. Distribution <strong>of</strong> demersal<br />
crustaceans in the southern Adriatic Sea.<br />
Acta Adriat. 46(1):27-40.<br />
Warren, J.D., Stanton, T.K., McGehee, D.E.,<br />
Chu, D. 2002. Effect <strong>of</strong> animal orientation on<br />
acoustic estimates <strong>of</strong> zooplankton properties.<br />
IEEE J Oceanic Eng. 89-99.<br />
Wiebe, P.H., Mountain, D.G., Stanton, T.K.,<br />
Green, C.H., Lough, G., Kaarrtvedt, S.,<br />
Dawson, J., Copley, N. 1996. <strong>Acoustic</strong>al study<br />
<strong>of</strong> the spatial distribution <strong>of</strong> plankton on<br />
Georges Bank and the relationship between<br />
volume backscattering strength and the<br />
taxonomic composition <strong>of</strong> the plankton.<br />
Deep-Sea Res, Part 2. Top Stud Oceanogr.<br />
40:1971-2001. doi:10.1016/S0967-<br />
0645(96)00039-2.<br />
80 <strong>Marine</strong> Technology Society Journal<br />
Williams, A.B. 1984. Shrimps, Lobsters, and<br />
Crabs <strong>of</strong> the Atlantic Coast <strong>of</strong> the United<br />
States, Maine to Florida. Washington, DC:<br />
Smithsonian Institution Press.<br />
Zampolli, M., Jensen, F.B., Tesei, A. 2008.<br />
Benchmark problems for acoustic scattering<br />
from elastic objects in the free field and near<br />
the sea floor. J Acoust Soc Am 125(1):89-98.


