Design and performance of an open jet wind tunnel for aero ...
Design and performance of an open jet wind tunnel for aero ...
Design and performance of an open jet wind tunnel for aero ...

Create successful ePaper yourself
Turn your PDF publications into a flip-book with our unique Google optimized e-Paper software.
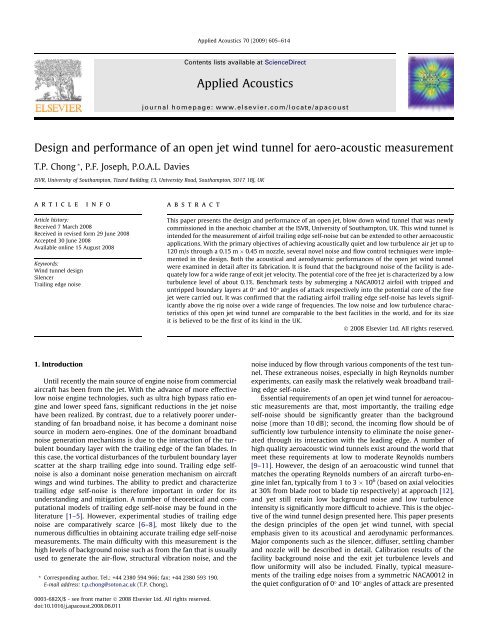
<strong>Design</strong> <strong><strong>an</strong>d</strong> <strong>per<strong>for</strong>m<strong>an</strong>ce</strong> <strong>of</strong> <strong>an</strong> <strong>open</strong> <strong>jet</strong> <strong>wind</strong> <strong>tunnel</strong> <strong>for</strong> <strong>aero</strong>-acoustic measurement<br />
T.P. Chong *, P.F. Joseph, P.O.A.L. Davies<br />
ISVR, University <strong>of</strong> Southampton, Tizard Building 13, University Road, Southampton, SO17 1BJ, UK<br />
article info<br />
Article history:<br />
Received 7 March 2008<br />
Received in revised <strong>for</strong>m 29 June 2008<br />
Accepted 30 June 2008<br />
Available online 15 August 2008<br />
Keywords:<br />
Wind <strong>tunnel</strong> design<br />
Silencer<br />
Trailing edge noise<br />
1. Introduction<br />
abstract<br />
Until recently the main source <strong>of</strong> engine noise from commercial<br />
aircraft has been from the <strong>jet</strong>. With the adv<strong>an</strong>ce <strong>of</strong> more effective<br />
low noise engine technologies, such as ultra high bypass ratio engine<br />
<strong><strong>an</strong>d</strong> lower speed f<strong>an</strong>s, signific<strong>an</strong>t reductions in the <strong>jet</strong> noise<br />
have been realized. By contrast, due to a relatively poorer underst<strong><strong>an</strong>d</strong>ing<br />
<strong>of</strong> f<strong>an</strong> broadb<strong><strong>an</strong>d</strong> noise, it has become a domin<strong>an</strong>t noise<br />
source in modern <strong>aero</strong>-engines. One <strong>of</strong> the domin<strong>an</strong>t broadb<strong><strong>an</strong>d</strong><br />
noise generation mech<strong>an</strong>isms is due to the interaction <strong>of</strong> the turbulent<br />
boundary layer with the trailing edge <strong>of</strong> the f<strong>an</strong> blades. In<br />
this case, the vortical disturb<strong>an</strong>ces <strong>of</strong> the turbulent boundary layer<br />
scatter at the sharp trailing edge into sound. Trailing edge selfnoise<br />
is also a domin<strong>an</strong>t noise generation mech<strong>an</strong>ism on aircraft<br />
wings <strong><strong>an</strong>d</strong> <strong>wind</strong> turbines. The ability to predict <strong><strong>an</strong>d</strong> characterize<br />
trailing edge self-noise is there<strong>for</strong>e import<strong>an</strong>t in order <strong>for</strong> its<br />
underst<strong><strong>an</strong>d</strong>ing <strong><strong>an</strong>d</strong> mitigation. A number <strong>of</strong> theoretical <strong><strong>an</strong>d</strong> computational<br />
models <strong>of</strong> trailing edge self-noise may be found in the<br />
literature [1–5]. However, experimental studies <strong>of</strong> trailing edge<br />
noise are comparatively scarce [6–8], most likely due to the<br />
numerous difficulties in obtaining accurate trailing edge self-noise<br />
measurements. The main difficulty with this measurement is the<br />
high levels <strong>of</strong> background noise such as from the f<strong>an</strong> that is usually<br />
used to generate the air-flow, structural vibration noise, <strong><strong>an</strong>d</strong> the<br />
* Corresponding author. Tel.: +44 2380 594 966; fax: +44 2380 593 190.<br />
E-mail address: t.p.chong@soton.ac.uk (T.P. Chong).<br />
0003-682X/$ - see front matter Ó 2008 Elsevier Ltd. All rights reserved.<br />
doi:10.1016/j.apacoust.2008.06.011<br />
Applied Acoustics 70 (2009) 605–614<br />
Contents lists available at ScienceDirect<br />
Applied Acoustics<br />
journal homepage: www.elsevier.com/locate/apacoust<br />
This paper presents the design <strong><strong>an</strong>d</strong> <strong>per<strong>for</strong>m<strong>an</strong>ce</strong> <strong>of</strong> <strong>an</strong> <strong>open</strong> <strong>jet</strong>, blow down <strong>wind</strong> <strong>tunnel</strong> that was newly<br />
commissioned in the <strong>an</strong>echoic chamber at the ISVR, University <strong>of</strong> Southampton, UK. This <strong>wind</strong> <strong>tunnel</strong> is<br />
intended <strong>for</strong> the measurement <strong>of</strong> airfoil trailing edge self-noise but c<strong>an</strong> be extended to other <strong>aero</strong>acoustic<br />
applications. With the primary objectives <strong>of</strong> achieving acoustically quiet <strong><strong>an</strong>d</strong> low turbulence air <strong>jet</strong> up to<br />
120 m/s through a 0.15 m 0.45 m nozzle, several novel noise <strong><strong>an</strong>d</strong> flow control techniques were implemented<br />
in the design. Both the acoustical <strong><strong>an</strong>d</strong> <strong>aero</strong>dynamic <strong>per<strong>for</strong>m<strong>an</strong>ce</strong>s <strong>of</strong> the <strong>open</strong> <strong>jet</strong> <strong>wind</strong> <strong>tunnel</strong><br />
were examined in detail after its fabrication. It is found that the background noise <strong>of</strong> the facility is adequately<br />
low <strong>for</strong> a wide r<strong>an</strong>ge <strong>of</strong> exit <strong>jet</strong> velocity. The potential core <strong>of</strong> the free <strong>jet</strong> is characterized by a low<br />
turbulence level <strong>of</strong> about 0.1%. Benchmark tests by submerging a NACA0012 airfoil with tripped <strong><strong>an</strong>d</strong><br />
untripped boundary layers at 0° <strong><strong>an</strong>d</strong> 10° <strong>an</strong>gles <strong>of</strong> attack respectively into the potential core <strong>of</strong> the free<br />
<strong>jet</strong> were carried out. It was confirmed that the radiating airfoil trailing edge self-noise has levels signific<strong>an</strong>tly<br />
above the rig noise over a wide r<strong>an</strong>ge <strong>of</strong> frequencies. The low noise <strong><strong>an</strong>d</strong> low turbulence characteristics<br />
<strong>of</strong> this <strong>open</strong> <strong>jet</strong> <strong>wind</strong> <strong>tunnel</strong> are comparable to the best facilities in the world, <strong><strong>an</strong>d</strong> <strong>for</strong> its size<br />
it is believed to be the first <strong>of</strong> its kind in the UK.<br />
Ó 2008 Elsevier Ltd. All rights reserved.<br />
noise induced by flow through various components <strong>of</strong> the test <strong>tunnel</strong>.<br />
These extr<strong>an</strong>eous noises, especially in high Reynolds number<br />
experiments, c<strong>an</strong> easily mask the relatively weak broadb<strong><strong>an</strong>d</strong> trailing<br />
edge self-noise.<br />
Essential requirements <strong>of</strong> <strong>an</strong> <strong>open</strong> <strong>jet</strong> <strong>wind</strong> <strong>tunnel</strong> <strong>for</strong> <strong>aero</strong>acoustic<br />
measurements are that, most import<strong>an</strong>tly, the trailing edge<br />
self-noise should be signific<strong>an</strong>tly greater th<strong>an</strong> the background<br />
noise (more th<strong>an</strong> 10 dB); second, the incoming flow should be <strong>of</strong><br />
sufficiently low turbulence intensity to eliminate the noise generated<br />
through its interaction with the leading edge. A number <strong>of</strong><br />
high quality <strong>aero</strong>acoustic <strong>wind</strong> <strong>tunnel</strong>s exist around the world that<br />
meet these requirements at low to moderate Reynolds numbers<br />
[9–11]. However, the design <strong>of</strong> <strong>an</strong> <strong>aero</strong>acoustic <strong>wind</strong> <strong>tunnel</strong> that<br />
matches the operating Reynolds numbers <strong>of</strong> <strong>an</strong> aircraft turbo-engine<br />
inlet f<strong>an</strong>, typically from 1 to 3 10 6 (based on axial velocities<br />
at 30% from blade root to blade tip respectively) at approach [12],<br />
<strong><strong>an</strong>d</strong> yet still retain low background noise <strong><strong>an</strong>d</strong> low turbulence<br />
intensity is signific<strong>an</strong>tly more difficult to achieve. This is the objective<br />
<strong>of</strong> the <strong>wind</strong> <strong>tunnel</strong> design presented here. This paper presents<br />
the design principles <strong>of</strong> the <strong>open</strong> <strong>jet</strong> <strong>wind</strong> <strong>tunnel</strong>, with special<br />
emphasis given to its acoustical <strong><strong>an</strong>d</strong> <strong>aero</strong>dynamic <strong>per<strong>for</strong>m<strong>an</strong>ce</strong>s.<br />
Major components such as the silencer, diffuser, settling chamber<br />
<strong><strong>an</strong>d</strong> nozzle will be described in detail. Calibration results <strong>of</strong> the<br />
facility background noise <strong><strong>an</strong>d</strong> the exit <strong>jet</strong> turbulence levels <strong><strong>an</strong>d</strong><br />
flow uni<strong>for</strong>mity will also be included. Finally, typical measurements<br />
<strong>of</strong> the trailing edge noises from a symmetric NACA0012 in<br />
the quiet configuration <strong>of</strong> 0° <strong><strong>an</strong>d</strong> 10° <strong>an</strong>gles <strong>of</strong> attack are presented
606 T.P. Chong et al. / Applied Acoustics 70 (2009) 605–614<br />
<strong><strong>an</strong>d</strong> are shown to be between 10 dB <strong><strong>an</strong>d</strong> 30 dB above the background<br />
noise level. The low noise <strong><strong>an</strong>d</strong> low turbulence characteristics<br />
<strong>of</strong> this <strong>open</strong> <strong>jet</strong> <strong>wind</strong> <strong>tunnel</strong> are comparable to, or better th<strong>an</strong>,<br />
the best facilities in the world. This facility is believed to be the<br />
first <strong>of</strong> its kind in the UK.<br />
2. <strong>Design</strong> criteria<br />
The <strong>open</strong> <strong>jet</strong> <strong>wind</strong> <strong>tunnel</strong> is designed to fulfil the following<br />
acoustic <strong><strong>an</strong>d</strong> <strong>aero</strong>dynamic criteria:<br />
1. Airfoil trailing edge self-noise must be at least 10 dB above the<br />
facility noise over a wide b<strong><strong>an</strong>d</strong> <strong>of</strong> frequencies.<br />
2. Maximum Mach number <strong>of</strong> about 0.3.<br />
3. Typical turbulence intensity <strong>of</strong> less th<strong>an</strong> 0.5%.<br />
4. The <strong>jet</strong> working section is situated in the ISVR’s large <strong>an</strong>echoic<br />
chamber (8 m 8m 8 m) <strong>for</strong> the free field measurement <strong>of</strong><br />
the self-noise <strong>of</strong> objects located in the potential core <strong>of</strong> the <strong>jet</strong>.<br />
5. The air must be adequately exhausted from the <strong>an</strong>echoic<br />
chamber.<br />
The <strong>wind</strong> <strong>tunnel</strong> is designed to deliver a maximum mass flow<br />
rate <strong>of</strong> about 8 kg/s corresponding to a Mach number <strong>of</strong> about<br />
0.3 over a nozzle area <strong>of</strong> 0.0675 m 2 . The nozzle was chosen to have<br />
a large contraction ratio (CR) in order to reduce lateral velocity<br />
fluctuations <strong><strong>an</strong>d</strong> hence reduce the turbulence level <strong>of</strong> the exit <strong>jet</strong>.<br />
For such purpose the CR is usually taken as 20–25:1, which gives<br />
the inlet area <strong>of</strong> the nozzle between 1.35 m 2 <strong><strong>an</strong>d</strong> 1.70 m 2 .<br />
Air is supplied from three t<strong>an</strong>ks with a total volume <strong>of</strong> 30 m 3 at<br />
2000 kPa pressure, which is released through a control valve. The<br />
use <strong>of</strong> t<strong>an</strong>ks supplied by a compressor is thought to be a quieter<br />
method <strong>of</strong> delivering air th<strong>an</strong> the use <strong>of</strong> a f<strong>an</strong>, although the latter<br />
Table 1<br />
Summary <strong>of</strong> the <strong>open</strong> <strong>jet</strong> <strong>wind</strong> <strong>tunnel</strong> running time at different mass flow rates <strong><strong>an</strong>d</strong><br />
exit <strong>jet</strong> speeds<br />
Mass flow rate (kg/s) Exit <strong>jet</strong> speed (m/s) Running time (s)<br />
2 24 313<br />
4 48 156<br />
6 73 104<br />
8 97 78<br />
Stage I<br />
From reservoir<br />
Stage II<br />
(H1)<br />
1.11<br />
(H1)<br />
1.03<br />
(S1)<br />
s<br />
(S1-S3)<br />
2.00<br />
1.03<br />
(H2)<br />
0.40<br />
(H2)<br />
2.00<br />
0.33 Nozzle<br />
(25:1)<br />
1.42<br />
1.30<br />
has the adv<strong>an</strong>tage that it <strong>of</strong>fers continuous operation. Table 1 summarizes<br />
the estimated running times <strong>of</strong> the <strong>open</strong> <strong>jet</strong> <strong>wind</strong> <strong>tunnel</strong> at<br />
different mass flow rates/<strong>jet</strong> speeds with the nozzle exit area <strong>of</strong><br />
(0.15 0.45) m 2 .<br />
3. Layout <strong>of</strong> the <strong>open</strong> <strong>jet</strong> <strong>wind</strong> <strong>tunnel</strong><br />
The layout <strong>of</strong> the quiet <strong>open</strong> <strong>jet</strong> facility is shown in Fig. 1. Air is<br />
stored in t<strong>an</strong>ks at 2000 kPa located upstream <strong>of</strong> the control valve.<br />
The control valve is located in the ro<strong>of</strong> space <strong>of</strong> the <strong>an</strong>echoic chamber,<br />
which reduces the downstream air pressure to 200 kPa. The air<br />
is then exp<strong><strong>an</strong>d</strong>ed in the 8 00 (20 cm) diameter steel pipe through a<br />
wide-<strong>an</strong>gle conical diffuser into a 1.3 m 2.4 m 4.1 m threepass<br />
silencer to attenuate the noise generated by the valve. After<br />
leaving the silencer the air is accelerated vertically towards the<br />
ground through a 3:1 contraction ratio (CR) 2D nozzle into a<br />
0.33 m 1.3 m 4 m duct located in the wall <strong>of</strong> the <strong>an</strong>echoic<br />
chamber. The air then turned by a 90°-curved diffuser <strong><strong>an</strong>d</strong> is exp<strong><strong>an</strong>d</strong>ed<br />
from <strong>an</strong> area <strong>of</strong> 0.33 m 1.3 m to 1.3 m 1.3 m over <strong>an</strong><br />
axial dist<strong>an</strong>ce <strong>of</strong> 1.4 m. The straightness <strong><strong>an</strong>d</strong> uni<strong>for</strong>mity <strong>of</strong> the air<br />
flow are improved by the use <strong>of</strong> a honeycomb <strong><strong>an</strong>d</strong> three fine woven<br />
wire mesh screens be<strong>for</strong>e entering a 1.3 m 1.3 m 2m splitter<br />
silencer, which also acts to settle the flow. Finally, further flow conditioning<br />
is achieved by the use <strong>of</strong> additional honeycomb <strong><strong>an</strong>d</strong> fine<br />
woven wire mesh screens be<strong>for</strong>e the air accelerates through a 3D<br />
25:1 CR nozzle. The nozzle has a rect<strong>an</strong>gular exit area <strong>of</strong><br />
0.15 m 0.45 m. The resulting maximum Reynolds number based<br />
on the hydraulic diameter at the nozzle exit is 1.5 10 6 . The nozzle<br />
exit is situated at the centre <strong>of</strong> the <strong>an</strong>echoic chamber. As shown<br />
in Fig. 1, the air <strong>jet</strong> is finally exhausted through a hole in the chamber<br />
wall directly opposite the nozzle into a large adjoining room<br />
from where the air leaves through doors <strong><strong>an</strong>d</strong> <strong>wind</strong>ows to the outside<br />
<strong>of</strong> the building. The dist<strong>an</strong>ce between the nozzle <strong><strong>an</strong>d</strong> the exhaust<br />
hole is about 4 m. The <strong>jet</strong> was slowed down <strong><strong>an</strong>d</strong> diffused<br />
inside the adjoining room. The tr<strong>an</strong>smission <strong>of</strong> residual noise from<br />
the adjoining room back to the <strong>an</strong>echoic chamber is reduced by the<br />
acoustic wedges on the chamber wall. Hence the excess noise is<br />
contained within the adjoining room <strong><strong>an</strong>d</strong> will not be picked up<br />
by the microphones inside the <strong>an</strong>echoic chamber. In the remainder<br />
<strong>of</strong> this section detailed descriptions <strong>of</strong> the various parts <strong>of</strong> the <strong>open</strong><br />
<strong>jet</strong> <strong>wind</strong> <strong>tunnel</strong> are presented.<br />
1.35<br />
(S4-S5)<br />
0.15<br />
θ<br />
Flow path<br />
Exhaust<br />
hole<br />
~4.00<br />
Chamber<br />
walls<br />
Chamber<br />
walls<br />
Fig. 1. Elevation view <strong>of</strong> the quiet, low turbulence blow down <strong>open</strong> <strong>jet</strong> <strong>wind</strong> <strong>tunnel</strong> in ISVR. All units in m.
3.1. Control valve<br />
As outlined above, a control valve was installed to regulate the<br />
flow rate <strong>of</strong> the compressed air into the <strong>wind</strong> <strong>tunnel</strong>. The ability <strong>of</strong><br />
the control valve to maintain a const<strong>an</strong>t <strong><strong>an</strong>d</strong> steady pressure is<br />
essential to ensure the stability <strong>of</strong> the exit <strong>jet</strong> velocity. An un<strong>for</strong>tunate<br />
consequence <strong>of</strong> the use <strong>of</strong> storing the air at high pressures <strong><strong>an</strong>d</strong><br />
reducing it across a valve is the associated generation <strong>of</strong> noise due<br />
to the large pressure drop across it. Two approaches were employed<br />
to reduce this noise source. The first is to use a control valve<br />
with <strong>an</strong> innovative noise-control design; the second is to introduce<br />
a silencer downstream <strong>of</strong> the control valve to attenuate the noise<br />
levels. The latter approach will be discussed in detail in the next<br />
section.<br />
The control valve chosen <strong>for</strong> this rig was the WhisperFlo Trim,<br />
m<strong>an</strong>ufactured by Fisher Ò . It is sized to withst<strong><strong>an</strong>d</strong> 2000 kPa upstream<br />
pressure <strong><strong>an</strong>d</strong> reduce to a maximum downstream pressure<br />
<strong>of</strong> 200 kPa across the valve. The main noise-m<strong>an</strong>agement techniques<br />
adopted by this control valve are as follows: First, it divides<br />
the pressure drop over two stages, where the largest pressure drop<br />
occurs at the first stage to contain the noise locally. Second, a unique<br />
passage pr<strong>of</strong>ile inside the valve is also introduced to reduce<br />
flow turbulence <strong><strong>an</strong>d</strong> dissipate the flow-induced noise. Third, each<br />
individual exit <strong>jet</strong> <strong>of</strong> the control valve is aligned such that <strong>jet</strong><br />
coalescences are delayed until each <strong>jet</strong> becomes fully-developed<br />
to shear flow. Hence, the mixing noise due to the merging <strong>of</strong><br />
high-speed potential flow is reduced.<br />
3.2. Primary silencer<br />
Noise generated by dropping the pressure across the control<br />
valve is attenuated by the use <strong>of</strong> a large silencer. The silencer is designed<br />
to have a high tr<strong>an</strong>smission loss (TL) <strong><strong>an</strong>d</strong> a low <strong>aero</strong>dynamic<br />
pressure drop. It is in the <strong>for</strong>m <strong>of</strong> a lined ‘‘3 pass” plenum chamber,<br />
which incorporates two 90° acoustically lined bends <strong><strong>an</strong>d</strong> two 180°<br />
lined bends, in addition to three straight runs <strong>of</strong> lined duct (see<br />
Fig. 1). All interior surfaces are treated with the same Basalt wool<br />
dissipative liner <strong>of</strong> 150 mm thickness with a facing cloth (woven<br />
glass fabric) to inhibit flow delamination <strong><strong>an</strong>d</strong> a (mainly structural)<br />
facing <strong>of</strong> per<strong>for</strong>ated metal. The baffle plates are <strong>of</strong> 3 mm thick mild<br />
steel in order to provide a sufficient tr<strong>an</strong>smission loss between successive<br />
‘‘passes”. The walls are made <strong>of</strong> 20 mm thick plywood in<br />
order to reduce to acceptable levels the direct structural fl<strong>an</strong>king<br />
tr<strong>an</strong>smission (as opposed to ‘‘radiation bypass” fl<strong>an</strong>king) within<br />
the silencer.<br />
Measurement <strong>of</strong> the primary silencer tr<strong>an</strong>smission loss was<br />
per<strong>for</strong>med. The ratio <strong>of</strong> sound powers at the inlet <strong><strong>an</strong>d</strong> outlet was<br />
measured using a B&K intensity probe. The measurement is compared<br />
with the theoretical predictions <strong>of</strong> Cummings [13], as shown<br />
in Fig. 2. Satisfactory agreement between the experimental result<br />
<strong><strong>an</strong>d</strong> prediction c<strong>an</strong> be seen in the figure which shows a 50–60 dB<br />
measured <strong><strong>an</strong>d</strong> predicted tr<strong>an</strong>smission loss in the frequency r<strong>an</strong>ge<br />
from 300 Hz to 4000 Hz.<br />
3.3. 90°-curved diffuser<br />
Due to space constraints, air leaving the 4 m vertical straight air<br />
duct must be rapidly turned 90° to orientate the air-flow along the<br />
<strong>wind</strong> <strong>tunnel</strong> axis (see Fig. 1). As mentioned earlier the inlet area <strong>of</strong><br />
the nozzle should be between 1.35 m 2 <strong><strong>an</strong>d</strong> 1.70 m 2 . With the exit<br />
area <strong>of</strong> the air passage fixed at 0.43 m 2 (0.33 m 1.3 m), <strong>an</strong> area<br />
exp<strong>an</strong>sion ratio <strong>of</strong> between 3 <strong><strong>an</strong>d</strong> 4 is there<strong>for</strong>e required. A diffuser<br />
is generally used to recover static pressure <strong><strong>an</strong>d</strong> to exp<strong><strong>an</strong>d</strong> flow<br />
area. The 90°-curved diffuser in the current design serves the purpose<br />
<strong>of</strong> simult<strong>an</strong>eously exp<strong><strong>an</strong>d</strong>ing the area <strong><strong>an</strong>d</strong> turning the flow. It<br />
is <strong>of</strong> secondary import<strong>an</strong>ce <strong>for</strong> pressure recovery since the pressure<br />
T.P. Chong et al. / Applied Acoustics 70 (2009) 605–614 607<br />
Fig. 2. Comparison <strong>of</strong> tr<strong>an</strong>smission loss between experimental results <strong><strong>an</strong>d</strong> theoretical<br />
estimation <strong>of</strong> the primary silencer.<br />
at the curved diffuser inlet is already excessive at about 80 kPa. Unlike<br />
a straight diffuser, <strong>an</strong> effective curved diffuser is more difficult<br />
to design due to the existence <strong>of</strong> centrifugal <strong>for</strong>ces that c<strong>an</strong><br />
produce detrimental secondary flows that tend to destabilize<br />
boundary layer growth. The combination <strong>of</strong> the pressure-driven<br />
secondary flow <strong><strong>an</strong>d</strong> the streamwise adverse pressure gradient<br />
makes the boundary layer more susceptible to flow separation,<br />
especially at the inner-wall region (convex part). Turbulence <strong><strong>an</strong>d</strong><br />
noise produced by the creation <strong>of</strong> separated flow may subst<strong>an</strong>tially<br />
degrade the effectiveness <strong>of</strong> the <strong>wind</strong> <strong>tunnel</strong> <strong><strong>an</strong>d</strong> must there<strong>for</strong>e be<br />
suppressed. Much <strong>of</strong> the ef<strong>for</strong>t in the design <strong>of</strong> this <strong>wind</strong> <strong>tunnel</strong><br />
was there<strong>for</strong>e dedicated to preventing flow separation in the 90°curved<br />
diffuser, as discussed below.<br />
For the design <strong>of</strong> a curved diffuser, three dimensionless parameters<br />
are <strong>of</strong> import<strong>an</strong>ce: the area-ratio (AR, W1/W2), scaled innerwall<br />
length (L in/W 1) <strong><strong>an</strong>d</strong> the turning <strong>an</strong>gle (D/) [14], where W 1<br />
<strong><strong>an</strong>d</strong> W2 are the widths <strong>of</strong> the curved diffuser inlet <strong><strong>an</strong>d</strong> outlet<br />
respectively <strong><strong>an</strong>d</strong> L in is the inner-wall length. It has been demonstrated<br />
that, to maintain separation-free at the inner-wall region,<br />
the allow<strong>an</strong>ce <strong>for</strong> higher AR <strong><strong>an</strong>d</strong> lower L in/W 1 decreases when D/<br />
increases [14]. In other words, to maintain a steady diffusing flow,<br />
the diffuser is required to be longer <strong><strong>an</strong>d</strong> hence more floor space is<br />
needed to accommodate it. However, <strong>for</strong> the current design, there<br />
is a severe space limitation <strong><strong>an</strong>d</strong> the curved diffuser must be necessarily<br />
short, resulting in <strong>an</strong> undesirably abrupt curvature <strong>of</strong> the inner-wall.<br />
With the available space <strong><strong>an</strong>d</strong> the required curved diffuser<br />
exp<strong>an</strong>sion ratio <strong>of</strong> 3–4 as the only two constraints, the 90°-curved<br />
diffuser was designed accordingly. The dimensions, W 1, W 2 <strong><strong>an</strong>d</strong> L in<br />
were eventually chosen to 0.33 m, 1.3 m <strong><strong>an</strong>d</strong> 0.849 m, respectively.<br />
This configuration yields Lin/W1 as 2.57 <strong><strong>an</strong>d</strong> W2/W1 (or AR) as 3.94<br />
with D/ =90°. If these values are substituted into the classical design<br />
curves <strong>for</strong> a curved diffuser with circular-arc centreline<br />
(shown in Fig. 2 <strong>of</strong> Ref. [15]), the current diffuser with short but<br />
large AR <strong><strong>an</strong>d</strong> D/ values is predicted to fall into the severe stall regime<br />
<strong>for</strong> a wide r<strong>an</strong>ge <strong>of</strong> Reynolds numbers.<br />
To achieve a non-separating boundary layer with this geometry<br />
the diffusing flow should be controlled by the introduction <strong>of</strong> flow<br />
control devices. However, this will most likely be achieved at the<br />
expense <strong>of</strong> a reduced pressure recovery. Several passive flow control<br />
methods have been proposed to suppress flow separation,<br />
which include the use <strong>of</strong> splitter v<strong>an</strong>es <strong><strong>an</strong>d</strong> honeycombs <strong><strong>an</strong>d</strong> woven<br />
wire mesh screens. A suitable design <strong>of</strong> the 90°-curved diffuser<br />
that incorporates these features was achieved by per<strong>for</strong>ming a<br />
parametric <strong>per<strong>for</strong>m<strong>an</strong>ce</strong> study on a 1/6th scale-model driven by<br />
a centrifugal blower. Various combinations <strong>of</strong> the a<strong>for</strong>ementioned<br />
flow control devices were investigated, as shown in the schematic<br />
<strong>of</strong> Fig. 3a. Also shown in the figure is the coordinate system (y o, z o)
608 T.P. Chong et al. / Applied Acoustics 70 (2009) 605–614<br />
a b<br />
incoming<br />
flow<br />
Settling<br />
chamber<br />
inner wall<br />
Woven wire<br />
mesh screens<br />
90º -curved<br />
diffuser<br />
Guide v<strong>an</strong>es<br />
+y o<br />
outer wall<br />
+z o<br />
(0,0)<br />
Honeycomb<br />
<strong>for</strong> the cross-sectional pl<strong>an</strong>e <strong>of</strong> the 90°-curved diffuser exit. A pitot<br />
tube was used to measure the cross-sectional total pressure contours<br />
at 5 cm from the diffuser model exit. The improved levels<br />
<strong>of</strong> flow uni<strong>for</strong>mity obtained following the application <strong>of</strong> the flow<br />
control devices are shown in Fig. 3b <strong><strong>an</strong>d</strong> c.<br />
Fig. 3b 1 shows the pressure contours in the absence <strong>of</strong> splitters,<br />
honeycomb <strong><strong>an</strong>d</strong> screens. It is apparent that a signific<strong>an</strong>t total pressure<br />
deficit (blue colour) encompasses more th<strong>an</strong> 50% <strong>of</strong> the flow<br />
area at the exit. This pressure deficit region is associated with the<br />
large-scale, non-recoverable flow separation that originated from<br />
the inner-wall region. A consequence <strong>of</strong> this ‘‘dead flow” region<br />
shown in Fig. 3b is that most <strong>of</strong> the mass flow is tr<strong>an</strong>sferred to a fast<br />
stream flow towards the outer-wall region (shown in red). Without<br />
flow control treatment, incorporating the current 90°-curved diffuser<br />
into a <strong>wind</strong> <strong>tunnel</strong> would require a subst<strong>an</strong>tial dist<strong>an</strong>ce be<strong>for</strong>e<br />
the separated flow from the diffuser inner-wall reattaches again. Following<br />
extensive testing, it was shown that three equally spaced<br />
splitter v<strong>an</strong>es, a honeycomb at the diffuser exit followed by three<br />
fine woven wire mesh screens, with a cumulative pressure drop <strong>of</strong><br />
5.5q (q is the dynamic pressure, see Eq. (2)) c<strong>an</strong> suppress effectively<br />
the boundary layer separation at the inner-wall. 2 This is confirmed<br />
in Fig. 3c where the exit flow was found to be reasonably uni<strong>for</strong>m<br />
over most <strong>of</strong> the exit area (note that the contour scale in Fig. 3c is<br />
reduced to improve the resolution, i.e. if the same larger contourscale<br />
as in Fig. 3b is used instead, a visually more uni<strong>for</strong>m pressure<br />
distribution will be obtained). A detailed discussion <strong>of</strong> the physical<br />
mech<strong>an</strong>ism by which the screens <strong><strong>an</strong>d</strong> guide v<strong>an</strong>es inhibit flow sep-<br />
zo (mm)<br />
c<br />
zo (mm)<br />
Outer wall y o (mm)<br />
aration is beyond the scope <strong>of</strong> the current paper <strong><strong>an</strong>d</strong> is reported elsewhere<br />
[16].<br />
This arr<strong>an</strong>gement <strong>of</strong> splitters <strong><strong>an</strong>d</strong> screens was adopted in the<br />
full-size 90°-curved diffuser, whose <strong>per<strong>for</strong>m<strong>an</strong>ce</strong> was tested using<br />
a rake <strong>of</strong> nine pitot-tubes covering the dist<strong>an</strong>ce between the outer<br />
to inner-walls <strong>of</strong> the diffuser ( 1.3 m) to simult<strong>an</strong>eously measure<br />
the exit flow total pressures. Since the full-size <strong><strong>an</strong>d</strong> scalemodel<br />
experiments were per<strong>for</strong>med at different flow speeds, direct<br />
comparison <strong>of</strong> the data between the two is not possible. A<br />
more me<strong>an</strong>ingful approach is to determine the velocity deviations,<br />
Udev, <strong>of</strong> the measured velocity compared with the flow at<br />
the outer-wall region where it takes a maximum value. This<br />
qu<strong>an</strong>tity c<strong>an</strong> be expressed as:<br />
Udev ¼ UðYo!0;Zo¼0:5Þ UðYo;Zo¼0:5Þ<br />
UðYo!0;Zo¼0:5Þ<br />
Inner wall<br />
Fig. 3. (a) Schematic <strong>of</strong> the 90°-curved diffuser model <strong>for</strong> the flow control study. Coordinate system (y o, z o) <strong>for</strong> the diffuser exit flow is also shown. Contours <strong>of</strong> exit pressure<br />
coefficient, C po <strong>for</strong> the 90°-curved diffuser (a) without flow control, (b) with three guide v<strong>an</strong>es (location indicated by the vertical dash lines, also see (a)) <strong><strong>an</strong>d</strong> 5.5q pressure<br />
drop at the exit. Negative values <strong>of</strong> C po is caused by the discontinuity <strong>of</strong> total head between the reference <strong><strong>an</strong>d</strong> the measurement points as the result <strong>of</strong> flow through screens.<br />
1<br />
For interpretation <strong>of</strong> the references in colour in this figure legend, the reader is<br />
referred to the web version <strong>of</strong> this article.<br />
2<br />
It is also observed that the exit flow uni<strong>for</strong>mity c<strong>an</strong> be further improved by<br />
adding more guide v<strong>an</strong>es <strong><strong>an</strong>d</strong> larger pressure drop at the curved diffuser exit. The<br />
suggested combination is a good bal<strong>an</strong>ce <strong>of</strong> effective flow control <strong><strong>an</strong>d</strong> minimal<br />
construction complexity.<br />
where UðYo!0;Zo¼0:5Þ is the velocity at the outer wall region <strong>of</strong> the<br />
centre-pl<strong>an</strong>e, Zo = 0.5; whereas UðYo;Zo¼0:5Þ is the velocity from the<br />
outer to inner-walls (in Yo direction), also at Zo=0.5. Here, Yo<br />
<strong><strong>an</strong>d</strong> Zo are the dist<strong>an</strong>ces yo <strong><strong>an</strong>d</strong> zo normalized on their respective<br />
diffuse exit widths. Fig. 4a compares the <strong>aero</strong>dynamically treated<br />
full-size (h) <strong><strong>an</strong>d</strong> scale-model (o) velocity deviations at Zo = 0.5 <strong>of</strong><br />
the 90°-curved diffuser exits. Also shown in the figure is the corresponding<br />
velocity deviation <strong>for</strong> a bare, untreated scale-model<br />
90°-curved diffuser (D). Good agreement is observed between<br />
the flow uni<strong>for</strong>mities <strong>of</strong> the full-size <strong><strong>an</strong>d</strong> scale-model treated diffusers.<br />
For the treated case, the velocity deviations <strong>of</strong> exit flow<br />
from the outer to the inner-walls <strong>for</strong> both <strong>of</strong> the full-size <strong><strong>an</strong>d</strong><br />
scale-model diffusers are signific<strong>an</strong>tly lower th<strong>an</strong> the untreated<br />
case. This implies that the addition <strong>of</strong> splitter v<strong>an</strong>es, honeycomb<br />
<strong><strong>an</strong>d</strong> pressure-reducing screens has successfully maintained uni<strong>for</strong>m<br />
flow over a relatively wide r<strong>an</strong>ge <strong>of</strong> Reynolds numbers by<br />
inhibiting large-scale flow separation at the inner-wall. Finally,<br />
C po<br />
ð1Þ
error bars corresponding to the variations in exit velocity at different<br />
sp<strong>an</strong>wise locations (Zo) from the outer to inner-walls are<br />
shown in Fig. 4b. The deviations are generally small which implies<br />
that a satisfactory two-dimensional exit flow has been<br />
achieved by the uses <strong>of</strong> both guide v<strong>an</strong>es <strong><strong>an</strong>d</strong> mesh screens.<br />
3.4. Settling chamber/secondary silencer<br />
As shown in Fig. 1, a straight silencer duct section was installed<br />
following the 90°-curved diffuser to further smoothen<br />
<strong><strong>an</strong>d</strong> quieten the flow be<strong>for</strong>e it enters the nozzle. This settling<br />
chamber has dimensions <strong>of</strong> 1.3 m 1.3 m 2 m. Honeycomb<br />
<strong><strong>an</strong>d</strong> screens were also introduced at the settling chamber inlet<br />
<strong><strong>an</strong>d</strong> outlet to further smooth the flow. 3 Honeycomb is primarily<br />
used to straighten the flow <strong><strong>an</strong>d</strong> to reduce lateral velocity fluctuations.<br />
Since the honeycomb is less capable <strong>of</strong> reducing the streamwise<br />
component <strong>of</strong> the flow fluctuation <strong><strong>an</strong>d</strong> non-uni<strong>for</strong>mity<br />
(eddies smaller th<strong>an</strong> the cell size), screens were also inserted behind<br />
the honeycomb to further improve the flow quality. The most<br />
import<strong>an</strong>t criterion <strong>for</strong> choosing <strong>an</strong> effective screen lies in its pressure<br />
drop value. The pressure drop coefficient <strong>of</strong> a screen, K c<strong>an</strong> be<br />
expressed as [17]:<br />
K ¼ Dp 1<br />
¼ A<br />
q b 2<br />
1<br />
B<br />
Velocity Deviations<br />
1<br />
0.8<br />
0.6<br />
0.4<br />
0.2<br />
0<br />
Untreated<br />
scale model<br />
outer wall<br />
(reference)<br />
Treated<br />
scale model<br />
Treated<br />
full scale<br />
0 0.25 0.5 0.75 1<br />
inner wall<br />
where Dp is the static pressure drop across the screens, q is the<br />
upstream dynamic pressure <strong><strong>an</strong>d</strong> b is the porosity, where A <strong><strong>an</strong>d</strong><br />
B are const<strong>an</strong>ts usually taken to be 0.52 <strong><strong>an</strong>d</strong> 1, respectively <strong>for</strong><br />
a square woven type <strong>of</strong> mesh. Eq. (2) suggests that the pressure<br />
drop across the screen c<strong>an</strong> be solely determined by its porosity.<br />
It has been suggested that K should be at least 2.56 to achieve<br />
uni<strong>for</strong>m flow across the screens in a <strong>wind</strong> <strong>tunnel</strong> [18]. Based on<br />
the above criterion the final values <strong>of</strong> d (wire diameter), P (pitch),<br />
K <strong><strong>an</strong>d</strong> b <strong>for</strong> all the screens used in the <strong>open</strong> <strong>jet</strong> <strong>wind</strong> <strong>tunnel</strong> are<br />
summarized in Table 2. Also included in the table is the summary<br />
<strong>of</strong> cell diameters <strong><strong>an</strong>d</strong> lengths <strong>for</strong> the honeycombs used in this<br />
<strong>wind</strong> <strong>tunnel</strong>.<br />
A further undesirable consequence <strong>of</strong> introducing the 90°curved<br />
diffuser is that its critically unfavourable geometry is<br />
prone to generating pressure fluctuations in the flow, which<br />
c<strong>an</strong> then be tr<strong>an</strong>smitted to dist<strong>an</strong>ce along the <strong>wind</strong> <strong>tunnel</strong>. Furthermore,<br />
the addition <strong>of</strong> flow splitters inside the 90°-curved diffuser<br />
may also generate extr<strong>an</strong>eous noise as a result <strong>of</strong> flow<br />
impingement <strong><strong>an</strong>d</strong> boundary layer growth. The settling chamber<br />
was there<strong>for</strong>e acoustically lined to attenuate the noise sources<br />
located downstream <strong>of</strong> the valve. The theory <strong>of</strong> Kurze [19] was<br />
used to predict the tr<strong>an</strong>smission loss <strong>for</strong> different combinations<br />
ð2Þ<br />
U (m/s)<br />
5.5<br />
4.5<br />
3.5<br />
2.5<br />
Yo Yo<br />
Table 2<br />
Data <strong>for</strong> the honeycombs <strong><strong>an</strong>d</strong> screens used in the <strong>open</strong> <strong>jet</strong> <strong>wind</strong> <strong>tunnel</strong><br />
Honeycomb Cell diameter (mm) Cell length (mm)<br />
H1 6.35 63.5<br />
H2 6.35 63.5<br />
Screen D(mm) P(mm) b K<br />
S 1 0.33 1.01 0.45 2.0<br />
S2 0.33 1.01 0.45 2.0<br />
S3 0.36 1.36 0.54 1.5<br />
S 4 0.4 1.7 0.58 1.0<br />
S 5 0.3 1.28 0.58 1.0<br />
Refer to Fig. 1 <strong>for</strong> locations <strong>of</strong> the various honeycombs <strong><strong>an</strong>d</strong> screens.<br />
<strong>of</strong> lined-splitter numbers <strong><strong>an</strong>d</strong> thicknesses. In the final design,<br />
the acoustical liners consist <strong>of</strong> five parallel absorptive-line splitter<br />
plates <strong><strong>an</strong>d</strong> two lined-sideliners. The splitter plates are<br />
1800 mm in length <strong><strong>an</strong>d</strong> 110 mm in thickness; whereas the sideliners<br />
are 40 mm in thickness. Super-elliptical leading edge <strong><strong>an</strong>d</strong><br />
tapered trailing edge shapes were included to ensure that<br />
smooth <strong><strong>an</strong>d</strong> attached flows exist on the splitter walls. The overall<br />
pressure drop caused by the growth <strong>of</strong> the boundary layer displacement<br />
thickness on the splitter walls was estimated to be<br />
<strong>of</strong> negligibly small at 90 Pa. The tr<strong>an</strong>smission loss <strong>of</strong> this silencer<br />
was predicted to be about 35 dB at 2 kHz, falling to about 15 dB<br />
at higher frequencies.<br />
3.5. Nozzle<br />
0 0.25 0.5 0.75 1<br />
outer wall<br />
inner wall<br />
Fig. 4. (a) Comparison <strong>of</strong> velocity deviations from outer to inner-walls at Z o = 0.5 <strong>of</strong> the 90°-curved diffuser exit <strong>for</strong>: o – treated scale-model, D – bare, untreated scale-model<br />
<strong><strong>an</strong>d</strong> h – treated full-size 90°-curved diffusers. (b) Sp<strong>an</strong>wise distributions (Z o) <strong>of</strong> exit velocity from the outer to inner-walls <strong>of</strong> the full-size 90°-curved diffuser.<br />
3<br />
Note that honeycomb <strong><strong>an</strong>d</strong> screens at the settling chamber inlet are essentially the<br />
very same flow control devices <strong>for</strong> the 90°-curved diffuser.<br />
T.P. Chong et al. / Applied Acoustics 70 (2009) 605–614 609<br />
The flow is accelerated rapidly in the nozzle resulting in large<br />
streamwise strain. The choice <strong>of</strong> large contraction ratio, such as<br />
in the present design (25:1CR), which is directly proportional to<br />
the strain in the streamwise direction, is useful <strong>for</strong> minimizing<br />
flow non-uni<strong>for</strong>mity <strong><strong>an</strong>d</strong> streamwise velocity fluctuations. However,<br />
the use <strong>of</strong> a large CR nozzle carries the risk <strong>of</strong> causing flow<br />
separation near the nozzle exit. In general, the radius <strong>of</strong> curvature<br />
at the ends c<strong>an</strong> be kept small to avoid separation but this will result<br />
in a longer contraction length <strong><strong>an</strong>d</strong> <strong>an</strong> increase in exit boundary<br />
layer thickness. In addition, the nozzle consists <strong>of</strong> concave (at upstream)<br />
<strong><strong>an</strong>d</strong> convex (at downstream) parts so the inflection point<br />
should be designed such that the first <strong><strong>an</strong>d</strong> second derivatives <strong>of</strong><br />
the nozzle pr<strong>of</strong>iles are as small as possible.<br />
The present nozzle is designed as a three-dimensional, 25:1 CR<br />
nozzle. The inlet <strong>of</strong> the nozzle is a square section measuring<br />
1.3 m 1.3 m <strong><strong>an</strong>d</strong> the outlet is rect<strong>an</strong>gular shape measuring<br />
0.15 m 0.45 m. The axial length <strong>of</strong> the nozzle is 1.35 m. An isometric<br />
view <strong>of</strong> the nozzle is presented in Fig. 5a. The nozzle <strong>per<strong>for</strong>m<strong>an</strong>ce</strong><br />
has been investigated numerically from a steady RANS<br />
calculation incorporating a k–e turbulence model. As shown in<br />
the velocity contours <strong>of</strong> Fig. 5b, no flow separation is predicted inside<br />
the nozzle.
610 T.P. Chong et al. / Applied Acoustics 70 (2009) 605–614<br />
Fig. 5. (a) Isometric view <strong>of</strong> the 3D nozzle. (b) Numerical results <strong>of</strong> the flow field inside the nozzle, presenting velocity contours at A–A <strong><strong>an</strong>d</strong> B–B pl<strong>an</strong>es.<br />
4. Calibration <strong>of</strong> the Open Jet Wind Tunnel<br />
Fig. 6 shows the completed <strong>open</strong> <strong>jet</strong> <strong>wind</strong> <strong>tunnel</strong> inside the<br />
ISVR’s <strong>an</strong>echoic chamber (control valve <strong><strong>an</strong>d</strong> primary silencer are<br />
in the ro<strong>of</strong> space <strong>of</strong> the chamber <strong><strong>an</strong>d</strong> are not shown in the figure).<br />
Also shown is the new coordinate system (x, y, z) employed <strong>for</strong> the<br />
cross section <strong>of</strong> the nozzle exit pl<strong>an</strong>e. We now present the overall<br />
facility background noise characteristics <strong>for</strong> the entire rig as a function<br />
<strong>of</strong> exit <strong>jet</strong> velocity. The flow uni<strong>for</strong>mity <strong><strong>an</strong>d</strong> turbulence intensity<br />
variation over the <strong>jet</strong> nozzle <strong>of</strong> the <strong>jet</strong> were also measured <strong><strong>an</strong>d</strong><br />
are also presented below. Note that both the acoustic <strong><strong>an</strong>d</strong> <strong>aero</strong>dynamic<br />
measurement results are plotted using the new coordinate<br />
system (x, y, z) as defined in Fig. 6.<br />
4.1. Analysis <strong>of</strong> background noise levels<br />
A microphone was placed at (x, y, z) = (0, 0.5, 0), i.e. 0.5 m vertically<br />
above the centre <strong>of</strong> the cross-sectional nozzle exit pl<strong>an</strong>e to<br />
measure the background noise level inside the <strong>an</strong>echoic chamber<br />
at different exit <strong>jet</strong> velocities. This corresponds to a polar <strong>an</strong>gle,<br />
h =90°, where h is the <strong>an</strong>gle from the <strong>jet</strong> axis, as shown in Fig. 1.<br />
In addition, <strong>an</strong>other microphone was placed at h =45° (0.35, 0.35,<br />
0) to assess the noise directivity <strong>of</strong> the exit <strong>jet</strong>. Fig. 7a <strong><strong>an</strong>d</strong> b show<br />
the narrowb<strong><strong>an</strong>d</strong> (spectral density) sound pressure level at h =45°<br />
<strong><strong>an</strong>d</strong> 90°, respectively pertaining to the <strong>open</strong> <strong>jet</strong> <strong>wind</strong> <strong>tunnel</strong> over<br />
a r<strong>an</strong>ge <strong>of</strong> <strong>jet</strong> velocities between 33.1 <strong><strong>an</strong>d</strong> 99.6 ms 1 . These figures<br />
are plotted in the <strong>for</strong>m <strong>of</strong> power spectral density with a 1 Hz b<strong><strong>an</strong>d</strong>width<br />
<strong><strong>an</strong>d</strong> a frequency resolution, Df <strong>of</strong> 6.25 Hz. The spectra are<br />
smoothly varying <strong><strong>an</strong>d</strong> decay slowly with frequency.<br />
It is also insightful to examine how the sound pressure level<br />
varies with <strong>jet</strong> velocity as the function <strong>of</strong> frequency. Fig. 8 shows<br />
the dependence <strong>of</strong> sound pressure level on <strong>jet</strong> velocity, p 2 / V N<br />
<strong>for</strong> h =45° <strong><strong>an</strong>d</strong> 90°. For h =45°, the sound pressure level is observed<br />
to scale as V 7.5 –V 8 in the frequency r<strong>an</strong>ge between 400 Hz <strong><strong>an</strong>d</strong><br />
10 kHz. This power law is classically associated with quadrupole<br />
<strong>jet</strong> mixing noise. For h =90°, a power law <strong>of</strong> V 6.5 in the frequency<br />
r<strong>an</strong>ge 100 Hz–2 kHz is observed. This velocity dependence implies<br />
that dipole <strong>aero</strong>dynamic noise sources are domin<strong>an</strong>t at this measurement<br />
<strong>an</strong>gle. One possible dipole noise source is due to the<br />
boundary layer being scattered at the nozzle lip. Another possible<br />
dipole noise contributor at this frequency r<strong>an</strong>ge could be due to the<br />
noise breakout from inside <strong>of</strong> the rig. From 2 kHz <strong><strong>an</strong>d</strong> above, the<br />
noise scales as V 7 indicating the influence <strong>of</strong> <strong>jet</strong> noise. This <strong>an</strong>alysis<br />
suggests that the <strong>wind</strong> <strong>tunnel</strong> noise (from the valve <strong><strong>an</strong>d</strong> secondary<br />
flows) has been reduced to nearly below that from the <strong>jet</strong>, which is<br />
<strong>an</strong> unavoidable but weak source at low Mach numbers.<br />
Fig. 9 shows the variation <strong>of</strong> overall sound pressure level<br />
(OASPL) with <strong>jet</strong> velocity <strong>for</strong> h =45° <strong><strong>an</strong>d</strong> 90°, respectively. Note that<br />
the A-weighted OASPL are also included <strong>for</strong> comparison with the<br />
data from other automobile <strong><strong>an</strong>d</strong> <strong>aero</strong>acoustic <strong>wind</strong> <strong>tunnel</strong>s worldwide.<br />
The figure indicates that the OASPL scales as V 4.6 <strong><strong>an</strong>d</strong> V 5.3 ,<br />
whereas the A-weighted OASPL scales as V 7.6 <strong><strong>an</strong>d</strong> V 6.8 at h =45°<br />
Fig. 6. Completed <strong>open</strong> <strong>jet</strong> <strong>wind</strong> <strong>tunnel</strong> in the ISVR’s <strong>an</strong>echoic chamber. The new coordinate system (x, y, z – different from the diffuser case) in reference to the nozzle is<br />
shown in the smaller picture.
Fig. 7. Sound pressure level, dB (ref 2 10 5 pa) at 1 Hz b<strong><strong>an</strong>d</strong>width, Df = 6.25 Hz <strong>of</strong><br />
the <strong>open</strong> <strong>jet</strong> <strong>wind</strong> <strong>tunnel</strong> operated from <strong>jet</strong> velocities 33.1–99.6 m/s. Spectra<br />
measured at (a) h =45°, (b) h =90°.<br />
Fig. 8. Dependency <strong>of</strong> sound pressure level on <strong>jet</strong> velocity <strong>for</strong> --- h =45° <strong><strong>an</strong>d</strong> —<br />
h =90°. Note that N is the power factor <strong>of</strong> the velocity.<br />
Fig. 9. Distributions <strong>of</strong> OASPL with <strong>jet</strong> velocity <strong>for</strong> h =45° <strong><strong>an</strong>d</strong> 90°. Power factors <strong>of</strong><br />
the velocity N are indicated <strong>for</strong> both <strong>of</strong> the dB <strong><strong>an</strong>d</strong> dBA cases.<br />
T.P. Chong et al. / Applied Acoustics 70 (2009) 605–614 611<br />
Fig. 10. Comparison <strong>of</strong> A-weighted OASPL (corrected by Eq. (3)) background noise<br />
<strong>of</strong> the current <strong>open</strong> <strong>jet</strong> <strong>wind</strong> <strong>tunnel</strong> to other worldwide facilities.<br />
<strong><strong>an</strong>d</strong> 90°, respectively. The <strong>wind</strong> <strong>tunnel</strong> rig noise data in Fig. 9 compare<br />
favourably with the data from other automobile <strong><strong>an</strong>d</strong> <strong>aero</strong>acoustic<br />
<strong>wind</strong> <strong>tunnel</strong>s published previously [9–11]. With the<br />
assumption that the variation <strong>of</strong> sound pressure level in the azimuthal<br />
pl<strong>an</strong>e is small, 4 the OASPL data presented in Ref. [9–11]<br />
<strong>for</strong> the various <strong>wind</strong> <strong>tunnel</strong>s OASPLiFacility, were corrected <strong>for</strong> measurement<br />
dist<strong>an</strong>ce r iFacility <strong><strong>an</strong>d</strong> nozzle area A iFacility to allow comparison<br />
with the present <strong>open</strong> <strong>jet</strong> <strong>wind</strong> <strong>tunnel</strong> by the use <strong>of</strong> the<br />
following:<br />
OASPLcorrected / OASPLiFacility þ 10log 10<br />
10log 10<br />
AiFacility<br />
AISVR<br />
riFacility<br />
rISVR<br />
where riFacility is the dist<strong>an</strong>ce from the microphone to the centre <strong>of</strong><br />
the nozzle exit pl<strong>an</strong>e <strong>of</strong> other <strong>wind</strong> <strong>tunnel</strong>s; <strong><strong>an</strong>d</strong> A iFacility is the nozzle<br />
cross-sectional areas. AISVR <strong><strong>an</strong>d</strong> rISVR are 0.0675 m 2 <strong><strong>an</strong>d</strong> 0.5 m,<br />
respectively <strong>for</strong> the ISVR <strong>open</strong> <strong>jet</strong> <strong>wind</strong> <strong>tunnel</strong>. Fig. 10 presents<br />
the distributions <strong>of</strong> A-weighted OASPL with test section velocity<br />
<strong>for</strong> a number <strong>of</strong> well-known automobile <strong><strong>an</strong>d</strong> <strong>aero</strong>acoustic research<br />
<strong>wind</strong> <strong>tunnel</strong>s around the world [9–11].<br />
The differences in these measurements c<strong>an</strong> partly be attributed<br />
to the fact that the measurement <strong>an</strong>gle h is different <strong>for</strong> different<br />
<strong>wind</strong> <strong>tunnel</strong>s presented in Fig. 10. Fig. 10 demonstrates that the<br />
A-weighted OASPL at both h =45° <strong><strong>an</strong>d</strong> 90° <strong>for</strong> the present <strong>open</strong><br />
<strong>jet</strong> <strong>wind</strong> <strong>tunnel</strong> is comparable with the quietest <strong>wind</strong> <strong>tunnel</strong>s.<br />
The figure also shows that the A-weighted OASPL scales with<br />
log(V) [7,8] <strong>for</strong> all the <strong>wind</strong> <strong>tunnel</strong>s presented.<br />
4.2. Analysis <strong>of</strong> exit flow uni<strong>for</strong>mity <strong><strong>an</strong>d</strong> turbulence characteristics<br />
To investigate the uni<strong>for</strong>mity <strong>of</strong> the <strong>jet</strong> flow, the total pressure<br />
pr<strong>of</strong>iles were measured using a custom-made pitot-tube rake. The<br />
rake consists <strong>of</strong> eleven 1.2 mm-internal diameter steel tubes located<br />
at 15 mm intervals, which sp<strong>an</strong>s the height <strong>of</strong> the nozzle exit.<br />
By assuming the streamwise pressure gradient caused by the <strong>jet</strong><br />
contraction to be negligible, the static pressure is approximately<br />
equal to the atmospheric pressure <strong>for</strong> the <strong>open</strong> <strong>jet</strong>. The <strong>jet</strong> velocity<br />
c<strong>an</strong> thus be deduced from the measured total pressure. The pitottube<br />
rake was attached to a computer-controlled two-dimensional<br />
traverse mech<strong>an</strong>ism. The accuracy <strong>of</strong> the traverse in both directions<br />
is within ±0.01 mm.<br />
4<br />
For example, the OASPL at (x, y, z) <strong>of</strong> (0, 0.5, 0), (0, 0, 0.5), (0, 0.5, 0) <strong><strong>an</strong>d</strong> (0, 0,<br />
0.5) are the same.<br />
2<br />
ð3Þ
612 T.P. Chong et al. / Applied Acoustics 70 (2009) 605–614<br />
Fig. 11. (a) Velocity pr<strong>of</strong>iles in the x–y pl<strong>an</strong>e at z = 0. The velocity pr<strong>of</strong>iles starts at<br />
the left h<strong><strong>an</strong>d</strong> side <strong>of</strong> the figure from x = 0.1 m <strong><strong>an</strong>d</strong> to the right h<strong><strong>an</strong>d</strong> side <strong>of</strong> the figure<br />
at x = 1.3 m with 0.1 m increment. (b) Distribution <strong>of</strong> velocity pr<strong>of</strong>iles averaging<br />
across the y-axis at different sp<strong>an</strong>wise location <strong>of</strong> the nozzle exit pl<strong>an</strong>e at<br />
x = 0.05 m. Error bars corresponding to the maximum <strong><strong>an</strong>d</strong> minimum velocity<br />
deviations at each sp<strong>an</strong>wise location are also shown.<br />
Fig. 11a shows the velocity pr<strong>of</strong>iles <strong>of</strong> the pl<strong>an</strong>e parallel to the<br />
<strong>jet</strong> axis (x–y pl<strong>an</strong>e) at z = 0 between streamwise dist<strong>an</strong>ce, x <strong>of</strong> 0.1<br />
<strong><strong>an</strong>d</strong> 1.3 m with <strong>an</strong> increment <strong>of</strong> every 0.1 m. Fig. 11a shows the<br />
evolution <strong>of</strong> the <strong>jet</strong> velocity pr<strong>of</strong>ile <strong><strong>an</strong>d</strong> its development downstream.<br />
It begins as a ‘top-hat’ pr<strong>of</strong>ile close to the <strong>jet</strong> nozzle, eventually<br />
<strong>for</strong>ming a fully-developed pr<strong>of</strong>ile further downstream. This<br />
variation characterizes the spreading <strong>of</strong> the momentum-deficit<br />
shear layers that were shed from the top <strong><strong>an</strong>d</strong> bottom nozzle edges<br />
by entrainment as the flow progresses downstream. The end <strong>of</strong> the<br />
<strong>jet</strong>’s potential core is clearly seen to be situated between x = 0.8<br />
<strong><strong>an</strong>d</strong> 0.9 m, or 3.6–4D h, where D h, is the hydraulic diameter <strong>of</strong> the<br />
nozzle. It is expected that this length is relatively const<strong>an</strong>t over<br />
the r<strong>an</strong>ge <strong>of</strong> Reynolds numbers proposed here. The distribution<br />
<strong>of</strong> the velocity pr<strong>of</strong>iles averaged across the y-axis at different sp<strong>an</strong>wise<br />
location <strong>of</strong> the nozzle exit pl<strong>an</strong>e at x = 0.05 m is shown in<br />
Fig. 11b. From the figure, apart from the left <strong><strong>an</strong>d</strong> right edges where<br />
mixing layers exist, the velocity pr<strong>of</strong>ile across the nozzle exit pl<strong>an</strong>e<br />
is found to be uni<strong>for</strong>m with <strong>an</strong> average <strong>jet</strong> velocity <strong>of</strong> 21.6 m/s in<br />
this example. Flow uni<strong>for</strong>mity was demonstrated by the small error<br />
bars corresponding to the maximum <strong><strong>an</strong>d</strong> minimum velocity<br />
deviations inside the potential core. The results in Fig. 11a <strong><strong>an</strong>d</strong> b<br />
provide a clear indication <strong>of</strong> the extent <strong><strong>an</strong>d</strong> pr<strong>of</strong>ile <strong>of</strong> the potential<br />
core in which the airfoil must be completely located to per<strong>for</strong>m the<br />
trailing edge self-noise study to avoid the noise contribution from<br />
interaction with extr<strong>an</strong>eous turbulence.<br />
The turbulence intensity in the exit <strong>jet</strong> was measured using a<br />
TSI 1210-T1.5 miniature hot wire probe with 3.8 lm diameter.<br />
The same computer-controlled traverse system was used to measure<br />
at several points from the nozzle edge to the centre in a single<br />
run. Fig. 12 shows the distribution <strong>of</strong> the turbulence intensity<br />
Fig. 12. Sp<strong>an</strong>wise (z) distribution <strong>of</strong> turbulence intensity <strong>of</strong> the exit <strong>jet</strong> at 60 ms 1<br />
at (x, y) = (0.1,0).<br />
along the z-axis <strong>of</strong> the free <strong>jet</strong> at 60 m/s from the nozzle edge<br />
(z = 0.225 m) to the centre (z = 0). This measurement was per<strong>for</strong>med<br />
at a streamwise dist<strong>an</strong>ce, x = 0.1 m away from the nozzle<br />
exit. Apart from the first point near the edge that is located within<br />
the shear layer, the potential core <strong>of</strong> the free <strong>jet</strong> has a typical turbulence<br />
intensity <strong>of</strong> about 0.1%. This value is well below the initial<br />
target <strong>of</strong> 0.5%. With such low disturb<strong>an</strong>ce level in the free flow,<br />
extr<strong>an</strong>eous noise caused by the interaction <strong>of</strong> the <strong>jet</strong> turbulence<br />
with the airfoil leading edge is likely to be insignific<strong>an</strong>t.<br />
5. Measurement <strong>of</strong> airfoil trailing edge noise<br />
A NACA0012 airfoil was situated within the potential core <strong>of</strong> the<br />
exit <strong>jet</strong> to measure its trailing edge self-noise in relation to the<br />
<strong>wind</strong> <strong>tunnel</strong> background noise. As shown in Fig. 13a, the airfoil is<br />
0.15 m in chord <strong><strong>an</strong>d</strong> 0.45 m in sp<strong>an</strong>, <strong><strong>an</strong>d</strong> was held by side plates extended<br />
from the nozzle sidewalls. The radiated noise was measured<br />
at 0.50 m above the trailing edge, which corresponds to a<br />
polar <strong>an</strong>gle h equal to 90°.<br />
The background noises <strong>of</strong> the <strong>open</strong> <strong>jet</strong> <strong>wind</strong> <strong>tunnel</strong> were first<br />
measured in the absence <strong>of</strong> the airfoil at the <strong>jet</strong> speeds, vj <strong>of</strong><br />
33.3 m/s <strong><strong>an</strong>d</strong> 80 m/s. The airfoil, with rough s<strong><strong>an</strong>d</strong>paper placed near<br />
the leading edge on both the pressure <strong><strong>an</strong>d</strong> suction sides to trip the<br />
boundary layer into becoming turbulent, was then attached to the<br />
sidewalls <strong><strong>an</strong>d</strong> the measurement repeated at vj = 33.3 m/s. The<br />
resulting narrowb<strong><strong>an</strong>d</strong> noise spectra are plotted in Fig. 13b. Also<br />
shown in the figure are the predictions <strong>of</strong> trailing edge self-noise<br />
spectra obtained from the empirical prediction scheme developed<br />
by Brooks et al. [6] as well as the background noise. The result suggests<br />
that, in the low frequency r<strong>an</strong>ge between 100 Hz <strong><strong>an</strong>d</strong> 400 Hz,<br />
airfoil leading edge noise (triggered by the impingements <strong>of</strong> exit <strong>jet</strong><br />
<strong><strong>an</strong>d</strong> the side plate turbulent boundary layers on the leading edge)<br />
<strong><strong>an</strong>d</strong> the side plate edge noise are the domin<strong>an</strong>t noise sources. At<br />
higher frequencies, good agreement between the experiment result<br />
<strong><strong>an</strong>d</strong> Brooks et al.’s prediction is observed over the frequency<br />
r<strong>an</strong>ge <strong>of</strong> 0.5–6 kHz, thereby confirming that the measured noise<br />
is predomin<strong>an</strong>tly trailing edge self-noise in origin. In this measurement<br />
the broadb<strong><strong>an</strong>d</strong> trailing edge noise is seen to be more th<strong>an</strong><br />
15 dB above the background noise level at the peak frequency <strong>of</strong><br />
1 kHz <strong><strong>an</strong>d</strong> more th<strong>an</strong> 10 dB at other frequencies.<br />
The airfoil was then rotated to 10° <strong>an</strong>gle <strong>of</strong> attack 5 with the<br />
s<strong><strong>an</strong>d</strong>papers near the leading edge <strong>of</strong> the pressure <strong><strong>an</strong>d</strong> suction sides<br />
removed. In this configuration noise tone produced by vortex shedding<br />
past the airfoil trailing edge is expected. The experiment was<br />
carried out at <strong>jet</strong> speed v j <strong>of</strong> 80 m/s <strong><strong>an</strong>d</strong> the measured noise<br />
5 Due to the finite size <strong>of</strong> the <strong>open</strong> <strong>jet</strong> <strong>wind</strong> <strong>tunnel</strong>, the effective <strong>an</strong>gle should be<br />
2.8° based on the <strong>wind</strong> <strong>tunnel</strong> correction scheme proposed by Brooks et al. [6].
spectrum is also shown in Fig. 13b alongside the background <strong><strong>an</strong>d</strong><br />
predicted airfoil noises. At this speed, the measured airfoil noise is<br />
still at least 10 dB above the background noise <strong>for</strong> all the frequencies.<br />
The deviation between the Brooks et al.’s trailing edge noise prediction<br />
to the measured airfoil noise below 2 kHz is caused by the airfoil<br />
leading edge <strong><strong>an</strong>d</strong> the facility noises being more signific<strong>an</strong>t. The measurement<br />
however agrees well with the prediction at frequencies<br />
above 2 kHz. The trailing edge noise exhibits a broadb<strong><strong>an</strong>d</strong>-‘‘hump”<br />
between 3 kHz <strong><strong>an</strong>d</strong> 7 kHz with some discrete tones embedded. This<br />
type <strong>of</strong> spectrum in relation to a laminar airfoil is also observed by<br />
other researchers [20,21]. Peak frequency <strong>of</strong> the tone is visible at<br />
about 5 kHz with 30 dB above the background noise level.<br />
To provide a contour that vividly shows the footprint <strong>of</strong> the airfoil<br />
noise, the background noise <strong><strong>an</strong>d</strong> <strong>jet</strong> speed were first measured<br />
simult<strong>an</strong>eously as the flow speed was gradually reduced from its<br />
maximum value. This procedure was repeated with the airfoil installed<br />
at zero <strong>an</strong>gle <strong>of</strong> attack (with s<strong><strong>an</strong>d</strong>paper removed). Fig. 14a<br />
<strong><strong>an</strong>d</strong> b show, respectively, the contours <strong>of</strong> the sound pressure levels<br />
plotted as a colour map against frequency <strong><strong>an</strong>d</strong> flow speed without<br />
<strong><strong>an</strong>d</strong> with the airfoil. The resolution <strong>of</strong> the <strong>jet</strong> speeds presented in<br />
the figure is within 0.3–0.5 m/s. While a low overall background<br />
noise level is observed (Fig. 14a), a distinct broadb<strong><strong>an</strong>d</strong>-‘‘hump”<br />
c<strong>an</strong> be found <strong>for</strong> the case <strong>of</strong> trailing edge self-noise as well as the<br />
low frequency noise caused by the flow impingement to the airfoil<br />
leading edge at higher <strong>jet</strong> speeds (both indicated in Fig. 14b). When<br />
the results were compared with the Brooks et al.’s prediction<br />
scheme, although not shown here, both agree extremely well.<br />
6. Conclusions<br />
a b<br />
Nozzle exit<br />
pl<strong>an</strong>e<br />
0.15m<br />
Side plate<br />
0.075m<br />
0.15m<br />
Side plate<br />
Microphone<br />
0.50m<br />
0.45m<br />
The design, construction <strong><strong>an</strong>d</strong> <strong>per<strong>for</strong>m<strong>an</strong>ce</strong> <strong>of</strong> a new quiet, low<br />
turbulence <strong>open</strong> <strong>jet</strong> blow down <strong>wind</strong> <strong>tunnel</strong> have been described.<br />
T.P. Chong et al. / Applied Acoustics 70 (2009) 605–614 613<br />
Background at<br />
vj = 33.3m/s<br />
Background at vj = 80m/s<br />
Measured airfoil<br />
noise at vj = 80m/s<br />
Predicted airfoil<br />
noise at vj = 80m/s<br />
Measured airfoil<br />
noise at vj = 33.3m/s<br />
Predicted airfoil<br />
noise at vj = 33.3m/s<br />
Fig. 13. (a) Schematic <strong>of</strong> the experimental layout <strong>of</strong> the airfoil trailing edge self-noise experiment using the ISVR <strong>aero</strong>acoustic <strong>wind</strong> <strong>tunnel</strong>. (b) Comparison <strong>of</strong> PSD <strong>of</strong> the<br />
measured trailing edge noises at polar <strong>an</strong>gle, h <strong>of</strong> 90 degree <strong>for</strong> v j = 33.3 m/s (tripped boundary layer at zero <strong>an</strong>gle <strong>of</strong> attack) <strong><strong>an</strong>d</strong> 80 m/s (untripped boundary layer at 10° <strong>an</strong>gle<br />
<strong>of</strong> attack). The relev<strong>an</strong>t spectra <strong>for</strong> the airfoil noise predictions by Brooks et al. <strong><strong>an</strong>d</strong> the facility background noises are also included <strong>for</strong> comparisons.<br />
Fig. 14. Contours <strong>of</strong> the narrowb<strong><strong>an</strong>d</strong> (spectra density) sound pressure levels in a frequency-<strong>jet</strong> speed domain (a) without <strong><strong>an</strong>d</strong> (b) with airfoil at zero <strong>an</strong>gle <strong>of</strong> attack.<br />
This facility is designed to achieve a maximum Reynolds number <strong>of</strong><br />
1.5 10 6 based on the hydraulic diameter <strong>of</strong> the nozzle. This paper<br />
presents the design principles underlying each component <strong>of</strong> the<br />
<strong>open</strong> <strong>jet</strong> <strong>wind</strong> <strong>tunnel</strong>. At the heart <strong>of</strong> the <strong>wind</strong> <strong>tunnel</strong> is a unique<br />
quiet control valve designed to reduce the valve noise caused by<br />
the large pressure drop across it. A large silencer with absorptive<br />
baffle plates is introduced downstream <strong>of</strong> the valve to further<br />
attenuate the valve noise present in the flow. A novel design feature<br />
<strong>of</strong> the <strong>wind</strong> <strong>tunnel</strong> is the use <strong>of</strong> a short 90°-curved diffuser<br />
in which a number <strong>of</strong> passive flow control devices were introduced<br />
in <strong>an</strong> attempt to inhibit boundary layer separation on the innerwall.<br />
The optimum combination <strong>of</strong> splitter v<strong>an</strong>es, honeycomb<br />
<strong><strong>an</strong>d</strong> woven wire mesh screens were determined after extensive<br />
experimentation on a scaled-down model <strong>of</strong> the 90°-curved diffuser.<br />
Further downstream <strong>of</strong> this was located a splitter silencer<br />
whose purpose is to settle down the flow <strong><strong>an</strong>d</strong> further attenuate<br />
the residual valve noise <strong><strong>an</strong>d</strong> <strong>an</strong>y upstream boundary layer noise.<br />
The <strong>jet</strong> is finally accelerated through a 25:1 CR 3D nozzle in which<br />
air is discharged from the nozzle <strong><strong>an</strong>d</strong> into the <strong>an</strong>echoic chamber.<br />
Detailed acoustic <strong><strong>an</strong>d</strong> <strong>aero</strong>dynamic measurements <strong>of</strong> the <strong>open</strong><br />
<strong>jet</strong> <strong>wind</strong> <strong>tunnel</strong> are presented to assess the quality <strong><strong>an</strong>d</strong> <strong>per<strong>for</strong>m<strong>an</strong>ce</strong><br />
<strong>of</strong> the <strong>wind</strong> <strong>tunnel</strong>. The results indicate that the facility<br />
has low background noise <strong><strong>an</strong>d</strong> that the free <strong>jet</strong> is <strong>aero</strong>dynamically<br />
cle<strong>an</strong> with low turbulence intensity. Furthermore, the OASPL from<br />
the <strong>jet</strong> are as low, or lower, th<strong>an</strong> m<strong>an</strong>y <strong>of</strong> the other <strong>aero</strong>acoustic<br />
<strong><strong>an</strong>d</strong> automobile <strong>wind</strong> <strong>tunnel</strong>s around the world. Finally, a benchmark<br />
test was per<strong>for</strong>med by positioning in the free <strong>jet</strong> a NACA0012<br />
airfoil with s<strong><strong>an</strong>d</strong>paper tripping <strong><strong>an</strong>d</strong> measuring the corresponding<br />
trailing edge self-noise. The acoustics signals from the trailing edge<br />
were found to be subst<strong>an</strong>tially higher (by up 15 dB) th<strong>an</strong> the background<br />
noise levels. By removing the s<strong><strong>an</strong>d</strong>papers on the airfoil,<br />
further test was conducted where tonal noise was clearly
614 T.P. Chong et al. / Applied Acoustics 70 (2009) 605–614<br />
demonstrated. The <strong>wind</strong> <strong>tunnel</strong> is also being used to measure the<br />
self-noise from other bodies such as scale-models <strong>of</strong> high lift devices<br />
on aircraft <strong><strong>an</strong>d</strong> undercarriage components.<br />
In Memoriam<br />
Pr<strong>of</strong>essor Peter Davies, the co-author <strong>of</strong> this paper, passed away<br />
on February 2008 at the age <strong>of</strong> 85. He was one <strong>of</strong> the founders <strong>of</strong><br />
the Institute <strong>of</strong> Sound <strong><strong>an</strong>d</strong> Vibration Research (ISVR) in the University<br />
<strong>of</strong> Southampton, UK. This paper is dedicated to his memory.<br />
Peter was <strong>an</strong> outst<strong><strong>an</strong>d</strong>ing academic who worked on a wide r<strong>an</strong>ge<br />
<strong>of</strong> <strong>aero</strong>acoustic problems. We got to know <strong><strong>an</strong>d</strong> appreciate him as<br />
a kind, gentle <strong><strong>an</strong>d</strong> intelligent person. Apart from his pr<strong>of</strong>essional<br />
help, he also became our personal friend. His passing is there<strong>for</strong>e<br />
not only a great loss to the department, but also a sad personal loss.<br />
Acknowledgements<br />
The work reported in this report is sponsored by the DARP<br />
MSTARR in the UK. The authors would like to th<strong>an</strong>k John Coupl<strong><strong>an</strong>d</strong><br />
<strong>of</strong> Rolls-Royce <strong>for</strong> his helpful comments <strong><strong>an</strong>d</strong> supports throughout<br />
the project. The design <strong><strong>an</strong>d</strong> calculation <strong>of</strong> the primary silencer by<br />
Pr<strong>of</strong>essor Al<strong>an</strong> Cummings at Hull University are greatly<br />
appreciated.<br />
References<br />
[1] Amiet R. Noise due to turbulent flow past a trailing edge. JSV 1976;47:387–93.<br />
[2] Howe MS. Trailing edge noise at low Mach numbers. JSV 1999;225(2):211–38.<br />
[3] Oberai AA, Roknaldin F, Hughes TJR. Computation <strong>of</strong> trailing-edge noise due to<br />
turbulent flow over <strong>an</strong> airfoil. AIAA J 2002;40:2206–16.<br />
[4] W<strong>an</strong>g M, Moin P. Computation <strong>of</strong> trailing-edge flow <strong><strong>an</strong>d</strong> noise using largeeddy<br />
simulation. AIAA J 2000;38:2201–9.<br />
[5] S<strong><strong>an</strong>d</strong>berg RD, S<strong><strong>an</strong>d</strong>ham ND, Joseph PF. Direct numerical simulations <strong>of</strong> trailingedge<br />
noise generated by boundary-layer instabilities. JSV 2007;304(3–<br />
5):677–90.<br />
[6] Brooks TF, Pope DS, Marcolini MA. Airfoil self-noise <strong><strong>an</strong>d</strong> prediction. Tech. Rep.<br />
NASA Reference Publication 1218; 1989.<br />
[7] Roger M, Moreau S. Broadb<strong><strong>an</strong>d</strong> self-noise from loaded f<strong>an</strong> blades. AIAA J<br />
2004;42(3):536–44.<br />
[8] Ura H, Yokokawa Y, Ito T. Experimental study <strong>of</strong> trailing edge noise in lowspeed<br />
<strong>wind</strong> <strong>tunnel</strong>. In: Collection <strong>of</strong> technical papers – 45th AIAA <strong>aero</strong>space<br />
sciences meeting; 2007, 18. p. 12536–49.<br />
[9] Duell E, Walter J, Arnette S, Yen J. Recent adv<strong>an</strong>ces in large-scale <strong>aero</strong>acoustic<br />
<strong>wind</strong> <strong>tunnel</strong>s. In: 8th AIAA/CEAS <strong>aero</strong>acoustic conference <strong><strong>an</strong>d</strong> exhibit,<br />
Breckenridge, Colorado. AIAA Paper; 2002. p. 2002–503.<br />
[10] Mathew J, Bahr C, Sheplak M, Carrol B, Cattafesta LN. Characterization <strong>of</strong> <strong>an</strong><br />
<strong>an</strong>echoic <strong>wind</strong> <strong>tunnel</strong> facility. In: Proceedings <strong>of</strong> ASME, IMECE, Orl<strong><strong>an</strong>d</strong>o,<br />
Florida; 2005. IMECE2005-81737.<br />
[11] Leclercq D, Dool<strong>an</strong> C, Reichl J. Development <strong><strong>an</strong>d</strong> validation <strong>of</strong> a small-scale<br />
<strong>an</strong>echoic <strong>wind</strong> <strong>tunnel</strong>. In: 14th international congress on sound <strong><strong>an</strong>d</strong> vibration,<br />
Cairns, Australia; 2007.<br />
[12] Coupl<strong><strong>an</strong>d</strong> J. (Rolls-Royce Plc), Private Communication.<br />
[13] Cummings A. The attenuation <strong>of</strong> lined plenum chambers in ducts: I.<br />
Theoretical models. JSV 1978;61:347–73.<br />
[14] Kline SJ, Johnston JP. Diffusers: flow, design, <strong><strong>an</strong>d</strong> <strong>per<strong>for</strong>m<strong>an</strong>ce</strong> prediction, Part<br />
1: Diffuser-flow phenomena <strong><strong>an</strong>d</strong> design. In: Japikse D, editor. Adv<strong>an</strong>ced topics<br />
in turbomachinery technology (PLS-2). Concepts ETI, Inc.; 1986.<br />
[15] Sagi CJ, Johnston JP. The design <strong><strong>an</strong>d</strong> <strong>per<strong>for</strong>m<strong>an</strong>ce</strong> <strong>of</strong> two-dimensional, curved<br />
diffusers. Tr<strong>an</strong>s ASME J Basic Engng 1967;89:715–31.<br />
[16] Chong TP, Joseph PF, Davies POAL. A parametric study <strong>of</strong> passive flow control<br />
<strong>for</strong> a short, high area ratio 90 degree curved diffuser. Tr<strong>an</strong>s ASME J Fluids<br />
Engng, in press.<br />
[17] Pinker RA, Herbert MV. Pressure loss associated with compressible flow<br />
through square-mesh wire gauzes. J Mech Engng Sci 1967;9(1):11–23.<br />
[18] Bradshaw P. Wind <strong>tunnel</strong> screens: flow instability <strong><strong>an</strong>d</strong> its effect on aer<strong>of</strong>oil<br />
boundary layers. J Roy Aeronaut Soc 1964;68:168.<br />
[19] Kurze U. Sound propagation in a duct <strong>of</strong> periodic wall-structure. Acustica<br />
1969;21(2):74–85.<br />
[20] Paterson RW, Vogt PG, Fink MR, Munch CL. Vortex noise <strong>of</strong> isolated airfoils. J<br />
Aircraft 1973;10:296–302.<br />
[21] Arbey H, Bataille J. Noise generated by airfoil pr<strong>of</strong>iles placed in a uni<strong>for</strong>m<br />
laminar flow. JFM 1983;134:33–47.