AP Econ Section 2 Review - Sunny Hills High School
AP Econ Section 2 Review - Sunny Hills High School
AP Econ Section 2 Review - Sunny Hills High School

Create successful ePaper yourself
Turn your PDF publications into a flip-book with our unique Google optimized e-Paper software.
5. Vhich ofthe following would decrease rhe effecc ofa quota on<br />
a market? A(n)<br />
a- decrease in demand<br />
b. increase in supply<br />
Tackle the Test: Free-Response Questions<br />
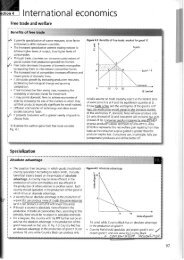
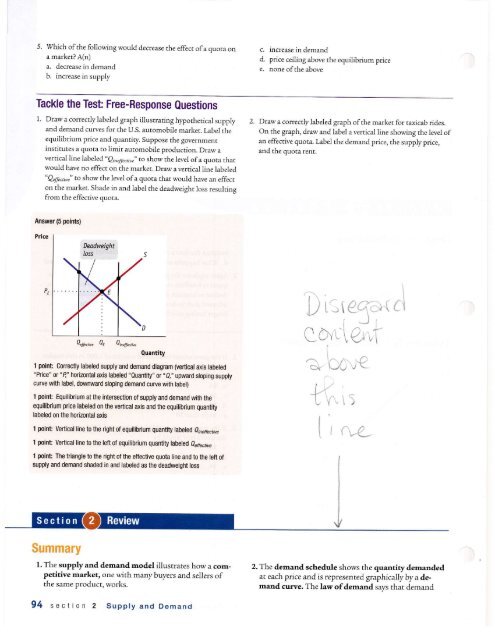
1. Draw a correctly labeled graph illustraring hypothetical supply<br />
and demand curves for the U.S. au[omobile market. Label the<br />
equilibrium price and quanciry. Suppose the government<br />
insrirutes a quora to limit automobile production. Draw a<br />
vercical line labeled " Q,41*i,"" to siow the level ofa quota that<br />
would have no effect on the markea. Draw a vertical line labeled<br />
"Q,6",a,i' co show the level ofa quora rhat would have an effect<br />
on the markel Shade in and label che deadweighr loss resulting<br />
from the effecrive quora.<br />
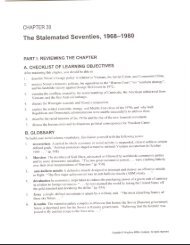
Answer (5 points)<br />
0uantitY<br />
1 point Correctly labeled supply and demand diagram (vertjcalaxis tabeled<br />
'Prlce' 0r "4" horizonblaxis labeled ',Quantity,' or ,,0," upward sloping supply<br />
curve with label, downward sloping demand curve wjti label)<br />
1 point Equilibrium at the intersection ot supply and demand wjti the<br />
equilibrium price labeled on the vertical axis and the equilibrium quantity<br />
labeled on the horizonhl axis<br />
1 poirlt Verlical line to the right ot equitibrium quantity tabeled Qas,'b.rrls<br />
1 point Vertical line b fie left 0f equilibrium quantv tabeted zenetve<br />
1 point lhe triangle to the right ot the efiective quota Iine and to the left ot<br />
supply and demand shaded in and labeled asthe deadweight loss<br />
Summary<br />
Q"nor" Q, Qr"i."*<br />
1. The supply and demand model illustrates how a competitive<br />
market, one with many buyers and sellers of<br />
the same product, works.<br />
94 section 2 Supply and Demand<br />
c. inctease in demand<br />
d. price ceiling above rhe equilibrium price<br />
e. none ofthe above<br />
2. Draw a correcrly labeled graph ofthe market for raxicab ddes.<br />
On the grap\ draw and label a vertical line showing rhe level of<br />
an effective quota. l^abel the demand price, the supply price,<br />
and the quota rent.<br />
C><br />
r_-r!,rL<br />
.<br />
Y'I.)<br />
i l'uC<br />
I<br />
I<br />
J<br />
(t<br />
2, The demand schedule shows the quantity dernanded<br />
at each price and is represented graphi cal1y by a demand<br />
curve. The law ofdemand savs that demand
curves slope downward, mearfng that as price decreases,<br />
rhe quantiry demanded increases.<br />
3. A movement along the demand curve occurs when<br />
the price changes ald causes a change in the quantity<br />
demanded. When economists talk of changes in<br />
demand, they mean shifts of the demand curve-a<br />
change in the quantity demanded at any given<br />
price. An increase in demand causes a rightward shift<br />
of the demand curve. A decrease in demand causes a<br />
leftward shift.<br />
4. There are five main factors that shift the demand curve:<br />
r A change in the prices ofrelated goods, such as substitutes<br />
or complernents<br />
r A change in income: when income rises, the demand<br />
For normal goods increases and the demand for inferior<br />
goods decreases<br />
. A change in tastes<br />
r A change in expectations<br />
r A change in the number of consumers<br />
5. The cupply schedule shows the quantity supplied at<br />
each price and is represented graphically by a supply<br />
curve. Supply curves usually slope upward.<br />
6. A movernent along dre supply curve occurs when the<br />
price changes and causes a change in the quantity supplied.<br />
Vhen economists talt ofchanges in supply, they<br />
mean shifts of the supply curve-a change in the quantity<br />
supplied at any given price. An increase in supply<br />
causes a rightward shift ofthe supply curve. A decrease<br />
in supply causes a lefrward shift.<br />
7. There are five main factors that shift the supply curve:<br />
r A change in input prices<br />
r A chalge in the prices ofrelated goods and services<br />
r A change in technology<br />
r A chalge in expectations<br />
r A change in the nunber ofproducers<br />
8. The supply and demand model is based on the principle<br />
that the price in a market moves to its equilibrium<br />
price, or market-clearing price, the price at which the<br />
quantity demanded is equal to the quantiry supplied.<br />
This quantiry is the equilibriurn quantity. when the<br />
price is above its market-clearing level there is a surplus<br />
that pushes the price down. When the price is<br />
below its market-clearing level, there is a shortage that<br />
pushes the price up.<br />
9. An increase in demand increases both the equilibrium<br />
price and the equilibrium quantity; a decrease in demand<br />
has the opposite effect. An increase in supply reduces the<br />
equilibrium price and increases the equilibrium quantity;<br />
a decrease in supply has the opposite effect.<br />
10. Shifts ofthe demand curve and the supply curve can<br />
happen simultaneously. \Vhen they shift in opposite directions,<br />
the change in price is predictable but the<br />
change in quantity is not. When they shift in the sa.me<br />
direction, the change in quantity is predictable but the<br />
change in price is not. In general, the curve that shifts<br />
the greater distance has a greater effect on the changes<br />
in price and quantity.<br />
11. Even when a market is efficient, governments often<br />
intervene to pursue greater faimess or to please a<br />
powerful interest group. Interventions carl take the<br />
form ofprice controls or quantity controls, both<br />
ofwhich generate predictable and undesirable side eF<br />
fects, consisting ofvarious forms ofinefficiency and illegal<br />
activity.<br />
12. A price ceiling, a, maximum market price below the<br />
equilibrium price, benefits successful buyers but creates<br />
persistent shortages. Because the price is maintained<br />
below the equilibrium price, the quantiry demanded is<br />
increased and the quantity supplied is decreased compared<br />
to the equilibrium quantity. This leads to predictable<br />
problems including iaefficient allocation to<br />
consumers, wasted resources, and inefticiendy low<br />
quality. It also encourages illegal activity as people tum<br />
to black markets to get the good. Because of these<br />
problems, price ceilings have generally lost favor as an<br />
economic poliry tool, Bur some govemments condnue<br />
to impose them either because they dorit understand<br />
the effects or because the Price ceilings benefit some influential<br />
gtoup.<br />
13. A price floor, a minimum market price above the equilibrium<br />
price, benefits successfirl sellers but creates a<br />
persistent surplus: because the price is maintained<br />
above the equilibrium price, the quantity demanded is<br />
decreased and the quantiry supplied is increased compared<br />
to the equiLibrium quantity. This leads to predictable<br />
problems: inefficiencies in the form of<br />
inefficient allocation of sales among sellers, wasted<br />
resources, and inefticiendy high quality. ft also encourages<br />
illegal activity and black markets. The most<br />
well known kind ofprice floor is the "'i"i"'u- wage,<br />
but price floors are also commonly applied to agricultural<br />
products,<br />
14. Quantity conrrols, or quotas, limit the quantiry ofa<br />
good that can be bought or sold. The govemment issues<br />
licenses to individuals, the right to sell a given quantiry<br />
ofthe good, The owner ofa license eams a quota rent,<br />
earnings that accrue fiom ownership ofthe right to sell<br />
the good. It is equal to the difference between the demand<br />
price at the quota amount, what consumers afe<br />
willing to pay for that amount, and the supply price at<br />
the quota amount, what suppliers are willing to arcept<br />
for that amount. <strong>Econ</strong>omists say that a quota drives a<br />
wedge between the demand price and the supply price;<br />
this wedge is equal to the quota rent. By limiting mutually<br />
beneficial transactions, quanriry controls generate<br />
inefficienry. Like price controls, quantity controls lead<br />
to deadweight loss and encourage ill egal acnviqt.<br />
Summary 95
Key Terms<br />
Competitive marker, p. 48<br />
Supply and demand rnodel, p. 48<br />
Demand schedule, p. 49<br />
Quantity demanded, p. 49<br />
Demand curve, p.49<br />
l.aw ofdemand, p. s0<br />
Change in deman4 p. s r<br />
Movementalong the demand curve, p.51<br />
Substitlrtes, p. 53<br />
Complements, p.53<br />
Normal good, p.53<br />
Inferior good, p.54<br />
lndividual demand curve, p. 55<br />
Quan.it/ supplied p.59<br />
Supply schedule, p. s9<br />
Problems<br />
Supply curve, p.59<br />
Lawofsupply, p. 60<br />
Chaage in supply, p. 60<br />
Movement along the supply curve, p.60<br />
Input, p. 62<br />
Individual supply curve, p. 64<br />
Equilibrium, p.66<br />
Equilibrium price, p. 66<br />
Market-clearing price, p. 66<br />
Equilibrium quanriry p. 55<br />
Surplus, p.68<br />
Shortage, p. 68<br />
Hflce concrors. p. //<br />
Pice ceilin|d p. 77<br />
Price floor, p. 77<br />
1. A survey indicated that chocolate ice cream is America's favorite<br />
ice-cream flAvor. For each of the following, indicate the<br />
possible effects on the demand and/or supply, equilibrium<br />
price, and equilibrium quantiry ofchocolate ice cream.<br />
a- A severe drought in the Midwest causes dairy farmers to re-<br />
duce the nunber ofmilk-producing cows in their herds by a<br />
third. These dairy farrners supply cream that is used to<br />
manufacture chocolaae ice cream.<br />
b. A new report by the American Medical Association reveals<br />
tlat chocolate does, in facr, have significanr heakh benefirs.<br />
c. The discovery ofcheaper synthetic vanilla flavoring lowers<br />
the price ofvanilla ice cream.<br />
d. New technologu for mixing and freezing ice cream lowers<br />
manufaclurers' costs ofproducing chocolate ice cream.<br />
2. In a supply and demand diagram, draw the change in demand<br />
for hamburgers in your hometown due to the following evenrs.<br />
In each case show the effect on equilibriurn price and quandry<br />
a. The price oftacos increases.<br />
b.All hamburger sellers raise the price oftheir french fries.<br />
c. Income falls in town. Assume that hamburgers are a normal<br />
good lor most people.<br />
d.Income falls in town. Assume that hamburgers are an inferior<br />
good for most people.<br />
e. Hot dog stands cut the price ofhot dogs.<br />
3. The market for many goods chaages in prediccable ways according<br />
to the time ofyear, in response to events such as holidays,<br />
vacation rimes, seasonal changes in productionJ and so<br />
on. Using supply and demand, explain the change in price in<br />
each of the following cases. Note chat supply and demand may<br />
shift simultaneously.<br />
a. Lobscer prices usually faII during the summer peak harvest<br />
seasoq despite the faca chat people like to eat lobster during<br />
the summer monrhs more than during any other time ofyear<br />
96 section z Supply and Demand<br />
In€fficient a.lloca.ion ro consumers, p.80<br />
Wasced resources, p. 80<br />
Ineffrciendy low quality, p. 8 1<br />
Black markets, p. 8 1<br />
Minimum wage, p. 82<br />
lnefficient allocation ofsales anong sellers, p. 84<br />
Inefnciendy high quality, p.85<br />
Quantity control or quot4 p.88<br />
License, p. 88<br />
Demand price, p. 89<br />
Supply price, p.90<br />
wedge, p.91<br />
Quota rent, p. 9 1<br />
Deadweight loss, p. 92<br />
b.The price ofa Christmas tree is lower after Christmas than<br />
before and fewer trees are sold.<br />
c. The price ofa round-trip ticket to Paris on Air France falls<br />
by more than $200 after the end ofschool vacadon in September.<br />
This happens despite the fact that generally worsening<br />
weather increases the cost ofoperating flights ro<br />
Paris, and Air France therefore reduces the number of<br />
flights co Paris at any given price.<br />
4, Show in a diagrarn the effect on the demand curve, the supply<br />
curve, the equilibrium price, and the equilibrium quanticy of<br />
each ofthe following events on the designated marke[.<br />
a- the market for newspapers in your town<br />
Case 1: The salaries ofjournalists go up.<br />
Case 2: There is a big news event in your town, which is<br />
reported in the newspapers, and residents want to<br />
learn rnore about it.<br />
b. rhe marker for Sr. Louis Rains cotton T-shirts<br />
Case 1: The Rams win the national championship.<br />
Case 2: The price ofcotton increases.<br />
c, the market for bagels<br />
Case 1: People realize how fattening bagels are.<br />
Case 2: People have less time to make chemselves a cooked<br />
breakfast.<br />
5. Find the flaws in reasoning in the following statements, paying<br />
particular attention to the distinction between changes<br />
in and movernents along the supply and demand curves.<br />
Draw a diagram to illustrate what actually happens in each<br />
situation.<br />
a.'A technological innovation thaa lowers the cost ofproducing<br />
a good might seem at first to resulc in a reduction in the<br />
price ofche good to consumers. But a fall in price will increase<br />
demand for che good, and higher demaod will send<br />
the pdce up again. It is not certain, therefore, ahaa an innovation<br />
will really reduce price in the end."
.'A study shows thac eacing a clove ofgarlic a day can help prevent<br />
heaj:t dlsease, causing many consumers to demand more<br />
garlic. This increase in demand results in a rise in the price of<br />
garlic. Consume$J seeing that the price ofgarlic has gone up,<br />
reduce their demand for garlic. This causes the demand for<br />
garlic to decrease and the price ofgarlic to fall. Therefore, the<br />
ultimate effect ofthe study on the price ofgarlic is uncertain."<br />
6. In RollingStone rtaeazine, several fans and rock stars, including<br />
Pearl Jam, were bemoaning rhe high price of concert rickecs.<br />
One supe$tar argued, "It just isn't worth $75 to see me play.<br />
No one should have to pay that much to go to a conceft." Assume<br />
this star sold out arenas around the country at ar average<br />
ticket price of$75.<br />
e. How would you evaluace the arguments that ticket prices<br />
are too high?<br />
b.Suppose that due to this star's protests) cicket prices were<br />
lowered to $50. In what sense is this price too low? Draw a<br />
diagram using supply alrd demand curves to suppor! your<br />
afgument.<br />
c. Suppose Pea.rl Jam really wanted to bring down ticket<br />
prices. Since the band controls the supplyofits services,<br />
what do you recommend they do? Explain using a supply<br />
and demand diagram.<br />
d.Suppose the band's next CD was a total dud. Do you chink<br />
they would still have to worry about ticket prices being too<br />
high? V/hy or why not? Draw a supply and demand diagram<br />
ao suPPort your argumena.<br />
e. Suppo:e the group announced their nexr rour was going co<br />
be their last. Vhat effecc would this likely have on the demand<br />
for and price oftickets? Illustrate wich a supply and<br />
demand diagram.<br />
7. After several years of decline, the market for handrnade<br />
acoustic guitars is making a comeback. These guitats are<br />
usually made in small workshops employing relatively few<br />
highly skilled luthiers. Assess the impact on the equilibrium<br />
price and quantity ofhandmade acoustic guitars as a result of<br />
each of che following events. In your answers, indicate which<br />
curve(s) shift(s) and in which direccion.<br />
a. Environrnentalists succeed in having the use ofBrazilian<br />
rosewood banned in the United States, forcing luthiers to<br />
seek out alternative, more costlywoods.<br />
b,A foreign producer reengineers the guitar-making process<br />
and floods the market with identical guitars.<br />
c. Music featuring handmade acoustic guitars makes a comeback<br />
as audiences tire ofhealy metal and grunge music.<br />
d. The country goes into a deep recession and the income of<br />
che average American falls sharply.<br />
8. Vill Shalespeare is a struggling ptaywright in sixteenthcentury<br />
London. As the price he receives for writing a play increases,<br />
he is willing to write more plays. For the following<br />
situations, use a diagram ro illustrate how each event affects<br />
the equilibrium price and quantity in the market for Shakespeare's<br />
plays.<br />
a. The playwright Christopher Marlowe, Shakespeare's chief<br />
rival, is kilted in a bar brawl.<br />
b.The bubonic plague, a deadly infectious disease, breaks out<br />
in London.<br />
c. To celebrate the defeat of the Spanish Armada, Queen Elizabeth<br />
declares severa.l weeks of festivities. which involves<br />
commissioning new plays.<br />
9. The small town ofMiddling experiences a sudden doubling of<br />
the birth rate. After three years, che birth rate returns to normal.<br />
Use a diagram to illustrate the effect of these events on<br />
the followidg:<br />
a. the market for an hour ofbabysitting serwices in Middling<br />
today<br />
b.the market for al hour ofbabysitting services 14 years inao<br />
che fucure, after the birch rate has returned co normal, by<br />
which time children bom today are old enough to work as<br />
babysitters<br />
c. the market for an hour ofbabysitting serwices 30 years into<br />
che future, when children bom today are likely to be having<br />
children oftheir own<br />
10. Use a diagram to illustrate how each oFthe following events affects<br />
the equilibrium price and quandry ofpizza.<br />
a. The price ofmozzarella cheese rises.<br />
b,The health hazards ofharnburgers are widely publicized.<br />
c. The price ofaomato sauce falls.<br />
d. The incomes ofconsumers rise and pizza is an inferior good<br />
e. Consumers expect the price ofPizza to fall nqtt week.<br />
11, Although he was a prolific artist, Pablo Picasso painted only<br />
1,000 canvases during his "Blue Period." Picasso is now dead<br />
and all of his Blue Period works are currendy on display in<br />
museums and private galleries throughout Europe and che<br />
United States.<br />
a- Draw a supply curve for Picasso Blue Period works. Why is<br />
this supply curve different from ones you have seen?<br />
b. Given the supply curve from part E the price ofa Picasso<br />
Blue Period work will be entirely dependena on what factor(s)?<br />
Draw a diagram showing how the equilibrium price<br />
ofsuch a work is determined.<br />
c. Suppose that rich art collectors decide that it is essential to<br />
acquire Picasso Blue Period art for their colleclions. Show<br />
the impact ofthis on the market for these paintings.<br />
12. Draw the appropiace curve in each ofthe following cases ls it<br />
like or unlike the curves you have seen so far? Explain.<br />
a. the demand for cardiac bypass surgery, given that the governmenI<br />
Pays the lull cosc for any patienr<br />
b. the demand for elective cosmetic Plastic surgery given that<br />
rhe parient pays the full cost<br />
c. the supply ofRembrandt paintings<br />
d. the supply ofreproductions ofRembrandt paintings<br />
13. Suppose it is decided that rent contiol in New York City will be<br />
abolished and that market rents will now prevail Assume that<br />
all rental units are identical and axe therefore offered ac the<br />
same rent. To address che Plighc ofresidents who may be unable<br />
to pay the market rent, an income suPplement will be paid<br />
to all low-income households equal co the difference between<br />
the old controlled rent and the new market reflc.<br />
a. Use a diagram to show the effect on the rental market ofthe<br />
elimination ofrent control. \I4rat will hapPen to the quality<br />
and quantity ofrental housing supplied?<br />
summary 97
.Now use a second diagran-r to show the addicional elfect of<br />
the income-supplement policy on rhe market. What effect<br />
does it have on the market renc and quantity ofrental hous<br />
ing supplied in comparison to your arswers co part a?<br />
c, Are tenancs better or worse offas a result ofthese policies?<br />
Are landlords better or worse ofl.)<br />
d. Ftom a political standpoint, why do you think cities have<br />
been more likely to resorc !o renc control rather chan a policy<br />
ofincome supplements to help low-income people pay<br />
for housing?<br />
14. In rhe late eighteench century) the price ofbread in New York<br />
City was controlled, set at a predetermined price above the<br />
marke! price.<br />
a. Draw a diagram showing the effect ofrhe policy. Did the<br />
policy act as a price ceiling or a price floor?<br />
b. V4rat kinds ofinefficiencies were likely co have arisen when<br />
the controlled price ofbread was above the market price?<br />
Explain in decail.<br />
One year during chis period, a poor wheat haivest caused a<br />
lefcward shift in the supplyofbread and therefore an increase<br />
in its rnarket price. New York bakers found that tie controlled<br />
price ofbread in New York rvas below the marker price.<br />
c. Draw a diagram showing the effect ofthe price control on<br />
the market for bread during this one-year period. Did the<br />
policy act as a price ceiling or a price floor?<br />
d. What kinds ofinefficiencies do you think occurred during<br />
this period? Explain in decail.<br />
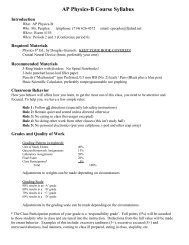
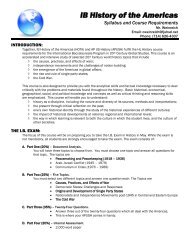
15, Suppose the U.S. government decides thar the incomes ofdairy<br />
farmers should be maincained ac a level that allows the traditional<br />
family dairy farm co survive. It thereFore implements a<br />
price floot of $ 1 per pint by buying surplus miJk until the market<br />
price is $1 per pint. Use the a.companying diagram co answer<br />
the following questions.<br />
Price of mitk<br />
(per pint)<br />
$1.20<br />
1.10<br />
1.00<br />
0.90<br />
0-80<br />
l,t t t i i i t t<br />
0 500 550 600 650 700 750 800 850<br />
ouantity of mitk (mitlions of pints per year)<br />
a. How much surpius milk will be produced as a result ofthis<br />
policy?<br />
b. What will be the cosr to the government ofthis policy?<br />
c, Since milk is an important source ofprotein and calcium, the<br />
government decides to provide rhe surpJus milk it purchases<br />
!o elementary schools ac a price ofonly $0-60 per pint- Assume<br />
that schools will buy any amount oFmilk available ar<br />
chis low price. But parents now reduce their purchases of<br />
milk at anyprice by 50 million pints per year because they<br />
98 section z Supply and Demand<br />
know their children are getting milk at school. How much<br />
will the dairy program now cost the governmenc?<br />
d. Give two examples ofinefficiencies arising from wasted re<br />
sources that are likely to resuit from this policy. What is the<br />
missed opportuniry in each case?<br />
16. As noted in che text, European governments tend to make<br />
greater usc ofp ce controls than does che U.S. government.<br />
For evample. rhe French governmenr serr rninimum st.rrting<br />
yearly wages for new hires who have completedle bac, certiftca<br />
tion roughly equivalent to a high school diploma. The demand<br />
schedule for new hires with le &a. and che supply schedule for<br />
simiLarly credentialed new job seekers are given in the accompanying<br />
table. The price here given in euros, the currency<br />
used in France-is the same as the yearly wage.<br />
Wage<br />
(per year)<br />
€45,000<br />
Quantity demanded<br />
(new job otfers<br />
peryeaO<br />
200.000<br />
40,000 220,000<br />
35,000 250,000<br />
30,000 290,000<br />
25,000 370,000<br />
ouantity supplied<br />
(new job seekers<br />
peryear)<br />
325,000<br />
320,000<br />
310,000<br />
290,000<br />
200,000<br />
e. In the absence ofgovernmenc interference, what is the equi-<br />
Iibrium wage and number ofgraduates hired per year? Illus<br />
trace with a diagram. Will there be anyone seeking ajob ar<br />
the equilibrium wage who is unable to find one that is, will<br />
there be anyone who is involuntarily unemployed?<br />
b. Suppose the French government sers a minimum yearly<br />
wage of35,000 euros. ls there any involuntary unemployment<br />
at this wage? Ifso, how much? Illustrate with a diagram.<br />
What if che minimum r'"age is set at 40,000 euros?<br />
Also illustrate with a diagram.<br />
c. Given your aflswer to part b and che inf(]rmation in the<br />
table, what do you think is the relationship between the<br />
Ievel ofinvoluntary unernploymcnt and the level ofthe<br />
minimum wage? Who benefics from such a policy? Who<br />
loses? \{4rat is the missed opportuniry here?<br />
17. Until recently, the scandard number ofhours worked per week<br />
for a full-time job in France was 39 hours, similar to in the<br />
Uniced States. But in response to socia-l unrest over high levels of<br />
involuntary unemployment, the French government instituted<br />
a 3S-hour workweck a worker could not work mote than 35<br />
hours per u,eck even ifboth the rlrcrker and errrployer wanted it.<br />
The motivation behind this polirywas that ifcurrent employees<br />
worked fewer hours, employers would be forced to hire more<br />
new workers. Assume thar it is costly for employers to train new<br />
workers. French employers were greatly opposed to chis policy<br />
and threatened to move their operacions to neighboring countries<br />
that did not have such employment iestrictions. Can you<br />
explain cheir atticude? Give an example ofboth an inefliciency<br />
and an illegal activiry that are likely to arise from chis poliry<br />
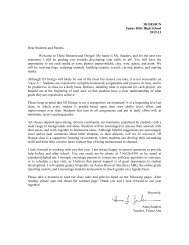
18, For the last 70 years, the U.S. goverflment has used price supports<br />
to provide income assistance to U.S. farmers. At tines<br />
the government has used price floors, which it mainrains by
ulng up the surplus farm products. At other times, it has<br />
used target prices, giving the farmer an amount equal to the<br />
difference between the market price and the target price for<br />
each unit sold. Use the accompanying diagrarn to answer rhe<br />
following questions.<br />
Ptlce of corn<br />
(per bushet)<br />
$5<br />
800 1.000 1,200<br />
ouantity of corn (bushels)<br />
a" Ifthe govemment sets a price floor of$5 per bushel, how<br />
many bushels ofcorn are produced? How many are purchased<br />
by consumers? by the government? How much does<br />
the program cost the govemmen!? How much revenue do<br />
cofn farmers receive?<br />
b. Suppose the govemment sets a taiget price of$5 pet bushel<br />
for any quartity supplied up ro 1,000 bushels- How many<br />
bushels ofcorn are purchased by consumers and at what<br />
price? by the govemment? How much does che prcgram cosc<br />
the govemment? How much revenue do com farmers receive?<br />
c. Which ofthese programs (in parts a and b) costs com consumers<br />
more? Which prograrn costs the government more?<br />
Explain.<br />
d. what are the inefficiencies chat arise in each of these cases<br />
(parts a and b)?<br />
19. The waters offthe north Atlantic coast were once teeming with<br />
fish. Now, due to overfishing by the commercial fishing industry<br />
the stocks of fish are seriously depleted. Io 1991, the Nationd<br />
Marine Fishery Service of tie U.S. govemmena implemented a<br />
quota to allow fish stocks to recover. Ttre quoca lirnited the<br />
arnounc of swordfrsh caught per yeat by all U.S.-licensed fishing<br />
boats to 7 million pounds. As soon as the U.S. fishing fleec had<br />
met the quot4 the swordfish catch was closed down fot the rest<br />
of the year. The accompanying table gives the hypothetical demand<br />
and supply schedules for swordfish caught in the United<br />
States per year.<br />
Pric€ ol swordfsh<br />
(per pound)<br />
$20<br />
18<br />
16<br />
14<br />
12<br />
ouanlity of $! mdffsh<br />
(millions ot pounds per year)<br />
ouantity demanded<br />
6<br />
7<br />
8<br />
9<br />
10<br />
ouanw supplied<br />
a- Use a diagratn to show the effect ofthe quota on the market<br />
for swordfish in 1991.<br />
b. How do you think fishermen will change how they fish in<br />
response to this PolicY?<br />
15<br />
13<br />
11<br />
I<br />
7<br />
summary 99