IB Econ Chap 26 Terms of Trade - Sunny Hills High School
IB Econ Chap 26 Terms of Trade - Sunny Hills High School
IB Econ Chap 26 Terms of Trade - Sunny Hills High School

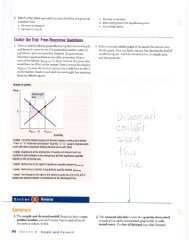
Create successful ePaper yourself
Turn your PDF publications into a flip-book with our unique Google optimized e-Paper software.
{+<br />
oooaaaaaaaoooooooaoooo<br />
<strong>Terms</strong> <strong>of</strong> trade<br />
By the end <strong>of</strong> fris chapter, you<br />
rr define, explain, and give er
!!!!!<br />
.9 Eo<br />
lo<br />
c<br />
.9<br />
E<br />
318<br />
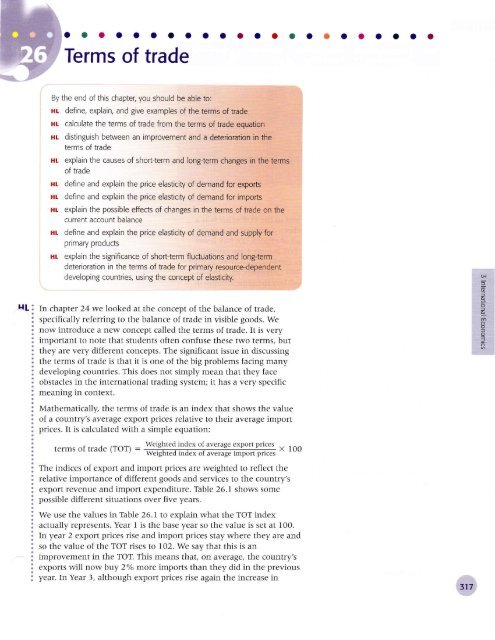
<strong>26</strong> o <strong>Terms</strong> <strong>of</strong> trade<br />
Year I<br />
Year 2<br />
Year 3<br />
Year 4<br />
Year 5<br />
Year 6<br />
r00<br />
r02<br />
106<br />
I0<br />
108<br />
106<br />
Table <strong>26</strong>.1 <strong>Terms</strong> <strong>of</strong> trade igures<br />
i00<br />
100<br />
104<br />
110<br />
r06<br />
r08<br />
ffixroo<br />
ffixroo<br />
r06<br />
104<br />
|0..<br />
I t0 "<br />
t08 ..<br />
l(lt)<br />
x 100<br />
import prices is relatively more great and so the TOT value falls a<br />
little Lo 101.92. We say that there has been a detedoration in the<br />
TOT, which means LhaL a givcn amount <strong>of</strong> cxports can buy fewer<br />
imports than in year 2. However, the TOT in year 3 are still better<br />
than in year l. In year 4, import prices dse by relatively more than<br />
export prices and so the value <strong>of</strong> the TOT falls again, back to 100. So<br />
in year 4 a given amount <strong>of</strong> exports will buy the samc amounL <strong>of</strong><br />
imp<strong>of</strong>is as in year I. In year 5 export pdces fall but import priccs fall<br />
by more, whicb this lcads to an improvement in the TOT and the<br />
value rises to I0I.89.<br />
We can sce from the example that if export pdces rise relative to<br />
import prices, or if they lall by relatively less than imporL prices fall,<br />
lhen the TOT will improve. In the same way, if import prices dse by<br />
more than export prices. or iI rhey fall by relatively less than exporl<br />
prices fall, then the TOT will dctcriorate.<br />
The key thing to realize is that if the TOT improve, then a given<br />
quantity <strong>of</strong> cxports will buy a larger quantity <strong>of</strong> imports than bcfore.<br />
We <strong>of</strong>ten talk about a "basket" <strong>of</strong> exports, in the same way as<br />
mcasuring inflation. I1 the price <strong>of</strong> a basket <strong>of</strong> exports lalls, Lhcn a<br />
country will need to sell more exports in order to kccp imporLs at the<br />
same level.<br />
Student workpoint <strong>26</strong>.1<br />
Be a thinker<br />
I Using the data in Table <strong>26</strong>.1 , calculate the TOT for year 6.<br />
2 Describe the changes !n the TOT from year 5. What does this mean<br />
about the "buying power" <strong>of</strong> the country's exports?<br />
5 How does the buying power <strong>of</strong> the country's exports in year 6<br />
compare with year I ?<br />
Asses$nent odviae: ln HL paper 3, you may be asked to calculate the terms <strong>of</strong><br />
trade as in workpoint <strong>26</strong>.1 .<br />
r00<br />
100<br />
r00<br />
102<br />
t0r.92<br />
100<br />
101.89<br />
']
Language may be misleading. lt should be noted that the expressions<br />
"improvement in the TOT" and "deterioration <strong>of</strong> the TOT" do not<br />
necessarily mean what they mean in everyday language. A deterioration<br />
<strong>of</strong> the TOT may not necessarily be a bad thing and an improvement<br />
does not necessarily result in a good thing. We will look at the<br />
consequences <strong>of</strong> changes in the TOT in future material.<br />
While language is used to access knowledge it can sometimes be used<br />
to confuse or even exclude. Can you think <strong>of</strong> other examples <strong>of</strong><br />
economic language that would make it dif{icult for non-economists to<br />
know what economists are talking about?<br />
Causes <strong>of</strong> changes in a country's telms <strong>of</strong> trade<br />
in the short run and the long run<br />
Short-run causes<br />
Short-run changes in the TOT may be caused by the following.<br />
. Changes in the conditi)ns 0f demand and supply: If the demand for<br />
exports changes, i.e. if the demand curve shifts, then there will be<br />
a change in the price <strong>of</strong> exports. Prices oI competitive goods in<br />
other countries may change, affecting the competitiveness oI the<br />
exports, incomes in importing countries may change, affecting the<br />
demand for imports, and consumer tastes may change for the<br />
goods and services that the country exports.<br />
Changes in supply may also have a noticeable effect upon the<br />
price <strong>of</strong> exports. II a number <strong>of</strong> countries experience an increased<br />
supply <strong>of</strong> a certain product, perhaps because weather conditions<br />
are favourable, then its price will fall. For example, record wine<br />
harvests in Australia led to a 97o fall in average prices in 2006.<br />
The effect oI such a change on the TOT depends on the<br />
importance <strong>of</strong> overall expons <strong>of</strong> the good.<br />
o Changes in relative inflation rates: If,lhe inflation rates in one country<br />
are higher than in another then their export prices will begin to<br />
rise. Although this results in an improvement in the TOT, the<br />
country's exports will start to be less competilive.<br />
o Changes in exchange rates: A change in the value <strong>of</strong> a country's<br />
currency will lead to a change in the price <strong>of</strong> exports relative to<br />
imports. The change in exchange rate may be through market<br />
forces or as a result <strong>of</strong> government intervention in the foreign<br />
exchange market.<br />
Long-run causes<br />
Long-run changes in the TOT have various causes.<br />
o Income changes: Rising incomes, especlally in developed countries,<br />
lead to an increase in demand for secondary and, especially,<br />
tertiary products, whose income elasticity <strong>of</strong> demand tends to be<br />
income elastic. This has an obvious effect upon the relative prices<br />
<strong>of</strong> the types <strong>of</strong> products. The TOT <strong>of</strong> developed countries, which<br />
produce more secondary and tertiary products, tend to improve<br />
<strong>26</strong> . <strong>Terms</strong> <strong>of</strong> trudu @!<br />
319<br />
6<br />
q<br />
9!<br />
o<br />
a<br />
o<br />
J.
[!<br />
<strong>26</strong> . <strong>Terms</strong> <strong>of</strong> trade<br />
relative to the TOT oI developing countries, many <strong>of</strong> whom are<br />
much more dependent upon the exponing <strong>of</strong> primary products,<br />
whose income elasticity tends to be income-inelastic. In effect,<br />
there is a change in world trade patterns.<br />
Long-run improvements in productivity within a counry: This will lead<br />
to a gradual deterioration <strong>of</strong> the TOT for that country because their<br />
real prices will not rise significaltly. However, the country's exports<br />
would be more competitive on the international markets and so<br />
the result could be positive, if demand for the expots is elastic.<br />
Long-run improvemmts in technology within a uuntry : This will lead<br />
to lower costs <strong>of</strong> production, increases in supply, and lower<br />
prices. If this occurs, then the country will experience a gradual<br />
deterioralion in its TOT. This will, however, make the country's<br />
exports more competitive and, if the elasticity <strong>of</strong> demand for its<br />
exports is elastic, the balance <strong>of</strong> trade should improve.<br />
Elasticity <strong>of</strong> demand for imports and expods<br />
As you now realize, the concept <strong>of</strong> elasticity is very imponant in<br />
economics. It is extremely relevant to our discussion <strong>of</strong> the TOT. We<br />
need to go back to a discussion about the price elasticity <strong>of</strong> demand<br />
for exports and imports in <strong>Chap</strong>ter 24 to make an e{fective analysis<br />
<strong>of</strong> TOT changes.<br />
Price elasticity <strong>of</strong> demand for exports<br />
As we know, the price elasticity <strong>of</strong> demand for exports is a measure<br />
<strong>of</strong> the responsiveness <strong>of</strong> the demand for exports when there is a<br />
change in the price <strong>of</strong> exports. It is measured by the equation:<br />
Percentage change in demand for exports<br />
PED....', = Percentage change in average price <strong>of</strong> erTorts<br />
If the demand for exports is elastic, then a change in the average price<br />
<strong>of</strong> exports will lead to a greater proportional change in the demand for<br />
them. This would be good for a country where export prices were<br />
falling, since export demand would rise by proponionately more than<br />
the prices fell leadilg to an increase in export revenues. Most ex?orts,<br />
certainly in the long run, face elastic demand, i.e. a value <strong>of</strong> PED."pon,<br />
that is greater than I. However, many commodities (raw materials<br />
such as oil, copper, c<strong>of</strong>fee, cotton, steel, rice, sugar, and rubber) tend<br />
to have inelastic demand.<br />
Price elasticity <strong>of</strong> demand for imports<br />
The price elasticity <strong>of</strong> demand for imports is a measure <strong>of</strong> the<br />
responsiveness <strong>of</strong> the demand for imports when there is a change in<br />
the price <strong>of</strong> imports. It is measured by the equation:<br />
Percentage change in demand for imports<br />
PEDi,rp<strong>of</strong>ts : Percentage change in average price <strong>of</strong> imports<br />
If the demand for imports is inelastic, then a change in the price <strong>of</strong><br />
imports will lead to a smaller proportional change in the demand Ior<br />
them. This would not be good for a country where import pdces<br />
were rising, since import demand would fall by proportionately more<br />
than the prices increased. Most imports, certainly in the long run,<br />
face elastic demand, i.e. a value <strong>of</strong> PED6oo,ts that is greater than I.<br />
However, commodities tend to have inelastic demand.<br />
Student workpoint <strong>26</strong>.2<br />
Be a thinker<br />
Draw a revenue box diagram to<br />
show and explain the effect <strong>of</strong>,<br />
falling average export prices on<br />
export revenues when demand<br />
for exports is inelastic. On the<br />
y-axis, write "Average price <strong>of</strong><br />
exports".<br />
Student workpoint <strong>26</strong>.7<br />
Be a thinker<br />
Draw a revenue box diagram to<br />
show and explain the effect <strong>of</strong><br />
rising average import prices<br />
on export expenditure when<br />
demand for exports is inelastic.<br />
Label the y-axis 'Average price<br />
<strong>of</strong> imports".
How beneficial is an improvement in the<br />
terms <strong>of</strong> trade?<br />
As noted earlier, an improvement in the TOT is not necessadly a<br />
good thing. We need to consider the effect <strong>of</strong> an improvement in the<br />
TOT on a country's current account balance. The outcome will<br />
depend upon the reason for the improvement. Possible reasons for<br />
improvement include the following.<br />
An increase in demand for a count{s exports<br />
A number <strong>of</strong> factors may cause demand for a country's exports to<br />
rise. Consider the exports ftom country A. Prices in other countries<br />
may have risen, making country .As exports more competitive;<br />
ilcomes in importing countries may have risen, increasing their<br />
demand for imports and so increasing demand for country As<br />
exports; and consumer tastes may have changed in favour <strong>of</strong> the<br />
goods and services that country A exports.<br />
An increase in the demand for country -4s exports is shown in<br />
Figure <strong>26</strong>.1.<br />
When the demand increases the average export price rises from P to<br />
Pr. The quantity oI expons demanded and supplied increases ftom Q to<br />
Q1. The higher export prices mean that the TOT have improved, and<br />
total export revenue rises from OPXQ to 0PryQr. This will lead in tum<br />
to an improvement in the current account balance. We cal say that:<br />
o An improvement in the TOT when caused by an increase in<br />
demand for exports, leads to an improvement in the current<br />
account balance.<br />
<strong>High</strong>er export plices caused by domestic inflation<br />
Relative export prices may increase because a country is experiencing<br />
inflation that is higher than in the countries with which it trades. If<br />
this is the case then there will be an improvement in the TOT. Whether<br />
this improvement in the TOT leads to an improvement in the orrent<br />
account balance will depend upon the elasticity <strong>of</strong> demand for the<br />
country's exports. The situation is shown in Figure <strong>26</strong>.2.<br />
The demand curve lor exports is normal and has the usual relationship<br />
with the MR curve and the TR curve. As we know from<br />
microeconomics, the value ol price elasticity <strong>of</strong> demand on a demand<br />
curve falls as the price falls. There will be al elastic region oI the<br />
demand curve and an inelastic region. These are shown in Figtre <strong>26</strong>.2.<br />
Il the demand for exports is inelastic, i.e. price is on lhe lower<br />
paft <strong>of</strong> the demand curve, then an increase in price will lead to a<br />
proportionately smaller decrease in demand and so total export<br />
revenue will rise. As we see in the diagram, an increase in price from<br />
P to PL leads to an increase in export revenue from ER to ERr. This<br />
will improve the current account balance.<br />
Therefore we can say that:<br />
o An improvement in the terms <strong>of</strong> trade, when caused by inflation,<br />
leads to an improvement in the current account balance when the<br />
demand for exports is inelastic.<br />
t<br />
0 QQ'<br />
<strong>26</strong> . <strong>Terms</strong> <strong>of</strong> trade llll!<br />
Quantity ol exports<br />
Figure <strong>26</strong>.1 An increase in demand<br />
for exports<br />
6 ER.<br />
d rn.<br />
EER<br />
t<br />
E'<br />
0<br />
Figure<br />
export<br />
I<br />
]K<br />
i TR (eipor6)<br />
tnelastic demand<br />
-.fr\<br />
:,- -l- - - - ;\i. D (exp<strong>of</strong>ts)<br />
MR<br />
Quantity <strong>of</strong> exports<br />
<strong>26</strong>.2 The demand for exports and<br />
revenue
l!!!!<br />
E<br />
s<br />
8<br />
u.,<br />
E<br />
322<br />
<strong>26</strong> . <strong>Terms</strong> <strong>of</strong> trade<br />
If the demand for exp<strong>of</strong>is is elastic, i.e. pdce is on the upper part<br />
<strong>of</strong> the demand curvc, then an increase in price will lead to a<br />
proportionately grcater decrease in demand and so total export<br />
revenue will fall. As we see in the diagram, an increase'in price lrom<br />
P2 to Pr leads to a fall in export revenue from ER2 to ER3. This witl<br />
depreciate the cunent account balancc. We can say that:<br />
. An improvcmcnt in the terms <strong>of</strong> trade when caused by inflation<br />
leads to a deprecialion in the current account balance when the<br />
demand lor exports is relatively elaslic.<br />
When we compare this siluation to the real world, we notice two<br />
things.<br />
I The price elasticity <strong>of</strong> demand for most exports tends to be clastic.<br />
For thc majority <strong>of</strong> products sold on cxport markets, there is much<br />
compctition between countries and so demand tends to be elastic.<br />
It is generally commodiLics that lace inelastic demand, so it is<br />
likely that most countries will bc on the elastic part <strong>of</strong> the demand<br />
curye {or their exports.<br />
2 Even if demand is on the inelastic part <strong>of</strong> Lhc dcmand curve. if<br />
relatively high inflation rates continue thcn rhc price <strong>of</strong> exports<br />
will eventually movc into the elastic region <strong>of</strong> the demand curve.<br />
Overall, an improvemcnt in the terms oI trade due to inflation<br />
generally leads to a depreciation in thc current account balance.<br />
The significance <strong>of</strong> deteriorating TOT for<br />
developing countlies<br />
We know that there are vast difTerences among developing countries.<br />
Many developing countdes, but certainly noL all, arc hcavily<br />
dependent on the exports <strong>of</strong> one or two commodities for their export<br />
revenue. This is illustrated in Tablc <strong>26</strong>.2.<br />
Benin*<br />
Burkina Faso*<br />
Ethiopiat<br />
Mali*<br />
Angola**<br />
Yemen**<br />
93.8<br />
q3.5<br />
91.0<br />
93.6<br />
99.3<br />
Bangladesht 12.4 8<strong>26</strong><br />
Nepalt 28,0 72.0<br />
95.1<br />
Source: Country Pr<strong>of</strong>iles, WTO<br />
* Non-oi -exporting LDC (least developed countries)<br />
t l\/anufactures exporting LDC<br />
*x Oilexporting LDC<br />
fable <strong>26</strong>.2 Share <strong>of</strong> primary commodities and manufactures in total merchandise<br />
exports for selected LDCS,2008<br />
6.2<br />
6.5<br />
9.0<br />
6.4<br />
0.7<br />
4.9
We see that for the first six countries listed, the dependence on<br />
the export <strong>of</strong> primary commodities, as compared with the export<br />
<strong>of</strong> manufactured products, is very strong. For example, 9).8o/o o!<br />
all Benin's merchandise export earnings come lrom the sale <strong>of</strong><br />
primary commodities. In the same manner, Mali earns 91.6%<br />
<strong>of</strong> its merchandise export earnings by exporting primary<br />
commodities.<br />
Howeve! notice the difference between the first four countries and<br />
the next two, as noted in the key. The first four are known as nonoil-exporting<br />
LDCs, while Angola and Yemen are characterized as oilexporting<br />
LDCs. Almost all o{ the export revenue for Angola and<br />
Yemen comes from the sale <strong>of</strong> oil.<br />
The last two countries, Bangladesh and Nepal, are different again.<br />
They concentrate on the export <strong>of</strong> low-skill manufactured products,<br />
especially textiles.<br />
We can see from Table <strong>26</strong>.3 that there is one more group <strong>of</strong> LDCs that<br />
need to be identified, which are the services-exporting LDCS, such as<br />
Cape Verde and rhe Maldives. These countries make most <strong>of</strong> their<br />
export revenue from tourism.<br />
Source: Country Pr<strong>of</strong>iles, WIO<br />
f Services-exporting LDC<br />
Table <strong>26</strong>.3 Share <strong>of</strong> merchandise trade and services in total exports for selected<br />
LDCS, 2008<br />
The problems facing different groups <strong>of</strong> LDCs come from diflerent<br />
sources. We are currently focusing on the problems facing those<br />
developing countries that are dependent on the export <strong>of</strong> non-oil<br />
commodities, because some <strong>of</strong> the barriers to lheir growth and<br />
development are related to their terms ol trade.<br />
32.5<br />
More than 2 billion people in the developing worldover<br />
one third <strong>of</strong> humanity-make their living from<br />
agricultural commodities.<br />
ln least developed countries (LDCS), one out <strong>of</strong><br />
four people lives and works in a rural area. Most<br />
are small farmers or landless workers.<br />
Eighty{ive developing countries depend on<br />
commodities for more than half their export<br />
earnings. Thirty-eight developing countries depend<br />
on one agricultural product for more than 500/o <strong>of</strong><br />
their export revenues and 48 countries are<br />
dependent on t\ /o agricultural export products.<br />
67.5<br />
<strong>26</strong>. <strong>Terms</strong> ot trua" [!<br />
o ln January 2008, UNCIAD's price index for non-fuel<br />
commodities reached its highest level (in current<br />
dollars) since 1960. The index is up 1090/0 since<br />
1992. Metal and mineral prices rose by 2l7olo<br />
during the same period and agricultural raw<br />
materials prices increased by 67010.<br />
. ln real terms, however, the commodities index is<br />
still low compared with levels attained in the 1970s<br />
and eady I980s.<br />
Source: UNCIAD Press Release, Ceneva, April 2008<br />
323<br />
d<br />
o<br />
rn<br />
q<br />
o<br />
l.
l!!!!<br />
.E o<br />
fi co<br />
I<br />
c<br />
<strong>26</strong> o <strong>Terms</strong> <strong>of</strong> trade<br />
Student workpoint <strong>26</strong>.4<br />
Be an inquirer<br />
Using the following pr<strong>of</strong>ile based on information from<br />
The New Agriculturolisf and, doing a little bit <strong>of</strong> research<br />
on your own, answer the questions that follow.<br />
Focus on Benin<br />
One <strong>of</strong> Africa's<br />
strongest<br />
democracies,<br />
Benin, a country <strong>of</strong><br />
undulating plains<br />
and low mountain<br />
ranges, borders<br />
Nigeria, Niger,<br />
Togo, and Burkina<br />
Faso.<br />
Despite its strong<br />
democratic<br />
example, Benin's<br />
economic situation is less than healthy. Over half <strong>of</strong> the<br />
population rely on subsistence farming for their<br />
livelihood and the poor have not benefited from the<br />
country's legacies as the once-powerful kingdom <strong>of</strong><br />
Dahomey and, more recently, as one <strong>of</strong> Africa's largest<br />
cotton producers.<br />
Benin is heavily dependent upon trade with its<br />
neighbour Nigeria, leaving it vulnerable to that country's<br />
economic volatility. And, although Benin has privatized<br />
some <strong>of</strong> its national industry and encouraged foreign<br />
direct investment, it has recently been ranked among<br />
the poorest countries in the world in the United Nations<br />
Human Development lndex.<br />
The agricultural backbone<br />
Cotton is the only cash crop available to small-scale<br />
farmers, making up 400/0 <strong>of</strong> the country's CDP and over<br />
80o/o <strong>of</strong> export revenues. A consequence is that the<br />
Over half <strong>of</strong> Beninese are subsistence farrners<br />
country's fertile land has suffered environmental<br />
degradation as a result <strong>of</strong> the emphasis on production<br />
<strong>of</strong> cotton for the export market and because 9Oo/o <strong>of</strong> all<br />
pesticides are used on cotton. Heavy use <strong>of</strong><br />
agrochemicals has prompted widespread concern about<br />
the sustainability <strong>of</strong> the industry; this was particularly so<br />
between 1999 and 2000 following reintroduction <strong>of</strong><br />
the pesticide endosulfan, related to the banned DDT,<br />
which led to many farmers'deaths.<br />
The damage to both human health and the<br />
environment has prompted the widespread introduction<br />
<strong>of</strong> orSanic farming methods. Organic farming has almost<br />
doubled since 2003. Organizations, such as the<br />
Pesticide Action Netlvork based in the UK together with<br />
local partner OBEPAB (Organisation Beninoise pour la<br />
Promotion de lAgriculture Biologique), have trained<br />
local farmers-particularly women-in integrated pest<br />
management (lPM) and organic cotton farming through<br />
Farmer Field <strong>School</strong>s. IPM measures aimed at reducing<br />
chemical pesticide use to a minimum include improving<br />
soil fertilit/, recognizing disease, and encouraging<br />
natural enemies.<br />
Benin's export market has expanded to include other<br />
agricultural products. lhe production <strong>of</strong> shea nut butter,<br />
though more popular in Chana, is an activity now<br />
strongly associated with women and reported to be, at<br />
times, a more important source <strong>of</strong> income than cotton.<br />
Shea nuts are a staple in the local diet and their<br />
increasing use in the lucrative cosmetics industry is<br />
promoting interest in the export value <strong>of</strong> shea butter<br />
However, the process <strong>of</strong> making shea butter is laborious<br />
and in some seasons may be unpr<strong>of</strong>itable.<br />
Since the mid-l9B0s Benin has increased production <strong>of</strong><br />
yams, cassava, maize, peanuts, and pulses to achieve<br />
food security. Rice production, particularly <strong>of</strong> upland<br />
varieties Srown on dry land, has been boosted by the<br />
introduction <strong>of</strong> NERICA vadeties by the Africa Rice Center<br />
(VVARDA).'lhe new varieties combine the hardiness <strong>of</strong><br />
indigenous rice with the high yielding characteristics <strong>of</strong><br />
Asian varieties, and they are said to produce 500/0 more<br />
yield than local varieties without fertilizer use and up to<br />
200 more with fertilizer application.<br />
Although palm oil was a major cash crop in Benin during<br />
the l98os, its cultivation was marginalized by the<br />
popularity <strong>of</strong> cotton. But now, following the booming<br />
interest in bi<strong>of</strong>uels, palm oil production is increasingwhich<br />
has caused some controversy. 'The World<br />
Rainforest Movement has reported the allocation <strong>of</strong><br />
Deilveen JUOUOU and 4UUUOU hectares ot land tor<br />
palm oil produdion in humid southern Benin which,<br />
despite constituting only I Oo/o <strong>of</strong> national territory<br />
324 -o
Ht<br />
e is home to 500/0 <strong>of</strong> the country's population. lt says that<br />
such a policy will promote the cultivation <strong>of</strong> palm oil for<br />
bi<strong>of</strong>uel production on prime agricultural land and lead to<br />
competition with food crops.<br />
Rich pickings<br />
Over half <strong>of</strong> Benin's Jorest areas have been cleared or<br />
lost to bush fires. Of the forests that remain, mahogany,<br />
iroko, tea( samba, and other tropical hardwoods are<br />
used to make furniture and gifo for the tourist trade.<br />
Off-shore oil reserves discovered in the l96Os have<br />
been largely exploited and imports now far exceed<br />
exports. Other natural resources include marble and<br />
limestone, together with small deposits <strong>of</strong> gold, but<br />
the mineral industry makes up a small component <strong>of</strong> the<br />
country's CDB mostly due to undeveloped infrastruclure,<br />
lhis lack <strong>of</strong> infrastructure and investment means tha!<br />
despite large reserves <strong>of</strong> natural resources and a historic<br />
and thrivinS cotton industry Benin has been unable to<br />
realize iB economic potential. Only slowly are food<br />
processinS, shrimp, and deep-sea lishing developing as<br />
the private sector takes advantage <strong>of</strong> a new policy<br />
Student workpoint <strong>26</strong>.5<br />
Be an inquirer<br />
Create a table to list five countries that are dependent on a few<br />
(non-oil) commodities for a large proportion <strong>of</strong> their export revenues,<br />
the commodities they produce, and the share <strong>of</strong> export revenues<br />
earned from each <strong>of</strong> the commodities.<br />
There has been a long-run downward trend in commodity prices for<br />
many years caused by a number <strong>of</strong> factors.<br />
o There have been substantial increases in the supply <strong>of</strong><br />
comrnodities, mostly caused by improvements in technology.<br />
For example, there have been huge improvements in<br />
agricultural yields over the last 100 years, caused by better<br />
fertilizers, high degrees oI mechanisation, and scientilic research<br />
into plant disease. Technology has also allowed lor the discovery<br />
<strong>of</strong> more minerals and also for more efficient mineral extraction.<br />
o The discovery <strong>of</strong> synthetic replacements for natural commodities,<br />
such as synthetic rubber, man-made fabrics, and plastics replacing<br />
metals, has contributed to the slow increase in demand for the<br />
natural commodities concerned.<br />
o As developed countries have become richer and incomes have<br />
risen, the demand for commodities has not greatly changed,<br />
because their demand is income inelastic. At the same time, as<br />
ilcomes rise, the demand for manufactured goods and services<br />
has increased. Demand for such goods tends to be more ilcome<br />
elastic. This means that the demand for commodities has not risen<br />
as much as the demand for other products.<br />
introduced by the government in 2001 to encourage<br />
investment. Only time will tell whether this kind <strong>of</strong><br />
investment can lift one <strong>of</strong> the world's poorest, yet<br />
resource-rich, countries in the world out <strong>of</strong> poverty.<br />
<strong>26</strong> . <strong>Terms</strong> <strong>of</strong> trade f<br />
Soutcei New Agriculturist, vvww.new-ag.info/country/pr<strong>of</strong>ile.<br />
php?a:389<br />
I Using a negative externalities <strong>of</strong> production diagram,<br />
explain why the production <strong>of</strong> cotton may be a<br />
market failure in Benin. Use the term "sustainabiliy<br />
in your written explanation.<br />
2 Research the extent to which shea butter has<br />
become an internationally traded commodity. What<br />
are the advaniages and disadvantages <strong>of</strong> producing<br />
this product for export?<br />
5 Using a PPC diagram, explain the re-allocation <strong>of</strong><br />
resources involved in producing palm oil rather than<br />
food crops. Vvhat are the possible consequences <strong>of</strong> this?<br />
4 How do you think a lack <strong>of</strong> infrastructure prevents<br />
Benin from achieving its economic potential?
!!!!<br />
<strong>26</strong> . <strong>Terms</strong> <strong>of</strong> trade<br />
Agricultural policies in developed countries have had a<br />
damaging effect on world agricultural markets. Price support<br />
schemes in the EU and the US, for example, have led to<br />
relatively high prices there and over-production by domestic<br />
producers. These subsidies have also led to over-production.<br />
The over-production is then sold on the world markets, pushing<br />
down agricultural prices. For these reasons, developing<br />
countries <strong>of</strong>ten accuse the developed economies <strong>of</strong> "dumping"<br />
agricultural products on the world market and so ruining their<br />
own agricultural industries.<br />
With huge leaps in technology over the last 50 years, many<br />
products have become smaller. For example, computers that once<br />
took up a whole room are now replaced by laptop computers <strong>of</strong><br />
the same power; large tape recorders, the size <strong>of</strong> a suitcase, are<br />
now replaced by MP3 players the size <strong>of</strong> a cigarette lighter; and<br />
televisions, which were once housed in large cabinets, are now<br />
replaced by flat screens that require no such housing. This<br />
rniniaturisation <strong>of</strong> many products and the improvement in<br />
plastics technology has led to a fall in the demand for the<br />
commodities that were traditionally used to make and package<br />
these products.<br />
The effect <strong>of</strong> the above factors on the average price <strong>of</strong> commodities<br />
over time is shovrm in Figure <strong>26</strong>.3.<br />
We would not want to imply that there has been a fall in demand<br />
for commodities. However, the combination <strong>of</strong> low income elasticity<br />
<strong>of</strong> demand, the increased use <strong>of</strong> synthetic substitutes, and<br />
miniaturisation have led to relatively small increases in demand,<br />
shown as a in Figure <strong>26</strong>.3. Improvements in technology along with<br />
the agricultural policies in more developed countries have resulted<br />
in large increases in supply, showr as b in Figue <strong>26</strong>.). The result is<br />
that average commodity prices have fallen. This is highlighted in<br />
Figre <strong>26</strong>.4.<br />
Given that the TOT index is based on a weighted average <strong>of</strong> export<br />
prices, those countries that are dependent on commodities will see a<br />
fall in the index <strong>of</strong> their export prices and deterioration in their terms<br />
<strong>of</strong> trade.<br />
The deterioration in their TOT resr ts in depreciating current account<br />
deficits. This is because the demand for commodities tends to be<br />
inelastic. For example, although the dernand for copper from Zambia<br />
is likely to be elastic as there are alternative sources <strong>of</strong> copper,<br />
demand for copper as a whole is inelastic as it is a necessary mineral<br />
in production with few substitutes. This can be said about most<br />
commodities. If you refer back to the revenue box diagram you drew<br />
in workpoint <strong>26</strong>.2, you will see that the fall in average export prices<br />
when demand is inelastic results in a fall in expon revenues.<br />
We should also look at the eIlect on imports. with falling export<br />
prices, the price <strong>of</strong> imports has risen relative to the price <strong>of</strong> erT)orts.<br />
The goods that developing countries need to import are necessities<br />
such as raw materials, components, and other capital goods. Because<br />
these are not available domestically and are required for economic<br />
.9<br />
E<br />
E<br />
0Qa,<br />
Quanlity <strong>of</strong> commodities<br />
FiBure <strong>26</strong>.3 Falling world commodity<br />
prices<br />
lndexr 1995:loo<br />
25O r<br />
200<br />
r50<br />
100<br />
50+<br />
ti1ure <strong>26</strong>.4 Falling commodity prices<br />
a: synthetics ar,miniatuisation<br />
b = lmprovin8<br />
technology and<br />
proteclionism
growth, demand for them is lnelastic. I1 you look back to Lhe revenue<br />
box diagram you drew in workpoint <strong>26</strong>.1, you will see that a risc in<br />
import prices when demand for import is inelastic results in an<br />
incrcase in import erpen d itu re.<br />
The delerioration in the TOT lor developing counfies that depend on<br />
commodities has several harmlul consequences.<br />
r Developing countries have to scll more and more exports in order<br />
to buy the same amount <strong>of</strong> imports. This is harmful enough, but<br />
in order to do this the developing countries then increase supply<br />
and this tends to push commodity priccs down cven more. We<br />
have a vicious circlc.<br />
o Many dcvcloping countries have high levels <strong>of</strong> indebtedness.<br />
Falling export prices and thus export revenue make it harder to<br />
service their debt. Indeed, in extreme cases, this leads Lo countries<br />
having to increase their borrowing and increasing their levels <strong>of</strong><br />
indebtedness. This vicious circlc llnks to Lhe previous one. In<br />
order to pay back their debts, many countries have to increase<br />
Lheir output <strong>of</strong> the commodities in which they have a<br />
comparatjve advantage. This increases the supply and drives the<br />
prices down.<br />
. In order to increase Lhe supply oI commodities and gain more<br />
export revenue, some developing countries have ovcrused thcir<br />
resources. rcsulting in negative externalities such as land<br />
defaradaLion, dcsertification, soil erosion, and massive<br />
delorestation. This is clearly not sustainable in the long run.<br />
While there is no doubt that the long-run trend in commodity prices<br />
has been downward over the last 50 years, there has bccn a short-run<br />
upward movement in thc last few years, showr in Table <strong>26</strong>.4.<br />
2000<br />
2001<br />
2002<br />
2003<br />
20Q4<br />
5J,5<br />
58.3<br />
58,3<br />
65.0<br />
80.5<br />
200s 100.0<br />
2006 120J<br />
2001 135.0<br />
2008 172.1<br />
2009 118.8<br />
2010* l4t J<br />
* Quarter I figures only<br />
source: lnternatlonal ]\,4onetary Fund<br />
52.9<br />
45.6<br />
46.8<br />
54.2<br />
70.8<br />
r00.0<br />
120.5<br />
r33.3<br />
18t.9<br />
115.8<br />
144.4<br />
79.6<br />
75.8<br />
77.3<br />
8r.8<br />
oAz<br />
r00.0<br />
123.2<br />
140.6<br />
151.0<br />
122J<br />
r39.9<br />
81.5<br />
79.0<br />
83.2<br />
88.3<br />
99.4<br />
r00.0<br />
110.3<br />
1<strong>26</strong>.9<br />
156.5<br />
136.0<br />
143.O<br />
<strong>26</strong> e <strong>Terms</strong> <strong>of</strong> t,ua. @<br />
Iable <strong>26</strong>.4 Real primary commodity prices, 2000 l0 327<br />
98,6<br />
95.2<br />
95.0<br />
9s.6<br />
99,5<br />
r00.0<br />
108.8<br />
114.2<br />
I13.3<br />
94.r<br />
lt5.t<br />
62.7<br />
56.3<br />
54.3<br />
60.7<br />
8tJ<br />
100.0<br />
156.2<br />
183.3<br />
168.7<br />
124.4<br />
152.3<br />
11.7<br />
12.6<br />
71.4<br />
15.3<br />
89.2<br />
100.0<br />
136.3<br />
154.3<br />
145.5<br />
109.4<br />
136J<br />
o<br />
9l<br />
3.
!!!!<br />
o<br />
ilJ.<br />
E<br />
o_<br />
f,l<br />
54g]<br />
<strong>26</strong> . <strong>Terms</strong> <strong>of</strong> rrade<br />
From 1995 to 2001, there had been a fall in the index <strong>of</strong> all the<br />
primary commodities indices itemized in Table <strong>26</strong>.4, with the<br />
exception <strong>of</strong> petroleum.<br />
From 2002 to 2008, there was a significant increase in the index<br />
oI all primary commodities (column t). Breaking the index into<br />
different categories <strong>of</strong> commodities, we see that this was the case<br />
for all categories, with the exception <strong>of</strong> agricultural raw mat€rials,<br />
metals, and petroleum, which peaked in 2007 and fell in 2008.<br />
There were two main reasons for this rise in commodity prices.<br />
First, China joining the WTO at the end <strong>of</strong> 2001 and the expansion<br />
<strong>of</strong> the Indian economy led to a massive increase in demand for<br />
commodities <strong>of</strong> all sorts. Second, the increased demand for<br />
alternative luels (bio-fuels) led to large increases in demand for<br />
many agricultural products.<br />
The global economic crisis, sparked by the sub-prime m<strong>of</strong>tgage crisis<br />
in the USA, began to take effect in 2008 and this can be seen by the<br />
subsequent fall in the indlces for all <strong>of</strong> the commodity categories in<br />
2009. Howevet by the firsr quarter <strong>of</strong> 2010, prices were once again<br />
on the up.<br />
Whatever the reasons, the increased commodity prices may give<br />
some short-term help to commodity-exp<strong>of</strong>ting developing countries,<br />
although whether the commodity pdce increases will be sustained in<br />
the long run is uncertain. Many economists are predicting a second<br />
global economic crisis, suggesting 2oI3 as the most likely date.<br />
(Depending upon the date that you bought this book, you may know<br />
whether this prediction was true!)<br />
The data also illustrates another problem for commodity-exporting<br />
developing countries. Commodity prices tend to be quite volatile.<br />
As a result, such countries are quite vulnerable to circumstances<br />
beyond their control. The fact that export revenues can fluctuate<br />
significantly can make it diflicult for governments to plan effectively<br />
for the future.<br />
At the outset, we emphasized that not all developing countries are the<br />
same, and we have locused on the problem facing countries that<br />
depend on commodities. If we look back at Table <strong>26</strong>.2, we can also<br />
make a link between deteriorating TOT and another group <strong>of</strong><br />
developing countries-the countries that are classiJied as manufacturesexporting<br />
LDCs, such as Bangladesh and Nepal. Both <strong>of</strong> these counfties<br />
depend heavily for their export revenues on the export <strong>of</strong> low-skill<br />
produced textiles, the prices <strong>of</strong> which are also dropping. Thus these<br />
countries also experience deteriorating terms <strong>of</strong> trade.<br />
If we turn to one more group <strong>of</strong> developing countries-the oil<br />
exporters-we may assume that they have benefited from rising<br />
petroleum priccs. Given the fact that demand Ior oil and petrolcum is<br />
inelastic, we can conclude that their expo revenues will have<br />
increased. whether or not this has been translated into economic<br />
development is quite a different issue.
Be a critical thinker<br />
II you are writing about developing countries, you need to show critical<br />
awareness by noting that you are aware oI the differences that exist<br />
among them. It would be an error to discuss all developing countries as<br />
though they were a group <strong>of</strong> countries that shared identical<br />
characteristics. This should become clearer in the following chapters.<br />
<strong>26</strong>. <strong>Terms</strong> <strong>of</strong> trade llIE<br />
7E<br />
d<br />
3<br />
o<br />
sl-<br />
8<br />
o<br />
3,.