AP Econ Module 41 Capital Flows Balance Payments - Sunny Hills ...
AP Econ Module 41 Capital Flows Balance Payments - Sunny Hills ...
AP Econ Module 41 Capital Flows Balance Payments - Sunny Hills ...

Create successful ePaper yourself
Turn your PDF publications into a flip-book with our unique Google optimized e-Paper software.
<strong>Module</strong> <strong>41</strong> <strong>Capital</strong> <strong>Flows</strong> and the <strong>Balance</strong><br />
of <strong>Payments</strong><br />
<strong>Module</strong> 42 The Foreign Exchange Market<br />
<strong>Module</strong> 43 Exchange Rate Policy<br />
<strong>Module</strong> 44 Exchange Rates and<br />
Macroeconomic Policy<br />
<strong>Module</strong> 45 Putting ltAllTogether<br />
<strong>Econ</strong>omics by Example:<br />
"ls Globalization a Bad Word?"<br />
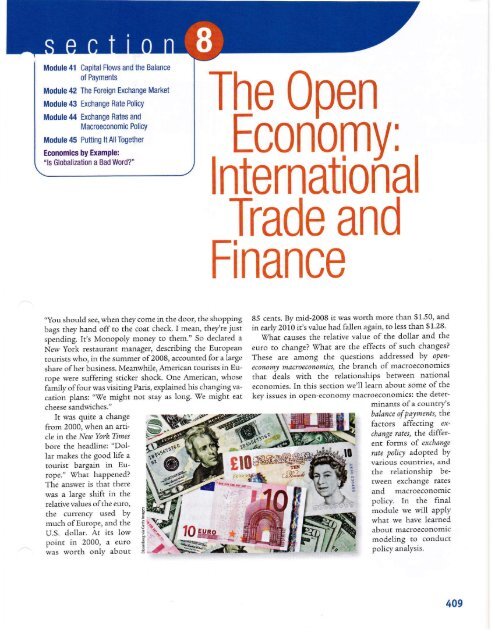
"You should see, when they come in che door, the shopping<br />
bags they hand off to the coat check. I mean, they're just<br />
spending. ICs Monopoly money to them." So declared a<br />
New York restaurant manager, describing the European<br />
tourists who, in the summer of2008, accounted for a large<br />
share ofher business. Meanwhile, American tourists in Europe<br />
were suffering sticker shock. One American, whose<br />
family of four was visicing Paris, explained his changing vacation<br />
plans: "We might not stay as long. We might eat<br />
cheese sandwiches."<br />
It was quite a change<br />
from 2000, when an article<br />
tn the New Yorh Tirnes<br />
bore the headline: "Dollar<br />
makes the good life a<br />
tourist bargain in Europe."<br />
What happened?<br />
The answer is that there<br />
was a large shift in the<br />
relative values ofthe euro,<br />
rhe currency used by<br />
much ofEurope, and the<br />
U.S. dollar. At its low<br />
point in 2000, a euro<br />
was worth only about<br />
g<br />
a<br />
The 0oen<br />
<strong>Econ</strong>omv:<br />
lnternational<br />
Trade and<br />
Finance<br />
85 cents. By mid-2008 it was worth more than $1.50, and<br />
in eady 2010 iCs value had fallen again, to less than $1-28.<br />
'ff/hat causes the relative value of the dollar and the<br />
euro to change? What are the effects of such changes?<br />
These are among the questions addtessed, by open'<br />
econom! tnacroeconomics, the branch of macroeconomics<br />
that deals with the relationships between national<br />
economies. In this section we'll learn about some of the<br />
key issues in open-economy macroeconomics: the determinants<br />
ofa countrY's<br />
bdlance of pd)ments, the<br />
factors affecting excbange<br />
rates, the different<br />
forms of exchonge<br />
rd,te policf adoPted bY<br />
various countries, and<br />
rhe relationship between<br />
exchange rates<br />
and macroeconomic<br />
policy. In the final<br />
module we will apply<br />
what we have learned<br />
about macroeconomic<br />
modeling to conduct<br />
policy analysis.<br />
409
g<br />
:<br />
The meaning of the balance<br />
of payments accounts<br />
The determinants of<br />
international capital fl ows<br />
A country's balance ot paymenls<br />
accounts are a summary ofthe counlry,s<br />
transactions wilh other countries.<br />
--<br />
, ,-<br />
<strong>Module</strong> @<br />
<strong>Capital</strong> fTo*s and the<br />
<strong>Balance</strong> of <strong>Payments</strong><br />
<strong>Capital</strong> <strong>Flows</strong> and the <strong>Balance</strong> of payments<br />
In 2008, people liviirg in the United Srares sold about $3.5 trillion worth of stuff to<br />
people living in other countries and bought about 93.5 trillion worth of sruffin return.<br />
What kind of stuff.r Atl kinds. Residents ofthe United States (including employees of<br />
firms operating in rhe United States) sold airplanes, bonds, wheat, and many orher<br />
items to residenrs of other countries. Residents of the United States bought cars,<br />
stocks, oil, ald many other items from residents ofother counries.<br />
How can we keep uack of these transacrions? Earlier we learned that economists<br />
keep rack ofthe domestic economy using the national income and. product accounts.<br />
<strong>Econ</strong>omists keep track ofinrernational ransactions using a differeni but relared set of<br />
numbers, the ba)ance ofpa)men6 dccottnts-<br />
<strong>Balance</strong> of <strong>Payments</strong> Accounts<br />
A country's bal,ance of payments accounts are a surnmary of the country,s transactions<br />
with other counrries.<br />
To understand the basic idea behind the balance of payrnenrs accountsJ let's con_<br />
srder a small-scale example: not a country,but a. family fatm. Let,s say that we know che<br />
following about how last year went financially for ti-re Costas, who own a small arti_<br />
choke farm in California:<br />
r They made $ 100,000 by selling arrichokes.<br />
r They spent $70,000 on running the farm, including purchases ofnew farm machin-<br />
ery. and another 940,000 buying food, palng uriliry bills for their home, replacing<br />
their worn-out car, and so on.<br />
r They received $500 in interest on rheir bank account but paid $ 10,000 in interesr on<br />
their morrgage.<br />
r They rook out a new $25,000 loan to help pay for farm improvements bur didn,c use<br />
all the money immediately. So rhey put the extra in the bank.<br />
4!0 section I The Open <strong>Econ</strong>omy: lnternationil Trade and Finance
EETililI<br />
The Costas' Financial Year<br />
Purchases or sales<br />
of goods and services<br />
lntorest payments<br />
Loans and deposib<br />
Sources of cash t ses of cash Net<br />
Artichoke sales:<br />
$100,000<br />
lnterest received on<br />
bank account $500<br />
Funds received from<br />
new loan:$25,000<br />
Farm operation and<br />
livinq expens€s: $1 10,000<br />
lnterest paid on<br />
mortgage:$10,000<br />
Funds deposited in<br />
bank $5,500<br />
Total $125,500 $125,500<br />
-$10,000<br />
-$9,500<br />
+$19,500<br />
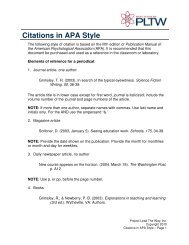
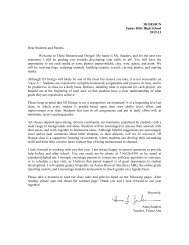
How could we summarize the Costas' yeat? One way would be with a table like Table<br />
<strong>41</strong>.1, which shows sources of cash coming in and money going out, characterized<br />
under a few broad headings. The first row ofTable <strong>41</strong>.1 shows sales and purchases of<br />
goods and services: sales ofartichokes; purchases ofgroceries, heating oil, that new car,<br />
ald so on. The second row shows interest payments; the interest the Costas received<br />
from their bank account and the inter€st they paid on their mortgage. The third row<br />
shows cash coming in from new borrowing versus money deposited in the balt.<br />
In each row we show the net inflow ofcash from that rype oftransaction. So the net<br />
in the first row is -$10,000 because the Costas sPent $10,000 more than they earned'<br />
The net in the second row is -$9,500, the difference between the interest che Costas received<br />
on their bank account and the interesr they Paid on the mortgage. The net in the<br />
third row is $19,500: the Costas brought in $25,000 udth their new loan but put only<br />
$5,500 ofthat sum in the bank.<br />
The last row shows the sum of cash coming in from all sources and the sum of all<br />
cash used. These sums are equal, by definition: every dollar has a soutce, and every dollar<br />
received gets used somewhere. (What if the Costas hid money under the mattress?<br />
Then that would be counted as another "use" ofcash.)<br />
A country's balance of palT nents accounts summarize its cransactions with the<br />
world using a table similar to the one we just used to summarize the Costas' financial<br />
year.<br />
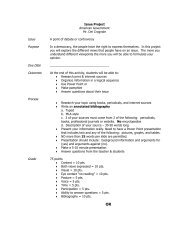
'fable 4I.2 on the next page shows a simplified version of the U.S. balance of paymenrs<br />
accounts for 2008. 'rX4rere rhe Costa family's accounts show sources and uses of<br />
cash, the balalce of payments accounts show <strong>Payments</strong> from foreigners-in effect,<br />
sources ofcash for the United States as a whole-and payments to foreigners.<br />
Row 1 of Table <strong>41</strong>.2 shows payrnents that arise from sales and purchases ofgoods<br />
and services. For example, the value of U.S. wheat exports and the fees foreigners Pay to<br />
U.S. consulting companies appear in the second column ofrow 1; the value of U.S. oil<br />
imports and the fees American companies pay to Indian call centers-the people who<br />
often answer your 1-800 calls-appear in the third column ofrow 1.<br />
Row 2 showspcfor income-peyrtents for the use offactors ofproduction owned by<br />
residents of other countries. Mostly this means investment income: interest paid on<br />
loans from overseas, the profits of foreign-owned corporations, and so on. For example,<br />
the profits eamed by Disneyland Paris, which is owned by the U.S.-based Walt Disney<br />
Company, appear in the second column of row 2; the profits earned by the U.S.<br />
operations ofJapanese auto comPanies appear in the third column. Factor incorne also<br />
includes labor income. For example, the wages of an American engineer who works<br />
temporarily on a construction site in Dubai are counted in the second column ofrow 2.<br />
Row 3 shows internationdl transfers-funds sent by residents of one counrry to<br />
residents of another, The main element here is the remittances that immigrants,<br />
such as the millions of Mexican-born workers employed in the United Scates,<br />
$o<br />
m 0 d u le 4 l capital <strong>Flows</strong> and the <strong>Balance</strong> of <strong>Payments</strong> 477
A country's balance 0l paymenls on lhe<br />
currenl accounl,0r lhe curlent account,<br />
is its balance 0f payments 0n goods and<br />
services plus net intemational transfer<br />
payments and factor lncome.<br />
A counlry's balance ol payments on<br />
goods and seruices is the ditterence<br />
between its exports and its impons during a<br />
given period.<br />
The merchandise trade balance, or<br />
trade balance, is the difference between a<br />
country's exports and imp0rts 0f goods,<br />
The U.S. <strong>Balance</strong> of <strong>Payments</strong> in 2mB (billions of dollars)<br />
2<br />
3<br />
Sales and purchases<br />
ot goods and services<br />
Factor income<br />
Transf€rs<br />
Cunent account<br />
(1 +2+3)<br />
olficial asset sales<br />
and purchases<br />
Private sales and<br />
purchasss of assets<br />
Financial account<br />
(4+5)<br />
Total<br />
Source, Bureau of Eoonomic Analysis.<br />
<strong>Payments</strong> from<br />
loreigners<br />
$1,827<br />
765<br />
487<br />
47<br />
<strong>Payments</strong> to<br />
loreigners Net<br />
$2,523<br />
b4b<br />
-534<br />
-$696<br />
119<br />
-128<br />
-705<br />
_43<br />
581<br />
538<br />
-167<br />
send to their families in their country oforigin. Notice that Table <strong>41</strong>.2 shows only the net<br />
value of ffansfers. ThaCs because the U.S. government provides only an estimate ofthe<br />
neg not a breakdown between payments to foreigners and pal,rnents from foreigners.<br />
The next two rows ofTable <strong>41</strong>.2 show payments resulting fiom sales and purchases<br />
ofassets, broken down by who is doing the buying and selling. Row 4 shows rransactions<br />
that involve governments or government agencies, mainly central banks. As we,ll<br />
leam later, in 2008, most ofthe U.S. sales in this caregory involved the accumulation of<br />
foreign exchange ruenu by the central banks ofChina and oil-expocing counries. Row 5<br />
shows private sales and purchases of assets. For example, the 2008 purchase of Budweiser,<br />
an American brewing company, by rhe Belgian corporation InBev showed up in<br />
the second column ofrow 5; purchases ofEuropean stocks by U.S. invesrors show up as<br />
positive values in the third column. However, because U.S. residents sold more foreign<br />
assets than they purchased in 2008, rhe value for this category is negarive.<br />
In laying out Table <strong>41</strong>,2, wehave separared rows 1, 2, and 3 into one group and rows<br />
4 and 5 into another. This reflects a fundamenral difference in how these two groups of<br />
transactions affect the future.<br />
Vtren a U.S. residenr sells a good, such as wheat, to a foreigner, thaCs the end ofthe<br />
transaction. But a financial assetr such as a bon4 is different. Remember, a bond is a<br />
promise to pay interesr and principal in the future. So when a U.S. resident sells a bond<br />
to a foreigner, that sale creates a liability: the U.S. resident will have to pay interest and<br />
repay principal in the future. The balance of payments accounts distinguish berween<br />
transactions that don't create liabilities and those that do.<br />
Transactions that don't create liabilities are considered part ofthe balance ofpayments<br />
on the cutrerlt account, often referred to simply as the cufrerlt accoune the<br />
balance of payments on goods and services plus factor income and net international<br />
transfer payments. The balance of row 1 ofTable <strong>41</strong>.2, -9696 billion, coresponds to<br />
the most important part ofthe currenr account: the balance ofpapnents on goods<br />
and services, the difference between the value ofexports and che value ofimporrs during<br />
a given period.<br />
By the way, ifyou read news reports on rhe economy, you may well see references to<br />
another measureJ the merchandise tmde balance, sometimes referred to as the trade<br />
balance for short. This is rhe difference between a councy's exports and imports of<br />
<strong>41</strong>2 section 8 The Open <strong>Econ</strong>omy: lnternational Trade and Finance
goods alone-not including services. <strong>Econ</strong>omists sometimes focus on the merchandise<br />
trade balance, even though iCs an incomplete measure, because data on international<br />
trade in services aren't as accurate as data on trade in physical goods, and they are also<br />
slower to arrive.<br />
The current account) as we've just learned, consists of intemational transactions<br />
rhat dorit create liabilities, Transactions that involve the sale or purchase ofassets, and<br />
therefore do create future liabilities, are considered part of the balance ofpayrnents<br />
on the financial account, or the financial account for short. (Until a few years ago,<br />
economis* often referred to the financid account as tt.e cdPital &co&nt. We'Il use the<br />
modern term, but you may run ac(oss ahe older term.)<br />
So how does it all add up? The shaded rows ofTable <strong>41</strong>.2 show the bottom lines: the<br />
overall U.S. cur:rent account and financial account for 2008. As you can see, in 2008,<br />
the United States ran a cuffent account deficit: the amount it paid to foreigners for<br />
goods, services, factors, and transfers was greacer than the amount it received' Simultaneously,<br />
it ran a financial account surplus: the va.lue ofthe assets it sold to foreigners<br />
was greater than the value ofthe assets it bought from foreigners.<br />
In rhe official data, the U.S. current account deficit and financial account surplus<br />
almost, but not quite, offset each other: the financial account surplus was $167 billion<br />
smaller than the current account deficit. But that's just a statistical error, reflecting<br />
the imperfecdon of official data. (And a $167 billion error when you're<br />
measuring inflows and outflows of$3.5 trillion isn't badl) In fact, it's a basic rule of<br />
balance of payrnents accounting that the current account and the financial account<br />
must sum to zero:<br />
of<br />
(<strong>41</strong>-1) Current account (C.r{) + Financial account (IA) = 0<br />
C.4 = -FA<br />
Why must Equation <strong>41</strong>-1 be true? We already saw the fundamental explanation in<br />
Table 47.1, which showed the accounts of the Costa family: in total, the sources of<br />
cash must equal the uses ofcash. The same applies to balance ofpayments accounts.<br />
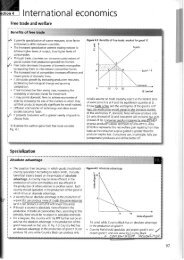
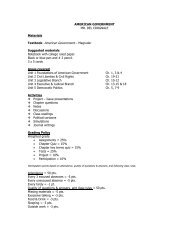
Figure <strong>41</strong>.1 on the next page, a varianr on the circular-flow diagram we have found<br />
o""fr.I i.t discussing domestic macroeconomics, may help you visualize how this<br />
adding up works.<br />
Insiead ofshowing the flow ofmoney aitbin anationa\ economy, Figure <strong>41</strong>.1 shows<br />
the flow of money between nrtiond economies Money flows into the United States<br />
from the rest ofthe world as Paym€nt for U.S. exports ofgoods and services, as payment<br />
for the use of U,S.-owned factors ofproduction, and<br />
as ransfer pay'rnents. These flows (indicated by the lower<br />
green arrow) are the Positive comPonents of the U.S. current<br />
account. Money also flows into the United States<br />
from foreigners who purchase U.S. assets (as shown by the<br />
lower red arrow)-the positive component of rhe U.S. financial<br />
account.<br />
At the same time, money flows frorn the United States to<br />
the rest ofthe world as payment for U.S. imports ofgoods<br />
and services, as paymenc for the use of foreign-owned factors<br />
of production, and as transfer papnents. These flows,<br />
indicated by the upPer green alrowJ a(e the negative comPonents<br />
of the U,S, current account. Money a.lso flows from<br />
the United States to purchase foreign assets, as shown by<br />
the upper red arrow-the negative comPonent ofche U.S. financial<br />
account. As in all circular-flow diagrams, the flow<br />
into a box and the flow out ofa box are equal. This means<br />
A country's balance ol payments<br />
on the linancial account, orsimply<br />
the linancial account, is the difference<br />
between its sales of assets to<br />
foreigners and its purchases of assets<br />
from foreigners during a given period.<br />
m 0 d u le <strong>41</strong> capital <strong>Flows</strong> and the <strong>Balance</strong> ol <strong>Payments</strong> 473
The <strong>Balance</strong> ot <strong>Payments</strong><br />
'lhe Oreen anows reprcsent paymenb hat are<br />
counted in fie current account lhe red arows<br />
rspresefi payments tiat are counted ln the financial<br />
accounl B€cause he tobl flow inh<br />
the United States must equat the totatflow out<br />
of the United Shtes, the sum of the current ac-<br />
count plusthe financlal account is zero.<br />
GDB GNB and the Current Account<br />
When we discussed national income account-<br />
ing, we derived the basic equation relating GDp<br />
b the componenh of spending:<br />
f=C+l+G+X-lM<br />
whem Xand /irare exporb and impoft, respec-<br />
Wely, 0f goods and seMces. But as we've<br />
learned, he balance of paymenb on goods and<br />
services ls only one mmponent of the curert ac-<br />
count balance. Wtry doesn't the nauonal income<br />
equalion use the curTert accourt as a whole?<br />
Ihe answer is fiat grcss domsstic prcduct,<br />
whlch is he value 0l gsods and services pro-<br />
ducd in a county, doesn't incll.de lwo sources ot<br />
income that are induded in calculatng fie curent<br />
account balan@: intemational hclor income and<br />
intemationa, tansfors. The profb ot Ford Motorc<br />
Paymenb to the rest of the wortd for assets<br />
<strong>Payments</strong> to the rest of the wortd for qoods<br />
and services, factor incomg and tnnifers<br />
that thesum ofthe red and green arrows going into the United States is equal to the<br />
sum ofthe red and green arrows going out ofthe United States. That is,<br />
(<strong>41</strong>-2) Positive entries on the current account (lower green arrow) + positive<br />
entries on the financial account (lower red arrow) = Negadyg snsds5<br />
on the current account (upper green arrow) + Negative entries on the<br />
financial account (upper red arrow)<br />
Equation <strong>41</strong>-2 can be rearanged as follows:<br />
(<strong>41</strong>-3) Positive entries on the currena account - Negative entries on the current<br />
account + Posirive entries on rhe financial account _ Negative entries on<br />
the financial accounr = O<br />
U.K. aren't included in Amedca's GDB and fts<br />
funds Lalin Amedcan immigraab send home h<br />
heir lamilies arenl subfacbd tom GDp<br />
Shouldnt we have a broader measure that<br />
does include fiese sourcos of inmme? Actually,<br />
gross national product-GNP-does include in-<br />
temauonaltachr income. Estimates of U.S. GNp<br />
dtfter slightly from estimates of cDp becaus€<br />
GNP adds in items such asfte eamings of U.S.<br />
companies abroad and subtracb it€ms such as<br />
the interest payments on bonds ownod by resi-<br />
denb oi Chlna and Japan. There lsn't, however,<br />
any regulady calculated measure fiat lnclud8s<br />
transter paymenb.<br />
Wry do economisb use GDP mfier fmn a<br />
broader measure? Two reasons. First, ttrc original<br />
putpose of tlE nadonal accounb was b tack<br />
474 section I The Open <strong>Econ</strong>omy: International Trade and Finance<br />
The funds Latin Amedcan immi$antssend hone<br />
through Western Unlon vr,ires, as advertised on<br />
this billboard, aren'tsubtraded from GDp.<br />
prcduclion rafier than lncome. Second, dah on<br />
inbmafroEl fachr income and tans,fer paymenb<br />
are generally considered sornaMEt unreliable. So<br />
if you'rc Uyino h keep tack ot movemenb in tE<br />
eclnomy, it makes sense b focus on GDe whidl<br />
doesn't rely on hese unreliable dah.<br />
f,
Equation <strong>41</strong>-3 is equivalent to Equation <strong>41</strong>-1: the current account plus the financial<br />
account-both equal to positive entries minus negarive enrries-is equal to zero.<br />
But what determines the current account and the financial account?<br />
Modeling the Financial Account<br />
A country's financial account measures its net sa.les ofassets, such as currencies, securi-<br />
ties, and Factories, to foreigners. Those assets are exchanged for a qpe ofcapital called<br />
fnancial capital, which is funds from savings that are available for investmenr spending.<br />
'We can thus thinl< ofthe financial account as a mea.sure of capiwlinfloas in the form of<br />
foreign savings that become available to finance domestic investment spending.<br />
What determines these capital inflows?<br />
Part ofour explanation will have to wait for a little while because some internarional<br />
capital flows are created by govemments and central banks, which somecimes act very<br />
differendy from private investors. But we can gain insight into the motivations for capital<br />
flows that are the result of private decisions by using rh e loanablc funds rnodel we developed<br />
previously. In using this model, we make two important simplifications:<br />
r Ve simplify the reality ofinternational capital flows by assuming that all flows are<br />
in the form ofloans. In reality, capital flows take many forms, including purchases<br />
of shares of stock in foreign companies and foreign real esttte as well as foreign direct<br />
investment, in which companies build factories or acquire other productive assets<br />
abroad.<br />
r We also ignore the effects ofexpected, changes in exchange ra,tet the relative values<br />
of different national currencies. We'll analyze the determination of exchange<br />
rates later.<br />
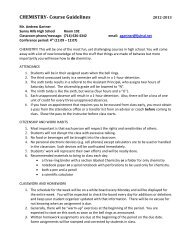
Figure <strong>41</strong>.2 recaps the loanable funds model for a closed economy. Equilibrium corresponds<br />
to point 4 at an interest rate of4%, at which the supply ofloanable funds (S)<br />
intersects the demand (D). If intemational capital flows are possible, this diagram<br />
changes and E may no longer be the equilibrium. We can anaJyze the causes and effects<br />
of intemational capital flows using Figure <strong>41</strong>.3 on the next page, which places the<br />
loanable funds market diagrams for two counries side by side.<br />
Figure 4L3 illustrates a world consisting ofonly two countries, the United States<br />
and Britain. Panel (a) shows the loanable funds market in the United States, where<br />
The Loanable Funds Model<br />
Revisited<br />
According to tie loanabl8 tunds modolofthe in-<br />
terest rate, ft€ squilibrium interest rate is determlnod<br />
by fie intersection of the supply ol<br />
loanable funds curve, S, and the demand tor<br />
loanable funds curve, AAt point E the equilib-<br />
rium interest rah is 4%.<br />
Quantity of loanable funds<br />
module <strong>41</strong> <strong>Capital</strong> <strong>Flows</strong> and the <strong>Balance</strong> of <strong>Payments</strong> 475
476 section 8<br />
(a) United States<br />
Loanable Funds Markets in Two Countries<br />
Quantity of loanable funds<br />
Here we show two countries, the Unlted Shtes and Britain,<br />
each with its own loanable funds market. The equilibrium in-<br />
tersst rate is 6% in the U.S. market but only 2% in the British<br />
0 ouantity of Loanable f<br />
markel lhis creates an incentive for capihl b flor/v from<br />
Britain to the united States.<br />
(b) Brltaln<br />
ouantity of loanable funds<br />
the equilibrium in the absence of international capital flows is at point Ep.s with an<br />
interest rate of 6%. Panel (b) shows the loanable funds market in Britain, where the<br />
equilibrium in the absence ofinternational capital flows is at point Es with an interest<br />
rate of 2'k.<br />
Vill the actual interest rate in the United States remain at 6% and that in Britain<br />
at 2%? Not if it is easy for British residents to make loans to Americans. In that case,<br />
British lenders, attracted by high American interest rates, will send some of their<br />
loanable funds to the United States. This capital inflow will increase the quandty ofloanable<br />
funds supplied to American borrowers, pushing the U.S. interest rate down. At<br />
the same time, it will reduce the quantity of loanable funds suppJied to British borrowers,<br />
pushing the British interest rate up. So international capital flows will narrow<br />
the gap between U.S. and British interest rates.<br />
Ler's further suppose that British lenders regard a loan to an Americal as being<br />
just as good as a loan to one oftheir own compattiots, and American borrowers regard<br />
a debt to a British lender as no more cosdy tharr a debt to an American lender. In that<br />
case, the flow of funds from Britain to the United Sates will continue until the gap<br />
between their interest rates is eliminated. In other words, international capital flows<br />
will equalize the interest rates in the two countries. Figure <strong>41</strong>.4 shows an international<br />
equilibrium in the loanable funds markets where the equilibrium interest rare is 4% in<br />
both the United States and Brirain. At this interest rate, the quandry of loanable<br />
funds demanded by American borrowers exceeds the quantity of loanable funds supplied<br />
by American lenders. This gap is filled by "imported" funds-a capital inflow<br />
from Britain. At the same time, the quantity of loanable funds supplied by British<br />
lenders is greater than the quantity ofloanable funds demanded by British borrowers.<br />
This excess is "exported" in the form ofa capital outflow to the United States, And the<br />
two markets are in equilibrium at a common interest rate of4%, At thar interest rate,<br />
the total quantity ofloans demaaded by borowers arross the wo markets is equal to the<br />
total quantity ofloans supplied by lenders across the rwo markets.<br />
In shott, international flows of capital are like international flows of goods and<br />
services. Capita-l moves from places where it would be cheap in the absence ofintemadonal<br />
capital flows to places where it would be expensive in the absence ofsuch flows.<br />
The Open <strong>Econ</strong>omy: lnternational Trade and Finance
lnternational <strong>Capital</strong> <strong>Flows</strong><br />
(a) United States<br />
Brltish lenders lend t0 borrowers in the United States,<br />
leading to equalization 0f interest rates at 4% in both<br />
countries. At that rate, American borrowing exceeds<br />
American lending; the ditference is made up by capihl<br />
Capitol outflow<br />
fron Bitain<br />
lnflows h ihe united States. Meanwhils, British lending<br />
exceeds British bonowing; the excess ls a capital<br />
outflow from Britain.<br />
Underlying Determinants of lnternational <strong>Capital</strong> <strong>Flows</strong><br />
The open-economy version ofthe loanable funds model helps us understand international<br />
capital flows in terms ofthe supply and demand for funds. But what underlies<br />
differences across countries in the supply and demand for funds? And why, in the absence<br />
of intemational capital flows, would interest rates differ inrernationally, creating<br />
an incenrive for internarional capital flows?<br />
International differences in the demand for funds reflect underlfng differences in<br />
investment opportunities. In particular, a country with a rapidly growing economy,<br />
other things equal, tends ao offer more investment opporrunities than a country with a<br />
slowly growing economy. So a rapidly growing economy typically-though not alwayshas<br />
a higher demand for capital and offers higher returns to investors than a slowly<br />
growing economy in the absence ofcapital flows. As a result, capital tends to flow from<br />
slowly growing to rapidly growing economies.<br />
The classic example is the flow ofcapital from Britain ro the United States, among<br />
other countries, between 1870 and 1914, During that er4 the U.S. economy was growing<br />
rapidly as the population increased and spread westward and as the nation indusrria.lized.<br />
This created a demand for investment spending on railroads, factories, and so<br />
on. Meanwhile, Britain had a much rnore slowly growing population, was already industrialized,<br />
and already had a railroad network covering the country. This left Britain<br />
with savings to spare, much of which were lent to the United States and other New<br />
World economies.<br />
International differences in the supply offunds reflect differences in savings across<br />
countries. These may be the result of differences in privace savings rates, which vary<br />
widely among countries. For example, in 2006, private savings werc 26.5oA ofJapan's<br />
GDP but only 14.8% of U.S. GDP. They may also reflect differences in savings by governments.<br />
In particular, government budget deficits, which reduce overall nadonal savings,<br />
car lead to capital inflows.<br />
(b) Britain<br />
m o d u le <strong>41</strong> <strong>Capital</strong> <strong>Flows</strong> and the <strong>Balance</strong> of Paymonts <strong>41</strong>7
A Global Savings Glut?<br />
ln the early years 0f the twenty-first century,<br />
the United States entered into a massive current<br />
account delicit, which meant that it became<br />
the recipient of huge capital inllows lrom<br />
the rest 0fthe world, especially China,other<br />
Asian countries, and the Middle East. Why did<br />
that happen?<br />
ln an influential speech early in 2005, Ben<br />
Bernanke-who was at thal time a governor of<br />
the Federal Reserve and who would soon be-<br />
come the Fedb chair---{ffered a hypothesis;the<br />
United States wasn't responsible, The "principal<br />
causes of the U.S. current account deficit," he<br />
declared, lie "outside the country's borders."<br />
Specifically, he argued that special factors had<br />
Nike, like many other companies, has<br />
opened plants in China to take advan'<br />
tage of low [abor costs and to gain better<br />
access to the large Chinese market.<br />
Here, two Chjnese employees assemble<br />
running shoes in a Nike factory in China.<br />
created a "globalsavings glut" that had pushed<br />
down interest rates worldwide and thereby led<br />
to an excess of investment spending over sav-<br />
ings in the United States,<br />
What caused this global savings glut? Ac-<br />
cording to Bernanke, the main cause was the<br />
series of financialcrises that began in Thajland<br />
in 1997, ricocheted across much ofAsia, and<br />
then hit Russia in 1998, Brazil in 1999, and<br />
Argentina in 2002. The ensuing fear and eco-<br />
nomic devastation led to a fall in investment<br />
spending and a rise in savings in many rela-<br />
tively poor countries. As a result, a number ol<br />
these countries, which had previously been the<br />
recipients of capital inflows from developed<br />
countries like the United States, began experi-<br />
encing large capital outflows. For the most part,<br />
the capital flowed t0 the lJnited States, perhaps<br />
because "the depth and sophistication of the<br />
counlry's financial markets" made it an attrac-<br />
tive destination.<br />
When Bernanke gave his speech, it was<br />
viewed as reassuring: basically, he argued that<br />
the United Slates was responding in a sensible<br />
way t0 the availability 0f cheap money in world<br />
financial markets. Later, however, it would be-<br />
come clear that the cheap money from abroad<br />
helped luel a housing bubble, which caused<br />
widespread financial and economic damage<br />
when it burst,<br />
Two-way <strong>Capital</strong> <strong>Flows</strong><br />
The loanable funds model helps us understand the direcrion ofrer capital flows the<br />
etcess ofinflows into a country over outflows, or vice versa. As we saw in Table <strong>41</strong>.2,<br />
however, grors flows take place in both directions: for example, the United States both<br />
sells assets to foreigners and buys assets from foreigners. Why does capital move in<br />
both directions?<br />
The answer to this question is that in the real world, as opposed to the simple<br />
model we've just conscructed, there are other motives for international capital flows<br />
besides seeking a higher rate ofinterest. lndividual investors often seek ro diversify<br />
against risk by buying stocks in a number of countries. Srocks in Europe may<br />
do well when srocks in rhe United Scates do badly, or vice versa, so investors in<br />
Europe try to reduce their risk by buying some U.S, stocks, even as invescors<br />
in the United States try to reduce their risk by buying some European<br />
stocks. The lesult is capital flows in both directions. Meanwhile,<br />
corporations often engage in international invesrment as part of<br />
their business strategy-for example, auto companies may Find that<br />
they can compete better in a national market iF they assemble some<br />
of their cars locally. Such business investments can also lead to<br />
two-way capital flows, as, say, European carmakers build plants in<br />
the United States even as U.S. computer companies open facilities<br />
in Europe.<br />
Finally, sorne countries, including the United States, are international<br />
banking centers: people from all over the world put money in U.S. financial<br />
institutions, which then invest many ofthose funds overseas.<br />
The result ofthese two-way flows is that modern economies are typically<br />
both debtors (countties that owe money to rhe rest of the world)<br />
and creditors (countries to which the rest of the world owes money). Due to years of<br />
both capital inflows and outflou,s, ar the end of2008, the United States had accumu-<br />
Iated foreign assets worth $19.9 trillion and foleigners had accumulated assets in the<br />
United States worth 523.3 rrillion.<br />
<strong>41</strong>8 s e c t i0 n I The Open <strong>Econ</strong>omy: lnternationat Trade and Finance
The Golden Age of <strong>Capital</strong> <strong>Flows</strong><br />
Techn0logy, it's often said, shrinks the world. Jet<br />
planes have put most olthe world's cities within<br />
a few hours of one another: modern telecommu-<br />
nications transmit information instantly around<br />
the globe. So you mightthink that international<br />
capitalflows must now be largerlhan ever<br />
But if capital fl0ws are measured as a share<br />
of world savings and investment, that belief<br />
turns out not t0 be kue. The golden age of capital<br />
llows actually preceded World War l-it<br />
lasted from 1870 to 1914.<br />
These capitalllows went mainly lrom Eur0-<br />
pean countries, especially Britain, to what were<br />
then known as "zones of recent settlement,"<br />
countries that were attracling large numbers 0f<br />
European immigrants. Among the biq recipients<br />
0t capital inflows wereAustralia, Argentina,<br />
Canada, and the United States.<br />
The large capital tlows reflected differences<br />
in investment 0pp0rtunities. Brilain, a mature<br />
<strong>41</strong>w<br />
Soluions appear at the bach ofthe baoh.<br />
Check Your Understanding<br />
1. Which ofthe balance ofpayments accounts do the ftrllowing<br />
events affecc?<br />
a. Boeing, a U.S.-based conpany, sells a newly built airplane<br />
to China.<br />
b. Chinese invescors buy stock in Boeing frorn Americans.<br />
Tackle the Test: Multiple-Choice Questions<br />
L The current account includcs which oFthe lollowing?<br />
I pa;T nen ts for goods aLtd :ervices<br />
II. rransFer paymencs<br />
IIL lactor incorne<br />
a. I only<br />
b. II on\,<br />
c. III only<br />
d. I and II only<br />
e. l, ll, and lll<br />
industrial economy with limited natural re-<br />
sources and a sl0wly growing population, of-<br />
fered relatively Iimited opportunities for new<br />
investment. The zones 0f recent settlement,<br />
with rapidly growing populations and abundant<br />
natural resources, offered investors a higher re-<br />
turn and attracted capital inflows. Estimates<br />
suggest that over this period Britain sent about<br />
40% ol its savings abroad, largely to finance<br />
raikoads and other large projects. No country<br />
has matched that record in modern times.<br />
Why can't we match the capitalflows of our<br />
great-great-grandfathers? Ec0n0mists aren't<br />
completely sure, but they have pointed to two<br />
causes: migration restrictions and political risks.<br />
During the golden age of capital flows, capital<br />
movements were complementary to population<br />
movemeflts;the big recipients 0f capitalfrom<br />
Europe were also places to which large numbers<br />
of Europeans were moving. These large-scale<br />
population movements were possible before<br />
World War I because there were lew legal re-<br />
strictions 0n immigration.ln today's world, by<br />
contrast, migration is limited by extensive legal<br />
barriers, as any0ne considering a move t0 the<br />
United States 0r Europe can tellyou.<br />
The other factOrthat has changed is political<br />
risk. l\4odern governments otten limit foreign in-<br />
vestment because they fear it will diminish their<br />
national autonomy. And due t0 politicalor secu-<br />
rity concerns, governments sometimes seize<br />
toreign property. a risk that deters investors<br />
from sending more than a relatively modest<br />
share 0ftheir wealth abroad. ln the nineteenth<br />
century such actions were rare, partly because<br />
s0me major destinations of investment were<br />
still European colonies and partly because in<br />
those days governments had a habit of sending<br />
troops and gunboats to enforce the claims 0f<br />
their investors.<br />
A Chinese con-rpany buys a used airplane fn;m American<br />
Airiines and ships it to China.<br />
A Chinese invescor who ou'ns property in the United<br />
Statcs buys a corporatejet, which he will keep in che<br />
Unircd Srert. so hc .an rrarcl arounJAncr.ita.<br />
2. The balance ofpayments on the currenc account plus the<br />
balance ofpaymerrts on the financial accounc is equal to<br />
b. one.<br />
c- the trade balance.<br />
d. net capital florvs.<br />
e. the size ofthe trade deficit.<br />
module 4l <strong>Capital</strong> <strong>Flows</strong> and the <strong>Balance</strong> ot <strong>Payments</strong> 479
3. The financial account was previously known as the 5. '*4rich ofthe following will increase the demand for loanable<br />
a. gross narional producr. funds in a country?<br />
b. capiral arcount. a. economic growth<br />
c. trade deficit. b. decreased investment opportunicies<br />
d. invescment account. c. a recession<br />
e. trade balance- d. decreased private savings lates<br />
4. The trade balance includes which ofthe following?<br />
I. imports and expora ofgoods<br />
U. imports and exports ofservices<br />
IIL net capital flows<br />
a. I only<br />
b. II only<br />
c. III only<br />
d. I and II only<br />
e. I,II, and III<br />
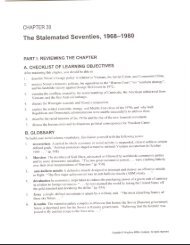
Tackle the Test Free-Response Ouestions<br />
e govemment budget surpluses<br />
1 a- How would a dectease in real income in the United States 2. Use rwo correcdy labeled side-by-side graphs ofthe loanable<br />
affect the U S. current account balance? Explain. funds market in the United Srates and China ro show how a<br />
b. Suppose China decides that it needs a huge program of higher inreresc rare in the Unired Stares will lead to capital<br />
infrastructure spending, which it willfinance by borrowing. flows between the two counrries. Onyour graphs, be sure to<br />
How will this program affect the U.S. balaace ofpayments? labd the starting and ending interesr rates and the size ofrhe<br />
Explain. capital inflows and outflows.<br />
Answor (4 poirb)<br />
'| point The curent account balance will lncrease (or move toward a surplus).<br />
1 polnt The decreas€ in income will cause imporb b dscrease.<br />
1 point The increase in lnfiasfuctjre spending in China yi,ill reducs ttls surplus<br />
ln the u.S, flnanciai account and reduce ih8 deficlt in the U.S. current account.<br />
1 point Because China is financing te progEm by b0nowing, lt ls llkely<br />
that other countriss will increase thelr lending h China, decreasing fieir<br />
lending to fie United Shtes.llrese capihl outflows trom the United States will<br />
roduce the U.S. surplus in fie linancial account and reduce the delicit in fte<br />
curTent account.<br />
420 s e c t io n 8 The Open <strong>Econ</strong>omy: lnternational Trade and Financo