I. OBJECTIVES, OUTCOMES and ASSESSMENT A ... - pace university
I. OBJECTIVES, OUTCOMES and ASSESSMENT A ... - pace university
I. OBJECTIVES, OUTCOMES and ASSESSMENT A ... - pace university

Create successful ePaper yourself
Turn your PDF publications into a flip-book with our unique Google optimized e-Paper software.
Student Opinion Survey<br />
The "Student Opinion Survey," a mechanism created <strong>and</strong> managed by the<br />
Seidenberg School, is administered annually to students shortly after graduation<br />
(Attachment I-5). Among other things, students are asked about achievement on<br />
program outcomes a through k. While self-reports are only an indirect measure<br />
(i.e. they do not require demonstrations of the ad hoc abilities <strong>and</strong> skills), "…the<br />
research literature indicates a moderate to strong correspondence between<br />
students' self-reports <strong>and</strong> more objective measures of learning outcomes." [Linda<br />
C. Strauss <strong>and</strong> Patrick T. Terenzini; "Assessing Student Performance on EC2000<br />
Criterion 3.a-k"; Proceedings of the 2005 American Society for Engineering<br />
Education; June 2005, page 8 -- available on display in the Goldstein Academic<br />
Center, room 314].<br />
The instrument’s stability has afforded before/after insight into whether program<br />
improvements seem to be having the intended effects. The only changes to the<br />
instrument, since it was first administered in 1997, were made in 2005. These<br />
included rewordings of three items (5, 16, <strong>and</strong> 17) <strong>and</strong> three new questions<br />
added at the end (46, 47, <strong>and</strong> 48). The next student opinion survey will include<br />
an additional item asking graduates about the international study opportunities of<br />
which they availed themselves to better assess the global aspect of outcome g.<br />
A major change in the curriculum, to be discussed, was implemented for Fall<br />
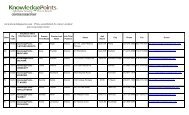
2002 when software engineering was made the required capstone. Table 1.4<br />
below contrasts the data from 2002 with the data from 2005 to assess this<br />
change on the outcomes effected. The tabulated percentages have no intrinsic<br />
meaning. The reason for two sets of values is to establish a baseline <strong>and</strong> show a<br />
change of direction.<br />
Table 1.4 Indirect Measures of Outcomes a through k<br />
from the Student Opinion Surveys (New Graduates) in 2002 <strong>and</strong> 2005<br />
Outcome Applicable Items<br />
2002<br />
Reported Fulfillment<br />
2005<br />
Reported Fulfillment<br />
a 1, 7, 9 51% 56%<br />
b 3, 4, 5, 8 45% 62%<br />
c 5, 7 37% 50%<br />
d 14 60% 67%<br />
e 15, 16, 17 62% 64%<br />
f 11, 12, 13 67% 50%<br />
g 15, 16, 17 62% 64%<br />
h 2, 18, 19 69% 78%<br />
i 4, 6, 10 49% 64%<br />
j 8, 9 43% 57%<br />
k 5, 6 34% 53%<br />
15