Chapter 6 TRADE AND LOCAL INCOME DISTRIBUTION: THE ...
Chapter 6 TRADE AND LOCAL INCOME DISTRIBUTION: THE ...
Chapter 6 TRADE AND LOCAL INCOME DISTRIBUTION: THE ...

You also want an ePaper? Increase the reach of your titles
YUMPU automatically turns print PDFs into web optimized ePapers that Google loves.
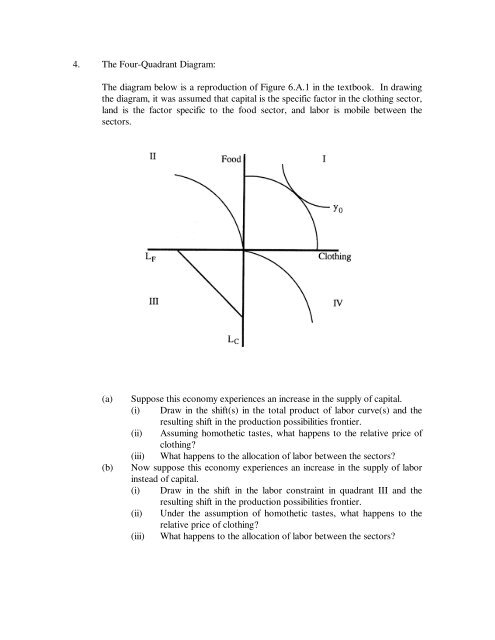
4. The Four-Quadrant Diagram:<br />
The diagram below is a reproduction of Figure 6.A.1 in the textbook. In drawing<br />
the diagram, it was assumed that capital is the specific factor in the clothing sector,<br />
land is the factor specific to the food sector, and labor is mobile between the<br />
sectors.<br />
(a) Suppose this economy experiences an increase in the supply of capital.<br />
(i) Draw in the shift(s) in the total product of labor curve(s) and the<br />
resulting shift in the production possibilities frontier.<br />
(ii) Assuming homothetic tastes, what happens to the relative price of<br />
clothing?<br />
(iii) What happens to the allocation of labor between the sectors?<br />
(b) Now suppose this economy experiences an increase in the supply of labor<br />
instead of capital.<br />
(i) Draw in the shift in the labor constraint in quadrant III and the<br />
resulting shift in the production possibilities frontier.<br />
(ii) Under the assumption of homothetic tastes, what happens to the<br />
relative price of clothing?<br />
(iii) What happens to the allocation of labor between the sectors?