2007 - Etman Distribusjon
2007 - Etman Distribusjon
2007 - Etman Distribusjon

Create successful ePaper yourself
Turn your PDF publications into a flip-book with our unique Google optimized e-Paper software.
<strong>Etman</strong> International ASA Accounts for 4q <strong>2007</strong><br />
Highlights<br />
• The company was listed on Oslo Axess 11.10.<strong>2007</strong>.<br />
• The growth in turnover was 49% in <strong>2007</strong> compared with 2006, with turnover<br />
reaching MNOK 140,6. The main reason being the acquisition of Sepo AS the 1 st of<br />
March <strong>2007</strong>, and increased sales from ETM Electrical Co. Ltd to Scandinavia and<br />
Europe.<br />
• Result of operations (EBIT) in <strong>2007</strong> was MNOK 0,0 after the result has been<br />
charged with MNOK 4,1 related to the Oslo Axess listing. Corresponding period of<br />
2006 the result was MNOK 3,9. In addition to the listing costs the decrease was<br />
mainly due to increase of sales and administration costs related to the subsidiary<br />
Sepo AS, and the strengthening of the administration functions in the parent<br />
company, <strong>Etman</strong> International ASA.<br />
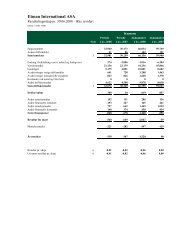
• Total assets and equity amounted to MNOK 120,3 and MNOK 42,2 respectively,<br />
implying an equity ratio of 35,1%.<br />
Key Figures - Unaudited<br />
Period Period Accum. Accum. Change<br />
2006-<br />
<strong>2007</strong> Q4 2006 Q4 <strong>2007</strong> Q4 2006 Q4 <strong>2007</strong><br />
Total<br />
2006<br />
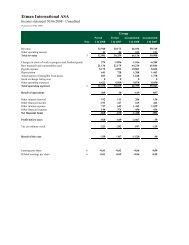
Revenue (MNOK) 43,4 33,5 140,6 94,4 49,0 % 94,4<br />
Result of operations - EBIT (MNOK) 1,2 1,3 0,0 3,9 -99,8 % 3,9<br />
Profit before taxes (MNOK) 0,5 1,2 -1,9 3,2 -158,0 % 3,2<br />
Result of the period (MNOK) 1,0 0,0 -0,5 2,1 -126,2 % 2,1<br />
Net cash flow from operations (MNOK) 3,0 2,1 0,7 -0,3 -345,8 % -0,3<br />
Cash and cash equivalents (MNOK) 12,4 8,5 45,9 % 8,5<br />
Number of employees end of period 394,0 342,0 15,2 % 342,0<br />
Chinese employees end of period 370,0 334,0 10,8 % 334,0<br />
Result per share (NOK) 0,04 0,00 -0,02 0,10 -124,3 % 0,10<br />
EBIT margin 2,8 % 3,8 % 0,0 % 4,1 % 4,1 %<br />
Equity ratio 35,1 % 41,8 % 41,8 %