össur annual report2009 - Euroland
össur annual report2009 - Euroland
össur annual report2009 - Euroland

Create successful ePaper yourself
Turn your PDF publications into a flip-book with our unique Google optimized e-Paper software.
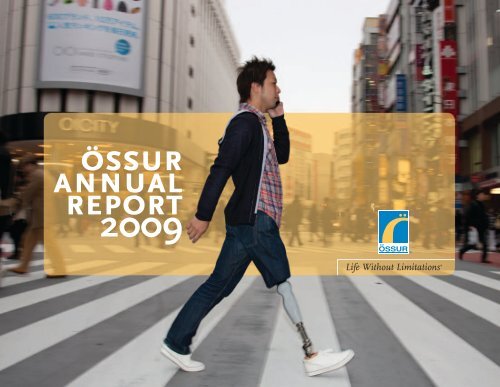
<strong>össur</strong><br />
<strong>annual</strong><br />
report<br />
2009
400<br />
350<br />
300<br />
250<br />
200<br />
150<br />
100<br />
50<br />
80<br />
70<br />
60<br />
50<br />
40<br />
30<br />
20<br />
10<br />
0<br />
0<br />
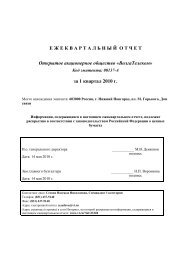
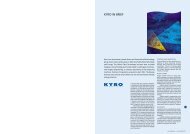
key figures<br />
total sales<br />
2005 2006 2007 2008 2009<br />
ebitda<br />
2005 2006 2007 2008 2009<br />
US Dollars in Millions<br />
US Dollars in Millions<br />
25<br />
20<br />
15<br />
10<br />
5<br />
0<br />
80<br />
70<br />
60<br />
50<br />
40<br />
30<br />
20<br />
10<br />
0<br />
research and development<br />
2005 2006 2007 2008 2009<br />
net cash provided by<br />
operating activities<br />
2005 2006 2007 2008 2009<br />
US Dollars in Millions<br />
US Dollars in Millions<br />
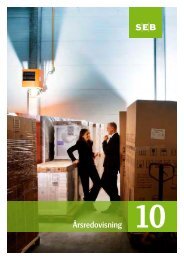
sales by geography<br />
48%<br />
sales by segment<br />
45%<br />
4%<br />
5% 1%<br />
48%<br />
49%<br />
Americas<br />
EMEA<br />
Asia<br />
Bracing & supports<br />
Prosthetics<br />
Compression therapy<br />
Other
table of contents<br />
<strong>annual</strong> report 2009<br />
02 ceo’s address<br />
04 strategy<br />
08 Market and environMent<br />
12 operations<br />
17 eXecutive ManageMent & ceo<br />
18 locations<br />
22 research and developMent<br />
26 huMan resources<br />
28 acquisition history<br />
32 corporate governance<br />
37 board of directors<br />
38 reMuneration<br />
42 risk factors<br />
46 Össur shares<br />
52 perforMance overvieW<br />
consolidated financial<br />
stateMents 2009<br />
57 financial ratios<br />
58 stateMent by the board<br />
of directors & ceo<br />
59 auditor’s report<br />
60 incoMe stateMents<br />
61 stateMents of coMprehensive incoMe<br />
62 stateMents of financial position<br />
64 stateMents of cash floW<br />
65 stateMents of changes in equity<br />
66 notes
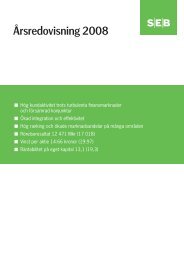
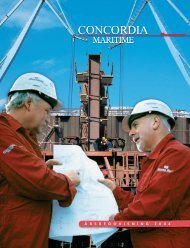
life changing<br />
technologies<br />
The turbulent global economic environment has been felt in different ways. For many,<br />
there have been new challenges and tough times over the course of this past year.<br />
However, I am pleased to report that Össur has maintained a steady and profitable<br />
operation throughout 2009. Our commitment to the Company’s main principles—<br />
honesty, frugality and courage—will help us continue to thrive. The Company’s core<br />
values are the foundation upon which we operate. Promoting “Life Without Limitations”<br />
remains the Company’s foremost aspiration.<br />
One of the Company’s cornerstones is innovation. Our constant commitment to<br />
more effective designs, technologies and outcomes has enabled us to maintain our<br />
technical leadership in the field of prosthetics. We have already introduced three<br />
Bionic products to the market. Our Bionic products utilize artificial intelligence to<br />
sense the user’s motion, allowing the prosthesis to react in real time. Össur’s Bionic<br />
products have received various awards and recognition over the past few years. The<br />
new RHEO KNEE ® is now a second-generation design, featuring our breakthrough<br />
Bionic Technology. This life-changing technology is unmatched by any other company<br />
and we continue to explore its potential with great excitement. The Bionic product<br />
PROPRIO FOOT ® has now been issued a reimbursement code that will be active in<br />
the US in 2010. This is a major milestone for the sales of the product. These new<br />
innovations, like Bionic Technology, come about because of Össur’s commitment to<br />
research and development. This commitment ensures that we will continue to produce<br />
cutting-edge products that promote comfort, control, better mobility and high quality<br />
of life.<br />
Össur has grown through a combination of organic growth and strategic acquisitions,<br />
with 14 acquisitions having been completed over the past 10 years. We operate in 14<br />
different locations around the globe, maintaining a well-balanced sales split between<br />
the US and European markets.
“The results for 2009 are good and show clearly the Company’s strength. Össur continues to be profitable and<br />
operations are sound. We believe that 2010 will be an exciting year for Össur.”<br />
In September, the Company was listed on NASDAQ OMX<br />
Copenhagen, and following the listing, a successful new<br />
shares offering was conducted. Since our initial listing in<br />
Iceland, Össur has transformed into a global company<br />
and it was a logical next step to list the Company in<br />
Copenhagen. At the end of the year just over 50% of our<br />
share capital was held by foreign investors. The additional<br />
listing in Copenhagen will facilitate trade, fair pricing of<br />
our shares and strengthen the Company’s foundation<br />
for future growth. As a symbol of the Company’s global<br />
standing, in November we were honored to be invited<br />
to ring the NASDAQ stock market closing bell in New<br />
York City. This symbolic event marked Össur’s tenth<br />
year of trading publically on NASDAQ OMX Iceland,<br />
and also commemorated our new listing on NASDAQ<br />
OMX Copenhagen.<br />
I would like to thank the investors for supporting the<br />
Company’s mission. This year’s performance will ensure<br />
this level of support continues. Investor support also<br />
allows us to re-invest a significant proportion of our<br />
revenues into R&D to maximize future innovations.<br />
Our aim, at all times, is to exceed our customers’<br />
expectations by delivering the products and services<br />
that will help them achieve their goals. At Össur,<br />
“Life Without Limitations” is more than a slogan; it has<br />
been our passion for close to 40 years. It is a philosophy<br />
that permeates every aspect of the business, from R&D<br />
to products and services. On a personal note, watching<br />
the progress of people like Rudy Garcia-Tolson, the<br />
young American sportsman and role model who<br />
recently became the first double below-knee amputee to<br />
complete an “Ironman”, and the incredible UK athlete<br />
Richard Whitehead who is the amputee World Record<br />
holder for marathons, is truly ample reward.<br />
Our mission is to improve people’s mobility. Each<br />
day we see the dramatic impact our products have on<br />
people’s quality of life. Whether they are Paralympic<br />
athletes or military heroes using prosthetics, or people<br />
using a knee brace to get back to their daily routine, the<br />
accomplishments of these everyday heroes constantly<br />
inspire us to go further.<br />
Jón Sigurðsson<br />
President & CEO<br />
3 <strong>annual</strong> report 09
strategy<br />
Mission<br />
WE IMPROvE PEOPLE'S MOBILITY.<br />
vision<br />
LEADING COMPANY IN NON-INvASIvE ORTHOPAEDICS.
strategy<br />
Össur focus is on improving people’s mobility through<br />
the delivery of innovative technologies within the fields<br />
of bracing and supports, prosthetics and compression<br />
therapy. Innovation and acquisitions are, and will<br />
continue to be, the cornerstone of Össur’s strategy.<br />
Össur creates value for customers, shareholders and<br />
employees by:<br />
Increasing value through innovation. Össur’s innovative<br />
products ensure the Company maintains a consistently<br />
strong position within the non-invasive orthopaedics<br />
market. The Company intends to continue leading the<br />
way with innovative solutions by delivering a steady,<br />
valuable and successful product pipeline, enabling<br />
customers and clients to live life without limitations.<br />
Growing through strategic acquisitions. Össur has evolved<br />
from a single product prosthetic company to a global<br />
player in the non-invasive orthopaedics market with a<br />
broad and diverse range of products. Over the last few<br />
years, Össur’s focus has been on extracting synergies<br />
from previous acquisitions. Strategic acquisitions, that<br />
can expand the product portfolio or sales channel, are<br />
constantly monitored.<br />
Gaining market share through a localized, well-defined,<br />
go-to market strategy. The Company has changed<br />
tremendously over the last few years, from the range<br />
of products and technologies Össur produces to the<br />
growing list of customers and markets. Össur will<br />
continue to offer high quality products and services<br />
committed to customers’ needs.<br />
Increasing profitability through efficiency and economies<br />
of scale. Össur strives to constantly improve and<br />
believes a profitable operation is the key to success.<br />
Össur is continually aiming to increase the efficiency<br />
of its operations and will always strive to seek new<br />
opportunities for further optimization.<br />
values<br />
Össur’s core values—Honesty, Frugality and Courage—<br />
serve as the foundation for the Company’s success.<br />
One fundamental characteristic to ensure successful<br />
cooperation is that all employees honor the Company’s<br />
core values as they communicate with colleagues<br />
and customers.<br />
honesty<br />
We show respect by adhering to facts, fulfilling promises<br />
and claims, and admitting failures. We nurture honest<br />
communication throughout the Company by sharing<br />
information and respecting each other’s workload.<br />
frugality<br />
We use resources wisely. We aim to minimize costs<br />
across all areas of our business through effective<br />
communication, preparedness, planning and optimized<br />
processes.<br />
courage<br />
We are open to change and constantly strive for<br />
improvement. We challenge unwritten rules, show<br />
initiative and take risks, while at the same time, taking<br />
responsibility for our ideas, decisions, and actions.<br />
5 <strong>annual</strong> report 09
○○ unloader one ®<br />
Osteoarthritis (OA) is the most common form of<br />
arthritis and knee bracing is a proven treatment<br />
option for sufferers of knee OA. The Unloader One<br />
knee brace offers comfort and suspension, and is<br />
clinically proven to relieve pain and improve mobility.
Market and environMent<br />
Össur operates within niche segments of the orthopaedic industry in the medical<br />
device market. The Company’s main focus is on non-invasive orthopaedic products,<br />
including bracing and supports, prosthetics and compression therapy.<br />
industry stakeholders<br />
The orthopaedic market is characterized by the many stakeholders and decision<br />
makers involved in the purchasing decision. The stakeholders can be categorized into<br />
four groups, as described below:<br />
payers<br />
Government<br />
reimbursement<br />
Insurance<br />
companies<br />
Private payers –<br />
end-users<br />
influencers<br />
Trade & medical<br />
associations<br />
Schools<br />
Families<br />
O&P users<br />
associations<br />
providers<br />
O&P Workshops<br />
Doctors<br />
Hospitals<br />
Physical therapists<br />
Pharmacies<br />
Podiatrists<br />
orthopaedics industry<br />
stakeholders<br />
consumers<br />
Patients/end-users
industry dynaMics<br />
Innovation and technological developments; demo-<br />
graphics; lifestyle; and the regulatory environment are<br />
key dynamics that influence the orthopaedic market.<br />
Some dynamics can be influenced by the market players,<br />
such as the technological upgrading of products.<br />
Other influences are the result of complicated interactions<br />
between different stakeholders within the industry,<br />
including social and demographic changes that can have<br />
a significant impact on the orthopaedic products market.<br />
technological developMent<br />
New technologies and technology combinations, as well<br />
as new materials, continuously yield improved products.<br />
Such technological advances lead to market growth<br />
through new customer segments and stimulate demand<br />
for more technically advanced and expensive solutions.<br />
deMographics & lifestyle<br />
An aging population, increased social demands and lifestyle<br />
issues form the underlying market fundamentals of<br />
the orthopaedic industry.<br />
The percentage of the population aged 65 and older is<br />
rising in all OECD countries, and this trend is expected to<br />
continue1 . The trend will underpin market growth in the<br />
prosthetic industry, as an aging society brings an increase<br />
in the frequency of vascular diseases and diabetes, the<br />
1. World Population Aging, UN - Department of Economic and Social Affairs, 2007.<br />
2. Source: Amputee Coalition of America<br />
3. Frost & Sullivan<br />
two main causes of amputation. Approximately 1.2 million,<br />
or over 80% of all US amputees (excluding fingers<br />
and toes), are over 65 years of age2 . Today, more and<br />
more people in this age group are aware of the advantages<br />
of active living. As the primary users of orthopaedic<br />
products, they constitute an important driver of market<br />
growth in the industry. The increasingly affluent and<br />
aging population sets new standards for quality of life<br />
and this group demands full mobility, including prosthetics<br />
for those that have lost a limb.<br />
An aging population also indicates an increasing amount<br />
of fractures, joint instability and joint afflictions, such as<br />
osteoarthritis, which increases the demand for different<br />
forms of bracing and supports products. Moreover, this<br />
same population will drive growth for compression therapy<br />
products, as users of compression therapy solutions<br />
are primarily elderly citizens.<br />
Obesity and an overweight population pose a major risk<br />
for chronic diseases, including diabetes and vascular<br />
complications, which in turn increases the need for prosthetics,<br />
bracing and supports and compression therapy<br />
products.<br />
Approximately 4 million Americans suffer from knee<br />
osteoarthritis and about 100,000 braces are sold<br />
<strong>annual</strong>ly in the US, indicating further opportunities to<br />
capitalize on3 . Obesity and aging populations are the<br />
main market drivers for osteoarthritis.<br />
Other industry drivers include people experiencing more<br />
positive lifestyle issues, such as increased participation<br />
in sports, and the awareness of the advantages of<br />
an active lifestyle. This in turn increases the need for<br />
bracing and supports, due to increased number of<br />
sports-related injuries and an increased demand for<br />
preventive products.<br />
regulatory environMent<br />
Healthcare providers are typically constrained by<br />
budgets, and consequently the healthcare regulatory<br />
environment demands cost-effective solutions without<br />
compromising quality. This has led to substantial investments<br />
in systems demonstrating and proving cost/<br />
benefit for potential buyers. For any market player within<br />
the orthopaedics industry, two vital requirements are<br />
the ability to constantly react to a changing regulatory<br />
environment and the ability to adapt product offerings to<br />
the prevailing regulatory system.<br />
9 <strong>annual</strong> report 09
Össur is in the business of keeping people mobile with innovative, noninvasive<br />
products. Össur offers advanced products in three categories:<br />
Bracing and SupportS: Products for therapeutic and<br />
preventive purposes<br />
proStheticS: Artificial limbs and related products<br />
compreSSion therapy: Products for treatment of<br />
vascular disorders, ulcers and oedema<br />
reiMburseMent & healthcare<br />
reforMs<br />
The majority of Össur’s products are reimbursable<br />
through various public and private reimbursement<br />
schemes. Reimbursement systems vary substantially<br />
between countries and product markets.<br />
With regards to the healthcare reforms in the US, possible<br />
effect on the Company’s operations remain unclear.<br />
As some elements of the healthcare bill are still being<br />
discussed it is difficult for management to comment on<br />
the possible effect on the Company. However, it is not<br />
likely to have material effect in 2010.<br />
Market<br />
The estimated size of the non-invasive orthopaedic<br />
market in the Americas, EMEA and Asia, in which Össur<br />
operates, is estimated to be around USD 4,550 million in<br />
2009, and growing 3% to 4% <strong>annual</strong>ly4 .<br />
4. According to Frost & Sullivan industry analysis and Össur‘s management estimates.<br />
<strong>annual</strong> report 09<br />
10<br />
non-invasive orthopaedics<br />
market drivers and restraints<br />
drivers +<br />
○ new technologies<br />
○ aging population<br />
○ increased instances of obesity<br />
○ increased prevalence of<br />
diabetes and vascular diseases<br />
○ increased health awareness<br />
and demand for higher<br />
quality of life<br />
Market segMent Market size*(usd Millions) Market groWth Össur Market share<br />
bracing and supports 2,700 3-5% 6%<br />
prosthetics 700 3% 21%<br />
coMpression therapy 1,150 7-8% 6%**<br />
* According to Frost & Sullivan industry analysis and Össur’s management estimates.<br />
** Össur market share in France.<br />
○ efforts to hold back growth<br />
in healthcare expenditures<br />
○ changes and limitations in<br />
reimbursement systems<br />
○ advances in vascular surgery<br />
○ pain medication<br />
○ improved invasive procedures<br />
restraints -
acing and supports<br />
DJO<br />
DeRoyal<br />
Breg<br />
Bauerfeind<br />
Thuasne<br />
<strong>össur</strong> main competitors<br />
prosthetics<br />
Otto Bock<br />
Medi<br />
Ohio Willow Wood<br />
bracing and supports<br />
Bracing and supports products are primarily used<br />
to support joints and other body parts, both for therapeutic<br />
and preventive purposes. These orthopaedic<br />
devices provide users with protection, immobilization,<br />
pain relief, compression and ultimately, increased functionality.<br />
Össur offers a comprehensive line of custommade<br />
and off-the-shelf products for the ankle, foot, knee,<br />
neck, spine and arm. The development of the bracing<br />
and supports product range combines some of the most<br />
effective technologies available today with over 30 years<br />
of design experience.<br />
The bracing and supports market is a fragmented market.<br />
Össur is the third largest player in the global bracing<br />
and supports market with roughly a 6% market share.<br />
compression therapy<br />
Ganzoni<br />
Innothera<br />
Thuasne<br />
BSN/Jobst<br />
prosthetics<br />
Prosthetic products include artificial limbs and related<br />
products for individuals who were born without limbs or<br />
have had limbs amputated. Össur offers a full spectrum<br />
of premium lower limb prosthetic products, including<br />
knees, feet and liners. By applying award winning technologies,<br />
expert design and biomechanical understanding,<br />
Össur has developed a product line that represents<br />
the best in modern prosthetics. Össur’s state of the art<br />
Bionic Technology applies a synthesis of mechanics and<br />
electronics, which serve to mimic natural sensory and<br />
motor control functions of the amputee. This enables<br />
the prosthetic product to accurately reproduce functions<br />
that have been lost due to amputation.<br />
Significant consolidation has taken place in the prosthetic<br />
market. Technological advancements have had a<br />
positive impact on revenue, and stable long-term market<br />
growth is anticipated given the need to periodically<br />
replace prosthetic devices. Össur is the second largest<br />
player in the prosthetics market with about a 21%<br />
market share.<br />
sales by segment<br />
45%<br />
5% 1%<br />
49%<br />
Bracing & supports<br />
Prosthetics<br />
Compression therapy<br />
Other<br />
coMpression therapy<br />
Compression therapy is a preferred treatment for venous<br />
ulcers and edema and has been used for more than a<br />
century. External pressure is applied on the vascular<br />
elements to assist in pumping blood back to the heart.<br />
Compression therapy products, such as compression<br />
socks, tights and bandages, are thus used to apply<br />
pressure to the vascular system to improve circulation<br />
and minimize swelling. Össur entered the compression<br />
therapy segment in 2006 with the acquisition of Gibaud<br />
in France.<br />
Össur’s compression therapy products are currently<br />
only sold in France, where the Company has about a 6%<br />
market share.<br />
11 <strong>annual</strong> report 09
operations<br />
Össur is a global orthopaedics company, a leader in the development, manufacturing,<br />
distribution, sales and marketing of bracing and supports products and prosthetics.<br />
future vision<br />
Össur’s vision is to maintain the leadership role in the non-invasive orthopaedics<br />
market. The Company’s business is focused on improving people’s mobility through<br />
the delivery of innovative technologies within the fields of bracing and supports,<br />
prosthetics and compression therapy.<br />
Currently, Össur is the world’s second-largest provider of prosthetic products and is<br />
seen as a technical leader within the field. Össur is the third-largest company within<br />
the bracing and supports market. Today, Össur compression therapy products are only<br />
sold in France where Össur holds the fifth-largest market share.<br />
organizational structure<br />
The Össur Consolidation consists of 14 subsidiaries in nine countries: Össur hf. in<br />
Iceland; Össur EMEA with offices in the UK, the Netherlands and Sweden; Gibaud in<br />
France; Össur Asia in China and Australia; and Össur Americas in the US and Canada.<br />
The Company’s headquarters are located in Iceland, and include administrative<br />
functions, corporate finance, research and development and prosthetic production.<br />
The Company is divided into four main functions: Sales and Marketing, Manufacturing<br />
& Operations, Research & Development, and Corporate Finance.
eXecutive ManageMent<br />
hjörleifur pálsson<br />
Chief Financial Officer<br />
sales<br />
Össur sells its products to healthcare professionals,<br />
clinics, hospitals etc. The Company’s customer groups<br />
vary substantially between countries and segments, as<br />
explained in the following chapters.<br />
Össur aMericas<br />
Össur Americas total sales were USD 159 million in<br />
2009, accounting for 48% of the Company’s total sales.<br />
Össur Americas is responsible for sales and marketing<br />
within the US, Latin America and Canada. Össur<br />
Americas’ sales force consists of 124 direct employees<br />
as well as 25 independent representative sales groups.<br />
hilmar br. janusson<br />
VP of Research and Development<br />
jón sigurðsson<br />
President & CEO<br />
egill jónsson<br />
VP of Manufacturing and Operations<br />
Össur Americas’ sales and marketing went through a<br />
major structural transformation in 2009 with the goal of<br />
increasing sales coverage and enhancing sales and marketing<br />
competency. The new simplified sales structure is<br />
region specific with an emphasis on optimizing resource<br />
deployment to the most attractive opportunities. A<br />
national accounts group was also created with a focus<br />
on managing key national partners and acquiring Group<br />
Purchase Organization (GPO) contracts. The effect of<br />
the global economic slow-down has been most profound<br />
in states suffering from high unemployment rates, and<br />
has given way to increased price competition within the<br />
more commoditized segment of the product offering.<br />
In 2009, total sales amounted to USD 331<br />
million. The split between Americas and EMEA<br />
was close to even, both markets accounted for<br />
48% while the Asia market accounted for 4%.<br />
jón sigurðsson<br />
mahesh mansukhani<br />
ólafur gylfason<br />
Sales and Marketing<br />
bracing and supports<br />
Sales of bracing and supports products are carried out<br />
directly and through distributors. This business segment<br />
has a diverse product offering and many specialized<br />
customer groups. In 2009, Össur Americas focused on<br />
increasing customer diversity, and signed three major<br />
GPO contracts, enhancing access to the hospital channel.<br />
These new GPO contracts are a major platform in<br />
order to capitalize on the value of Össur’s broad product<br />
offering and its sales force. In 2009, Össur Americas<br />
took over an ownership stake of two major bracing and<br />
supports distributors in California and North Texas.<br />
13 <strong>annual</strong> report 09
The Company believes that the combination of state of<br />
the art R&D function, cost effective production and a<br />
highly effective sales team will make the company highly<br />
competitive for years to come.<br />
prosthetics<br />
Direct sales to O&P workshops account for the<br />
majority of prosthetic sales. Moreover Össur Americas<br />
has a distribution agreement with SPS, the distribution<br />
arm of Hanger Orthopaedic Group, the largest network<br />
of O&P workshops in the US. Prosthetics performed well<br />
in 2009 with increasing contribution from the Össur’s<br />
Bionic products.<br />
Össur eMea<br />
Össur EMEA total sales amounted to USD 157 million in<br />
2009, accounting for 48% of the Company’s total sales.<br />
Össur EMEA is in charge of sales, marketing and services<br />
throughout Europe, including the Nordic Region,<br />
the Middle East and Africa. EMEA is split into three main<br />
sales areas; Nordic and UK, which is an established<br />
hospital and O&P market; Gibaud, which is mainly the<br />
pharmacy market in France; Italy and Europe, which is<br />
<strong>annual</strong> report 09<br />
14<br />
focusing on developing the rest of the EMEA markets.<br />
The EMEA sales force consists of 135 employees and<br />
roughly 100 distributors. Some European markets were<br />
more affected by the economic downturn than others.<br />
The hardest hit markets were in the UK and Spain.<br />
bracing and supports<br />
In EMEA, the O&P channel accounts for only a small<br />
portion of the bracing and supports market. Segments<br />
like hospitals with various divisions/departments, prescribers,<br />
pharmacies and private clinics are a much<br />
larger part of the customer group. The importance of<br />
each channel varies between countries within Europe.<br />
In addition, bracing and supports products are sold<br />
through a network of distributors within the Germanic<br />
and European countries, Eastern Europe, the Middle<br />
East and Africa. In 2009, discontinuation of contracts<br />
with third party suppliers has had a temporary negative<br />
<strong>össur</strong> sales force<br />
direct sales and sales through distributors<br />
prosthetics<br />
Customer groups<br />
O&P workshops<br />
bracing<br />
& supports<br />
Customer groups<br />
- O&P workshops<br />
- Hospitals<br />
- Pharmacies<br />
- Clinics/Doctors<br />
- Orthopaedic clinics<br />
- Physical therapy<br />
compression<br />
therapy<br />
Customer groups<br />
- Pharmacies<br />
- Hospitals<br />
effect on sales within the EMEA markets but did not<br />
affect overall profitability.<br />
prosthetics<br />
Sales of prosthetics are direct to O&P workshops within<br />
16 European countries. In addition, prosthetics are<br />
sold through 30 distributors, servicing O&P facilities in<br />
Eastern Europe, the Middle East and Africa.<br />
coMpression therapy<br />
Currently, compression therapy products are only sold in<br />
France. The main customer segment for these products<br />
is pharmacies.
Össur continues to seek opportunities for further<br />
optimization of manufacturing, including lowering cost of<br />
goods sold, shortening lead time and ensuring best terms<br />
and appropriate inventory levels .<br />
Össur asia<br />
Össur Asia total sales amounted to USD 14 million in<br />
2009, accounting for 4% of the Company’s total sales.<br />
Össur Asia’s market spans from Pakistan to New<br />
Zealand with the key focus markets currently in Japan,<br />
Australia, China, Korea and India. The sales force in Asia<br />
consists of nine employees.<br />
The Asian sales channel includes both direct sales and<br />
sales through distributors. In Australia, bracing and<br />
supports are sold through local distributors and prosthetics<br />
are sold directly. In China, bracing and supports<br />
are primarily sold through local distributors, whereas<br />
prosthetics are mostly sold through an exclusive distributor.<br />
In other Asian markets sales are conducted via<br />
distributors. The main customer segments in Asia are<br />
O&P facilities and hospitals.<br />
Manufacturing &<br />
operations<br />
Össur is constantly striving for increased efficiency in<br />
manufacturing and operations. Product quality, safety,<br />
service and cost leadership are the focus of the M&O<br />
division. Around 780 employees work in the manufacturing<br />
and operations division.<br />
Manufacturing of prosthetics takes place in Iceland,<br />
except for the product lines of mechanical knees.<br />
Manufacturing of bracing and supports products takes<br />
place in the US and in France. Additionally, some of<br />
the B&S production is outsourced to Asia. In order<br />
to maximize quality and minimize production costs,<br />
Össur works closely with each of its subcontractors,<br />
and each subcontractor is subjected to frequent reviews.<br />
Compression therapy products are manufactured in<br />
France. Currently 26% of the manufacturig is outsourced<br />
to Asia.<br />
15 <strong>annual</strong> report 09
We provide products and services to exceed<br />
customers’ expectations. Strongly focused<br />
on continuous improvement, we monitor<br />
and respond to needs, complying with all<br />
regulatory requirements.<br />
quality<br />
The Company places significant emphasis on quality.<br />
With regards to the manufacturing of medical-device<br />
products it is highly important for Össur to expand the<br />
scope of its quality control system in line with the enactment<br />
of new laws and regulations, as well as with the<br />
growth of the Company. Since 1993, Össur has had a<br />
certified quality system in place.<br />
Quality requirements imposed on Össur are rather strict<br />
because the Company’s products are classified as medical<br />
devices. All Össur products are CE-labeled to meet<br />
the requirements of the European Economic Area, and<br />
in the United States the Company’s products adhere to<br />
FDA standards. Össur complies with ISO 9001:2000 and<br />
ISO 13485:2003. In 2009, the British Standard Institution<br />
(BSI) conducted 10 external audits, all of which concluded<br />
with positive results.<br />
<strong>annual</strong> report 09<br />
16<br />
treasury &<br />
corporate<br />
development<br />
Treasury<br />
Investor<br />
Relations<br />
Legal<br />
Corporate<br />
development<br />
r&d and product<br />
developMent<br />
Össur’s strategy is to be a source of innovative, high-<br />
quality, non-invasive orthopaedic products and services.<br />
Össur’s innovative products ensure a consistently<br />
strong position in the market. The Company has always<br />
seen R&D as essential to future development and is<br />
determined to maintain its technological competency<br />
through investment in research and development. In<br />
2009, Össur’s investment in R&D amounted to 5.8% of<br />
the Company’s total sales. Fifteen new products were<br />
launched in 2009, including the second generation of<br />
the RHEO KNEE ® which has been very well received<br />
by the market. In 2009, 101 employees worked in the<br />
Company’s R&D division.<br />
corporate finance<br />
corporate<br />
planning<br />
& analysis<br />
Financial statements<br />
Management<br />
reporting<br />
Tax planning &<br />
monitoring<br />
Budgets<br />
human<br />
resources<br />
HR Management<br />
HR processes<br />
HR intelligence<br />
business<br />
information<br />
services<br />
Employee support<br />
& services<br />
Project<br />
management<br />
& consulting<br />
Business application<br />
development<br />
Infrastructure<br />
corporate finance<br />
Corporate Finance is responsible for the overall<br />
finance administration of the consolidation. Within<br />
corporate finance there are 72 employees working in<br />
Human Resources, Business Information Services,<br />
Treasury & Corporate Development and Corporate<br />
Planning & Analysis. Corporate finance is responsible for<br />
structure and platform development globally for these<br />
functions. One of the major projects within Corporate<br />
Finance in 2009 was the listing of Össur hf. on NASDAQ<br />
OMX Copenhagen.
Mr. Janusson, Mr. Mansukhani, Mr. Pálsson, Mr. Gylfason, Mr. Jónsson, Mr. Sigurðsson, President & CEO<br />
eXecutive ManageMent and ceo<br />
HILMAR BRAGI JANUSSON, vice President of Research and Development, has been with Össur<br />
since 1993. He was a researcher with the Technological Institute of Iceland from 1987 to 1988. Dr.<br />
Janusson is on the board of a number of Icelandic companies. He holds a degree in Chemistry<br />
from the University of Iceland and a Doctorate in Chemical Science and Engineering from Leeds<br />
University in England.<br />
MAHESH MANSUKHANI, President of Össur Americas, joined Össur in 2008. Prior to joining the<br />
company, he was a Director at AlixPartners (2008). From 2005-2007, he was the Global Business<br />
Director of DuPont Tyvek ® and the Global Director of DuPont Marketing and Sales Effectiveness<br />
from 2002-2005. Prior to this, Mr. Mansukhani held roles in Management Consulting and Finance.<br />
Mr. Mansukhani has an M.A. degree in Multinational Accounting and Financial Management from<br />
Reading University in England, M.Phil. Finance degree from Warwick Business School in England,<br />
and an MBA from Yale University in the United States.<br />
HJöRLEIfUR páLSSON, Chief Financial Officer, joined Össur in 2001. He is a former partner of<br />
Deloitte hf. Mr. Palsson graduated in 1988 with a Business Degree from the University of Iceland, and<br />
qualified as a Certified Public Accountant in 1989.<br />
ÓLAfUR GYLfASON, Managing Director of Össur EMEA has been with Össur since 1997. Mr.<br />
Gylfason was the Managing Director of Össur Europe until 2007 and before that working in international<br />
sales and as Marketing and Sales Director for Europe. Mr. Gylfason holds a degree in<br />
Business Administration from Bifrost School of Business. He continued his studies at Ålborg<br />
University in Denmark, graduating with a Master’s degree in International Business Economics<br />
in 1997.<br />
EGILL JÓNSSON, vice President of Manufacturing and Operations, has been with Össur since<br />
1996. He has led the Manufacturing division since that date. He was formerly a Project Manager<br />
at vGK hf., an engineering firm in Reykjavik (1985-1996). Mr. Jonsson has a Master’s degree in<br />
Mechanical Engineering from the Technical University in Copenhagen, DTU (1984).<br />
JÓN SIGURðSSON, pRESIDENT & CEO, has led the Company since 1996. He was the Commercial<br />
Counsellor for the Icelandic Trade Council in New York between 1992 and 1996 and previously Chief<br />
Financial Officer at Alafoss between 1989 and 1991. Mr. Sigurdsson also worked as Head of the<br />
International Division of Eimskip (1986–1989) and as an Engineer for Bang and Olufsen Denmark<br />
(1982–1984). He is a board member of the Iceland Chamber of Commerce, the Confederation of<br />
Icelandic Employers and Alcan in Iceland. Mr. Sigurdsson has a B.Sc. degree in Industrial Engineering<br />
from Odense Technical College in Denmark and a Master’s degree in Business Administration<br />
(MBA) from the United States International University in San Diego, USA.<br />
17 <strong>annual</strong> report 09
locations<br />
china<br />
asia<br />
china<br />
Asian Headoffice, sales, marketing,<br />
distribution, R&D and outscourcing activities<br />
australia<br />
Sales, marketing, distribution<br />
<strong>annual</strong> report 09<br />
18<br />
australia<br />
north america<br />
north aMerica<br />
neW Jersey<br />
Manufacturing and East Coast distribution center<br />
Michigan<br />
Prosthetic knee manufacturing<br />
california<br />
US Head office, sales, marketing, distribution, R&D,<br />
manufacturing of bracing and supports products.<br />
canada<br />
Sales, marketing, distribution, manufacturing of CM knee braces
iceland<br />
Sales, marketing, distribution<br />
Sales, marketing, distribution<br />
European Headoffice, sales, marketing, distribution<br />
Sales office<br />
iceland<br />
Headquarters, R&D, manufacturing<br />
Sales, marketing, distribution, R&D, manufacturing of bracing<br />
and support products and compression therapy products<br />
europe<br />
19 <strong>annual</strong> report 09
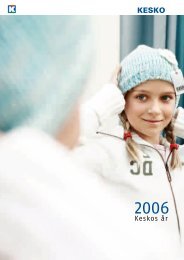
The world’s most requested ligament knee brace,<br />
the CTi ® has set the standard for over 20 years. A<br />
carbon composite frame combined with gentle yet<br />
strong silicone material for outstanding comfort and<br />
performance. CTi knee braces are demanded by top<br />
athletes and respected by leading physicians around<br />
the world.
esearch and developMent<br />
Innovation is a key pillar of Össur’s strategy and the catalyst for the Company’s<br />
organic growth. Each year, a sizable amount is invested in research and development<br />
activities. In 2009, Össur invested USD 19 million in R&D, corresponding to 5.8% of<br />
the Company’s total sales. Össur R&D operates departments in four countries: Iceland,<br />
USA, France and China. Main functions are managed globally: product and project<br />
management, engineering, intellectual property management, biomechanical and<br />
medical platform.<br />
product ManageMent<br />
The role of product management is to create and implement product strategies and<br />
vision throughout the Company. This involves analyzing and understanding market<br />
dynamics and customer needs, overseeing and monitoring product lifecycles, new<br />
product introductions and discontinuations, as well as developing pricing and positioning<br />
strategies. Product management is divided into three segments: bracing and<br />
supports, prosthetics and compression therapy.<br />
bracing and supports<br />
The development of Össur’s bracing and supports products combines some of the<br />
most effective technologies available today with over 30 years of design experience and<br />
a broad knowledge of biomechanics. Össur offers a comprehensive line of products for<br />
the ankle, arm, foot and knee, as well as the neck and spine. In 2009, Össur launched<br />
five bracing and supports products.<br />
prosthetics<br />
Össur is the innovative leader in the prosthetic industry, offering quality and high-end<br />
solutions for all user segments at a premium price. Breakthrough technologies and awardwinning<br />
designs have combined to create a leading range of prosthetic solutions with<br />
an emphasis on clinical outcomes and quality of life. The Company has recently focused<br />
on establishing the Bionic product line, arguably the most significant advancement to
project<br />
management office<br />
engineering<br />
date in modern prosthetics. Össur offers a total solution<br />
of prosthetic products, such as interfaces, feet, knees and<br />
componentry. Five prosthetics products were launched<br />
in 2009.<br />
coMpression therapy<br />
Össur entered into the compression therapy market in<br />
December 2006 with the acquisition of the French company<br />
Gibaud. Gibaud has been developing compression<br />
therapy products, such as stockings, socks and bandages<br />
for over 75 years. Össur’s compression therapy products<br />
are renowned for their therapeutic effect, comfort<br />
and esthetics. In 2009, five products were launched in<br />
the compression therapy line.<br />
product<br />
management<br />
r&d<br />
functions<br />
intellectual<br />
property<br />
biomechanical &<br />
medical platforms<br />
proJect ManageMent office<br />
Össur R&D project portfolio management involves<br />
selecting and prioritizing projects to ensure alignment<br />
to the Company’s overall strategy, and with the objective<br />
to maximize value and minimize risk.<br />
Project portfolio is managed by Össur’s proprietary selection<br />
model. It consists of several parameters, each carrying<br />
different weight, that are used to determine project<br />
viability. It also contains constraint parameters, in order<br />
to assure balance in the project portfolio. A parameter’s<br />
weight is determined by applying analytical hierarchy<br />
procedure (AHP) methodology and is reviewed <strong>annual</strong>ly<br />
by Össur’s executive team in line with the Company’s<br />
overall strategies.<br />
23 <strong>annual</strong> report 09
engineering<br />
Össur’s continued success owes much to its accumulated expertise in six areas that the Company has identified as<br />
its core competencies, knowledge that is increasingly being transferred and applied to great effect across all areas of<br />
product development.<br />
inJection Molding<br />
One of Össur’s most prolific platforms, injection molding is widely used in<br />
the manufacture of orthopaedic products such as walkers and cervical collars.<br />
The Company has patented a number of techniques for over-molding, which<br />
creates a more comfortable, anatomically contoured edging for a number of<br />
orthopedic applications. Össur’s continuous improvement of design skills<br />
in this area and new innovations are increasing the competitive edge of this<br />
technology platform.<br />
Mechatronics<br />
Össur’s Bionic Technology is a precise fusion of artificial intelligence and<br />
human physiology. When a limb is lost, the normal interaction between body<br />
and brain is severed, but with its state-of-the-art bionic technology, Össur has<br />
been able to replicate this link and develop intelligent prosthetics that think<br />
for themselves. The actions of walking, running and even ascending stairs are<br />
now closer than ever to natural motion.<br />
teXtile<br />
Össur’s textile manufacturing produces high quality stockings and support<br />
tights, used extensively in compression therapy to tackle poor circulation.<br />
The Company draws on decades of cotton weaving experience and today uses<br />
modern, high-precision equipment to deliver the right degree of support for<br />
individual needs. Neoprene is another of Össur’s specialties, used mainly for<br />
thermotherapy in order to reduce swelling.<br />
<strong>annual</strong> report 09<br />
24<br />
coMposites<br />
Through its patented designs incorporating layered carbon fiber, Össur has<br />
created prosthetic feet that are able to store and return energy to the user<br />
as they walk, improving stability, energy efficiency and gait. The special<br />
layering process is optimized through extensive computer analysis and<br />
mechanical testing; ensuring motion is proportional to the impact and the<br />
user’s weight. More recently, carbon fiber and its beneficial properties have been<br />
utilized by Össur in a wide range of braces, as well as artificial knees.<br />
silicone<br />
Össur has worked with silicone for close to forty years, developing an<br />
extensive knowledge of the material, the best manufacturing processes and<br />
applications. Össur’s silicone proprietary formulations provide the right level<br />
of softness and strength to suit a user’s individual needs.<br />
Mechanics<br />
Össur’s mechanical expertise is founded in decades of development of<br />
prosthetic knees, components and the creation of functional design and<br />
advanced control systems, all using lightweight, strong and durable alloys.<br />
Today, this competence is utilized in the development of almost all product<br />
designs.
R&D is essential to future development of the Company that is determined<br />
to maintain its technological competency through investment in research<br />
and development activities.<br />
intellectual property<br />
The role of intellectual property management at Össur<br />
is to implement IP strategies in alignment with the<br />
Company’s overall business objectives. IP functions<br />
are strategic alignment, portfolio management – assuring<br />
necessary freedom to commercial exploitation –<br />
licensing and IP conflict management.<br />
Össur’s intellectual property rights are generated<br />
through in-house innovation, acquisitions and user<br />
licenses. The Company’s IP portfolio is well diversified<br />
and representative of the business areas within the<br />
orthopaedic industry segments in which Össur operates.<br />
At the end of 2009, Össur had 349 patents granted in<br />
strategically selected countries within its portfolio, along<br />
with 364 pending patent applications. The Company’s<br />
trademark portfolio consists of 404 registered trademarks<br />
and 105 pending applications.<br />
bioMechanical and Medical<br />
platforMs<br />
Biomechanics is the application of mechanical princi-<br />
ples to the human body. In Össur’s case, it means that<br />
understanding biomechanical principles leads to products<br />
designed to meet the need for comfort, functionality<br />
and pain management. R&D’s biomechanical platform<br />
focuses on enhancing biomechanical research in order<br />
to design and validate orthotic and prosthetic devices<br />
based on current medical necessity.<br />
The Medical division of R&D focuses on clinical tests<br />
and the dissemination of clinical results, scientific collaboration<br />
with medical institutions, as well as providing<br />
clinical input for product development.<br />
25 <strong>annual</strong> report 09
huMan resources<br />
Throughout the past decade, the number of employees working at Össur has increased<br />
dramatically. Due to previous acquisitions, developing Össur’s company culture within<br />
new subsidiaries has been a challenge. However over the past three years, growth has<br />
steadied, giving the Company an opportunity to strengthen its internal structure within<br />
human resources. The focus has been on coordinating HR procedures throughout the<br />
Company in alignment with the functional structure, ensuring a professional approach<br />
that creates a global management perspective, regardless of where a subsidiary is<br />
located. This includes recruitment procedures, performance reviews, separation procedures<br />
and other human resource functions. It is important that employees feel part of<br />
one unified company where everyone is treated fairly.<br />
headcount 1989-2009<br />
1600<br />
1400<br />
1200<br />
1000<br />
800<br />
600<br />
400<br />
200<br />
0<br />
1989<br />
1990<br />
1991<br />
1992<br />
1993<br />
1994<br />
1995<br />
1996<br />
1997<br />
1998<br />
1999<br />
2000<br />
2001<br />
2002<br />
2003<br />
2004<br />
2005<br />
2006<br />
2007<br />
2008<br />
2009
talent ManageMent<br />
One of Human Resources major tasks is managing<br />
talent. The Company’s model explains how Össur wants<br />
to maintain consistency in its approach towards Talent<br />
Management. Talent Management covers the development<br />
path of all employees, from attracting high<br />
caliber candidates to the point where current employees<br />
proceed to dealing with new challenges. An emphasis<br />
is on the motivational aspect of Talent Management.<br />
Measuring an employee’s performance is an important<br />
yardstick with which to give an employee the feedback<br />
necessary in order to help him or her improve and<br />
develop talents.<br />
headcount 2009<br />
1600<br />
1200<br />
800<br />
400<br />
0<br />
72<br />
CF<br />
783<br />
M&O<br />
101<br />
R&D<br />
584<br />
S&M<br />
1540<br />
Total<br />
In 2009 a 360° management evaluation was conducted<br />
to improve managers’ capabilities. The results evaluated<br />
managers’ competence in guiding employees down the<br />
right path, a path beneficial to both the Company and<br />
its employees.<br />
core values<br />
Össur’s main focus within Human Resources has been<br />
on maintaining the culture the Company has established<br />
and sustained throughout its history. This has been a<br />
vital part of Össur’s success story. The Company’s core<br />
values have guided employee decision making and<br />
behavior towards other employees and Össur’s customers.<br />
Experienced employees play a significant role<br />
gender ratio<br />
52%<br />
48%<br />
Female<br />
Male<br />
in enabling new employees to adapt to the Company<br />
culture, making it easier for new employees to reach<br />
their full potential. Össur’s core values are an intangible<br />
asset that is treated as a precious property.<br />
In today’s turbulent working environment, it is important<br />
to maintain employee satisfaction. The most<br />
efficient way to do so is through motivation, creating<br />
a working environment where employees feel comfortable<br />
improves their success at Össur. It is important<br />
to cultivate and maintain the sense of pride Össur<br />
employees have felt throughout the Company’s history.<br />
Employees should be made aware of how their work<br />
forwards Össur’s mission: enabling the customers to live<br />
life without limitations.<br />
education/qualification<br />
46%<br />
40%<br />
14%<br />
University<br />
Degree<br />
Vocational or<br />
Technical Training<br />
Other<br />
27 <strong>annual</strong> report 09
acquisition history<br />
Throughout its history, Össur has transformed from a prosthetic company into<br />
a leading global provider of non-invasive orthopaedics. Össur has a proven track<br />
record of competence in continuously increasing product value through innovation<br />
as well as growing externally through strategic acquisitions.<br />
Since 2000, Össur has acquired a total of fourteen companies. From 2000 to 2003<br />
the acquisition strategy was focused on strengthening the prosthetic business. The<br />
following acquisitions have primarily focused on creating and strengthening Össur’s<br />
bracing and supports business, most notably with the transformational acquisitions<br />
of the US-based Royce Medical in 2005, which provided Össur with an entry into the<br />
bracing and supports business, and Gibaud in France in late 2006.<br />
In 2010 Össur will continue monitoring the market with respect to further acquisition<br />
opportunities. The focus will be mostly on “bolt-on” acquisitions, i.e. acquisitions<br />
aligned to the Company’s core strategy and vision of being a leading player in<br />
non-invasive orthopaedics. This will include seeking opportunities to broaden the<br />
product portfolio, adding customer groups and strengthening sales areas.
transforming through acquisitions<br />
acquiring access to new markets,<br />
products and technologies<br />
usa<br />
2000 Flex-Foot, Inc.<br />
Century XXII Innovations, Inc.<br />
2003 Generation II Group, Inc.<br />
2005 Royce Medical, Inc.<br />
europe<br />
2000 Pi Medical AB, Sweeden<br />
Karlsson & Bergström AB, Sweden<br />
2003 Linea Orthopedics AB, Sweden<br />
2005 Innovative Medical Prod. Ltd., UK<br />
GBM Medical AB, Sweden<br />
2006 Innovation Sports, Inc. 2006 Gibaud Group, France<br />
2009 Team Makena, LLC<br />
2007 Somas, Netherlands<br />
australia<br />
2005 Advanced Prosthetic Components<br />
Product/technology<br />
Sales channel access<br />
Both<br />
29 <strong>annual</strong> report 09
Redesigned and launched in 2009, the RHEO KNEE<br />
is an advanced prosthetic device that liberates its<br />
users to focus on their chosen activity, instead of<br />
having to think about how they are walking. Using<br />
sophisticated artificial intelligence, it continuously<br />
learns and adapts to an amputee’s walking style<br />
and environment.
corporate governance<br />
In line with the Company’s core vaules of honesty and courage, Össur focuses on good<br />
corporate governance and the benefits they provide. The framework for the Company’s<br />
corporate goverance practices is decscribed below.<br />
corporate governance stateMent<br />
1. the coMpany’s corporate governance rules<br />
The Company follows the Icelandic Guidelines on Corporate Governance issued in June<br />
2009 by Iceland Chamber of Commerce, the Confederation of Icelandic Employers and<br />
NASDAQ OMX Iceland, in accordance with Clause 2.25.3 in the Rules for issuers of<br />
financial instruments on NASDAQ OMX Iceland, issued in July 2008. The Guidelines<br />
can be found on the website of the Icelandic Chamber of Commerce, www.chamber.is.<br />
According to Clause 4.3 in the Rules for issuers of shares on NASDAQ OMX Copenhagen,<br />
issued in July 2008, the Company is not subject to the Danish Recommendations for<br />
Corporate Governance, issued in December 2008 by the Danish Corporate Governance<br />
Committee. However, the Company’s aim is to be in general compliance with the<br />
Recommendations. The Recommendations can be found on the website of the Danish<br />
Corporate Governance Committee, www.corporategovernance.dk.<br />
2. departures froM the icelandic guidelines on corporate<br />
governance<br />
In general, the Company is in compliance with the Icelandic Guidelines on Corporate<br />
Governance.<br />
The Board of Directors has not issued a specific written code of ethics and social<br />
responsibility for the Company but plans to do so. See further information in item 4.
The Board of Directors evaluates, at least once a year, the<br />
performance of the CEO, but not specifically the performance<br />
of other members of Executive Management. The<br />
CEO hires the other members of Executive Management<br />
and is responsible towards the Board for their performance.<br />
The CEO evaluates at least once a year the performance<br />
of the members of Executive Management.<br />
See further information in item 11.<br />
The Board of Directors has not established a nomination<br />
committee. In the Board’s opinion such a committee is<br />
currently not necessary taking into account the size of<br />
the Board and the balanced and relevant expertise and<br />
experience of the current Board Members.<br />
3. description of the Main aspects of<br />
internal controls and the coMpany’s<br />
risk ManageMent in connection With<br />
the preparation of financial stateMents<br />
eXternal audit<br />
An auditing firm is elected at the Annual General<br />
Meeting for a term of one year. The auditors are not<br />
allowed to own shares in the Company. The auditor<br />
shall examine the Company’s Consolidated Financial<br />
Statements in accordance with international standards<br />
on auditing, and shall, for this purpose, inspect account<br />
records and other material relating to the operation and<br />
financial position of the Company. The auditors shall at<br />
all times have access to all of the Company’s books and<br />
documents. The auditor reports any significant findings<br />
regarding accounting matters and any significant internal<br />
control deficiencies via the Audit Committee to the<br />
Board in the Audit Memorandum.<br />
The elected chartered accountant of Össur hf. is Deloitte<br />
hf. Auditors on their behalf are Sigurður Páll Hauksson,<br />
CPA, born in 1968, and Þorsteinn Pétur Guðjónsson,<br />
CPA, born in 1976. Deloitte hf. has been Össur’s auditor<br />
since the Company’s founding in 1971. Mr. Hauksson<br />
has acted on its behalf since September 2006 and<br />
Mr. Guðjónsson since 2008.<br />
internal control<br />
Össur’s risk management and internal controls in relation<br />
to financial processes are designed with the purpose<br />
of effectively controlling the risk of material misstatements.<br />
The Company designs its processes to ensure<br />
that there are no material weaknesses in the internal<br />
controls that could lead to a material misstatement in<br />
its financial reporting. The auditor’s evaluation of these<br />
processes are included in the Audit Memorandum.<br />
4. the coMpany’s values, code of ethics<br />
and social responsibility policy<br />
corporate social responsibility<br />
Össur assumes responsibility for the Company’s impact<br />
on society and the environment through its products,<br />
manufacturing and other related activities.<br />
Together, Össur’s values – Honesty, Frugality, and<br />
Courage – constitute a strong foundation for the<br />
Company’s corporate culture. The values serve as guidelines<br />
for the employees’ behavior and are considered<br />
when hiring, thus enabling Össur to build a company<br />
with employees who are responsible citizens and strong<br />
representatives of Össur. Great emphasis is placed on<br />
communicating the Company´s value-based business<br />
ethics to all staff.<br />
Össur always emphasized fair operating practices. The<br />
Company’s employees and its preferred manufacturers<br />
are requested to adhere to a Code of Conduct, and the<br />
Company performs audits four times each year to ensure<br />
that the Code is honored.<br />
The Code of Conduct requires manufacturers, e.g.,<br />
⋅ to not employ individuals under the minimum age<br />
established by local law or the age at which compulsory<br />
schooling has ended, whichever is greater, but<br />
in no case under the age of 14,<br />
⋅ to pay a certain minimum compensation,<br />
⋅ to provide one day off in seven and require no more<br />
than 60 hours of work per week or to comply with<br />
local limits if they are lower, and<br />
⋅ to certify that they have written health- and safety<br />
guidelines, including those applying to employee<br />
residential facilities, where applicable.<br />
Going forward, Össur will consider using recognized<br />
and formalized reporting standards that set out principles<br />
and indicators, by which the Company can measure<br />
and report the progress in its economic, environmental<br />
and social performance.<br />
5. description of the coMposition and<br />
activities of the board of directors<br />
and its sub-coMMittees as Well as the<br />
eXecutive ManageMent<br />
board of directors<br />
The Board is composed of four to seven members, currently<br />
five, each elected at the Annual General Meeting<br />
33 <strong>annual</strong> report 09
for a term of one year. Board Members elect a Chairman<br />
and vice-Chairman from within their own ranks.<br />
The Board is the supreme authority in the affairs of the<br />
Company between Shareholders’ Meetings.<br />
The Board shall operate in accordance with the<br />
Company’s Articles of Association and the Board’s Rules<br />
of Procedure. The principal duties of the Board are the<br />
following:<br />
⋅ Appoint a CEO and decide on his/her salary and the<br />
terms of employment, establish terms of reference<br />
and supervise his/her work.<br />
⋅ Supervise continuously and precisely all aspects<br />
of the Company's operations and ensure that the<br />
Company's organization and activities are always<br />
in good and proper order. In particular, the Board<br />
of Directors shall ensure adequate supervision of<br />
the accounts and disposal of the Company’s financial<br />
assets and at least once a year confirm the<br />
Company’s operating plan and budget.<br />
⋅ Establish goals for the Company in accordance with<br />
the Company’s objectives pursuant to the Articles of<br />
Association and formulate the policy and strategy<br />
required to achieve these goals.<br />
The presence of a majority of Board Members at Board<br />
Meetings constitutes a quorum. Important decisions,<br />
however, may not be taken unless all Board Members<br />
have had the opportunity to discuss the matter, if possible.<br />
All matters brought before the Board shall be<br />
decided by a simple majority. In the event of an equality<br />
<strong>annual</strong> report 09<br />
34<br />
of votes, the Chairman of the Board shall cast the deciding<br />
vote.<br />
audit coMMittee<br />
The Audit Committee is composed of all the Board<br />
Members.<br />
The Audit Committee is only acting as an advisor to<br />
the Board and has no authority to take any decision on<br />
behalf of the Board.<br />
The Audit Committee shall operate in accordance with<br />
its Rules of Procedure. The principal duty of the Audit<br />
Committee is to ensure the quality of the Company’s<br />
Consolidated Financial Statements and other financial<br />
information and the independence of the Company’s<br />
Auditors.<br />
reMuneration coMMittee<br />
The Remuneration Committee is composed of three<br />
Board Members: Niels Jacobsen, Þórður Magnússon<br />
and Svafa Grönfeldt.<br />
The Remuneration Committee is only acting as an advisor<br />
to the Board and has no authority to take any decision<br />
on behalf of the Board.<br />
The Remuneration Committee shall operate in accordance<br />
with its Rules of Procedure. The principal duty of<br />
the Remuneration Committee is to establish and review<br />
the Remuneration Policy for the Company.<br />
eXecutive ManageMent<br />
The Executive Management is composed of the CEO and<br />
five other members.<br />
Jón Sigurðsson, President & CEO, is responsible for the<br />
day-to-day operation of the Company. Further information<br />
on the CEO and his duties can be found in item 12.<br />
Other Members of the Executive Management:<br />
⋅ Egill Jónsson, vice President of Manufacturing and<br />
Operations.<br />
⋅ Hilmar Bragi Janusson, vice President of Research<br />
and Development.<br />
⋅ Hjörleifur Pálsson, CFO.<br />
⋅ Mahesh Mansukhani, President of Össur Americas.<br />
⋅ Ólafur Gylfason, Managing Director of Össur EMEA.<br />
The Executive Management generally holds meetings<br />
once a week.<br />
6. arrangeMent of the appointMent of<br />
sub-coMMittee MeMbers<br />
Sub-committee members are appointed by the Board of<br />
Directors for a term of one year.<br />
The Audit Committee is composed of all the Board<br />
Members, unless the Board of Directors decides otherwise.<br />
The majority of the Audit Committee shall be independent<br />
of the Company, the Executive Management<br />
and the Company’s Auditor. At least one member shall<br />
be independent of major shareholders. The Members<br />
of the Audit Committee shall possess the knowledge<br />
and expertise needed to perform the tasks of the Audit<br />
Committee. At least one member shall have solid knowledge<br />
and experience in the field of financial statements<br />
or auditing.
The Remuneration Committee is composed of three<br />
Board Members, unless the Board of Directors decides<br />
otherwise. The majority of the Remuneration Committee<br />
shall be independent of the Company and the Executive<br />
Management. The Members of the Remuneration<br />
Committee shall possess the knowledge and expertise<br />
needed to perform the tasks of the Remuneration<br />
Committee.<br />
7. inforMation on the nuMber of board<br />
Meetings and sub-coMMittee Meetings as<br />
Well as their attendance<br />
The Board of Directors had nine Board Meetings in 2009.<br />
The Audit Committee and the Remuneration Committee<br />
had one meeting each that year. All the meetings were<br />
fully attended.<br />
8. inforMation on access to the Written<br />
rules of procedure for the board of<br />
directors and its sub-coMMittees<br />
The rules of procedures for the Board of Directors, the Audit<br />
Committee and the Remuneration Committee can be found<br />
on the Company’s website: www.ossur.com/investors<br />
9. inforMation on board MeMbers<br />
Information on Board Members is on page 37.<br />
10. inforMation on Which board<br />
MeMbers are independent of the<br />
coMpany and its MaJor shareholders<br />
The Board of Directors has made an assessment on<br />
which Board Members are independent according to<br />
the Icelandic Guidelines on Corporate Governance. All<br />
the Board Members are considered independent of the<br />
Company and two of them, Kristján Tómas Ragnarsson<br />
and Svafa Grönfeldt, are also independent of the<br />
Company’s major shareholders.<br />
11. principal aspects in the board of<br />
directors’ perforMance assessMent<br />
At least once a year the Board of Directors evaluates the<br />
Board and its sub-committees’ work, practices, size and<br />
composition, as well as the contribution of each Board<br />
Member. The Board’s aim is to discharge its duties in<br />
an efficient manner with integrity in the best interest of<br />
the Company. The Board evaluates its work in general,<br />
including whether important matters have been well<br />
prepared and discussed in a constructive way within the<br />
Board. When evaluating its size and composition, the<br />
Board e.g. takes into account the Company’s operations,<br />
policies and practices and the knowledge, experience<br />
and expertise of each Board Member.<br />
The Board also evaluates the work and results of the<br />
CEO each year according to previously established criteria,<br />
including whether the CEO has prepared and carried<br />
out a business strategy consistent with the established<br />
goals.<br />
The Chairman of the Board is in charge of the evaluation<br />
processes. The Chairman may seek external assistance<br />
as deemed appropriate. The Board discusses the results<br />
of the assessments and decides which actions are to be<br />
taken, if any.<br />
The CEO is responsible for the work and results of<br />
Executive Management. At least once a year the CEO<br />
evaluates the work and results of Executive Management<br />
35 <strong>annual</strong> report 09
according to previously established criteria. The CEO<br />
discusses the results of the assessment with each member<br />
of Executive Management and decides which actions<br />
are to be taken, if any.<br />
At least once a year the Chairman and the CEO have a<br />
meeting to discuss the results of the Board’s assessment<br />
of the CEO’s work and results and the proposed actions<br />
be taken, if any. The CEO informs the Chairman of the<br />
results of his evaluation of the Executive Management<br />
and which actions will be taken, if any. The Chairman<br />
shall inform the Board of the discussions with the CEO<br />
as he deems necessary and appropriate.<br />
12. inforMation on the coMpany’s ceo<br />
and a description of his Main duties<br />
Information on Jón Sigurðsson, President & CEO, is on<br />
page 17.<br />
The principal duties of the CEO are the following:<br />
⋅ He is responsible for daily operations and is obliged<br />
to follow the Board’s policy and instructions in that<br />
regard. The daily operations do not include measures<br />
which are unusual or extraordinary. The CEO<br />
may only take such measures if specially authorized<br />
by the Board, unless it is impossible to wait for the<br />
Board’s decision without substantial disadvantage<br />
to the Company’s operations. In such an event the<br />
CEO shall inform the Board of his measures, without<br />
delay.<br />
⋅ He shall normally act as chairman in the Company’s<br />
subsidiaries which are connected with the sales and<br />
<strong>annual</strong> report 09<br />
36<br />
manufacturing activities and/or the core activities of<br />
the Company.<br />
⋅ He is responsible for the work and results of the<br />
Executive Management. See further information in<br />
item 11.<br />
⋅ He shall ensure that the Consolidated Financial<br />
Statements of the Company conform to the law and<br />
accepted practices and that the treatment of the<br />
property of the Company is secure. The CEO shall<br />
provide any information that may be requested by<br />
the Company’s Auditors.<br />
13. inforMation on violations of laWs<br />
and regulations that the appropriate<br />
supervisory or ruling body has<br />
deterMined<br />
No violations of laws and regulations were determined<br />
in 2009 by supervisory or ruling body.<br />
14. arrangeMent of coMMunications<br />
betWeen shareholders and the board of<br />
directors<br />
In accordance with the Company’s Articles of Association<br />
and the Icelandic Companies Act, the primary communication<br />
between shareholders and the Board of<br />
Directors is at the Annual General Meeting and other<br />
Shareholders’ Meetings. Shareholders have e.g. the right<br />
to put items on the agenda of Shareholders’ Meetings<br />
and submit proposals.<br />
To maintain a consistent and direct dialogue with shareholders,<br />
the Board has approved an Investor Relations<br />
Policy, available on the Company’s website: www.ossur.<br />
com/investors<br />
The objective of the Investor Relations Policy is to disclose<br />
financial and corporate information providing<br />
investors, analysts and other stakeholders with comprehensive<br />
and accurate information to improve the understanding<br />
of the current and expected future of Össur.<br />
Össur’s communication to shareholders and the market<br />
shall be in compliance with relevant regulatory bodies at<br />
all times and disseminated via a recognized distribution<br />
vehicles.<br />
15. analysis of environMental factors<br />
and social factors<br />
The Annual Report contains analysis of environmental<br />
factors and social factors that help to understand the<br />
development, success and position of the Company.
BOARD OF DIRECTORS & CEO<br />
Mr. Nielsen, Mr. Magnússon, Mr. Jacobsen, Chairman of the Board, Ms. Grönfeldt, Mr. Sigurðsson, President & CEO, Mr. Ragnarsson.<br />
board of directors<br />
ARNE BOYE NIELSEN, Member of the Board of Directors, born in 1968, residing in Denmark. He<br />
became a Board Member in 2009. Mr. Nielsen has spent his entire career with William Demant<br />
Holding A/S in various and expanding roles throughout the world. After working as a management<br />
assistant for Mr. Niels Jacobsen and as an interim general manager of Oticon Australia Pty Ltd., Mr.<br />
Nielsen assumed in 1996 his current position as President of Diagnostic Instruments, which has<br />
operations worldwide. In 2003, he became a member of the management group in William Demant<br />
Holding A/S. Mr. Nielsen is a member of the board of Sennheiser Communications A/S and Phonic<br />
Ear A/S as well as president of Interacoustics A/S and director of Maico Diagnostic in Berlin, Germany.<br />
Mr. Nielsen has a BSc degree and a MSc degree in Business Administration from the Copenhagen<br />
Business School in Denmark. He neither has shares nor share options in the Company. Mr. Nielsen<br />
was nominated to the Board by William Demant Invest, the Company’s largest shareholder. He has<br />
no interest links with the Company’s main clients or competitors.<br />
ÞÓRðUR MAGNÚSSON, vice Chairman of the Board of Directors, born 1949, residing in Iceland.<br />
He became a Board Member in 2005 and has been the vice Chairman of the Board since 2006. Mr.<br />
Magnússon is the chairman of the investment company Eyrir Invest. He is also a board member<br />
of numerous Icelandic companies, including the retail companies Byko, Kaupás and Norvik and is<br />
chairman of the board of Marorka, an energy-efficiency systems company, as well as Calidris and<br />
Handpoint. Mr. Magnússon is also a member of the board of the Iceland Chamber of Commerce<br />
and Reykjavík University. Mr. Magnússon was CFO at Eimskip for over 20 years. He has a Business<br />
degree from the University of Iceland and holds an MBA from the University of Minnesota in the<br />
United States. Mr. Magnússon and related parties hold 8,456 shares in the Company, but he holds no<br />
share options. Mr. Magnússon is chairman of the board and a major shareholder in Eyrir Invest, the<br />
Company’s second-largest shareholder, which holds 85,440,215 shares in the Company. He has no<br />
interest links with the Company’s main clients or competitors.<br />
NIELS JACOBSEN, CHAIRMAN Of THE BOARD Of DIRECTORS, Chairman of the Board of<br />
Directors, born 1957,residing in Denmark. He became a Board Member in 2005 and has been the<br />
Chairman of the Board since 2006. Mr. Jacobsen is president and CEO of William Demant Holding<br />
A/S, a Danish industrial group in the hearing healthcare field. Previous positions include president of<br />
Orion A/S and vice president in corporate affairs for both Atlas Danmark A/S and Thrige-Titan A/S.<br />
Mr. Jacobsen is also a board member of a number of Danish companies and organizations, including<br />
LEGO A/S (chairman), KIRKBI A/S (vice chairman), A.P. Møller Mærsk A/S and he holds directorships<br />
in a number of wholly and partly owned companies in the William Demant Group, including<br />
Oticon A/S (chairman), William Demant Invest A/S (chairman), Sennheiser Communications A/S<br />
(chairman), HIMPP A/S (chairman), HIMSA A/S (chairman) and HIMSA II A/S. Furthermore, he<br />
holds a seat on the central board of the Confederation of Danish Industries. Mr. Jacobsen has a<br />
MSc degree in Economics from the University of Aarhus in Denmark. He neither holds shares nor<br />
share options in the Company. Mr. Jacobsen is chairman of the board of William Demant Invest, the<br />
Company’s largest shareholder, which holds 168,694,203 shares in the Company. He has no interest<br />
links with the Company’s main clients or competitors.<br />
SVAfA GRöNfELDT, Member of the Board of Directors, born in 1965, residing in Iceland. She became<br />
a Board Member in 2008. Ms. Grönfeldt is on the board of Alvogen, an American generic pharmaceutical<br />
company. Previous positions include president of Reykjavík University, deputy to the CEO<br />
of Actavis Group hf., assistant professor in the Faculty of Economics and Business Administration<br />
at the University of Iceland and managing director and managing partner of IMG Gallup/Deloitte.<br />
Ms. Grönfeldt holds a doctorate in industrial relations from the London School of Economics. She<br />
neither holds shares nor share options in the Company. Ms. Grönfeldt has no interest links with the<br />
Company’s main clients, competitors or major shareholders.<br />
KRISTJáN T. RAGNARSSON, Member of the Board of Directors, born in 1943, residing in the United<br />
States. He became a Board Member in 1999. Mr. Ragnarsson is chairman and Lucy G. Moses professor<br />
at department of rehabilitation medicine at Mount Sinai School of Medicine, New York, United States.<br />
He is a specialist in physical medicine and rehabilitation, certified by the American Board of Physical<br />
Medicine and Rehabilitation and has been practicing physician and academician for more than 40<br />
years. Mr. Ragnarsson is currently an executive trustee of the American Scandinavian Foundation,<br />
president of the Association of Academic Physiatrists and vice president of the Foundation for<br />
Physical Medicine and Rehabilitation. Previous positions include president of American Spinal Injury<br />
Association, chairman of the board of governors Mount Sinai Faculty Practice Associates and trustee<br />
at the Mount Sinai Hospital. Mr. Ragnarsson graduated as a medical doctor from the School of<br />
Medicine of the University of Iceland. Mr. Ragnarsson and related parties hold 623,789 shares in the<br />
Company, but he holds no share options. Mr. Ragnarsson has no interest links with the Company’s<br />
main clients, competitors or major shareholders.<br />
37 <strong>annual</strong> report 09
the reMuneration and shareholding of Össur directors and eXecutives<br />
board of directors position<br />
reMuneration<br />
usd '000<br />
nuMber of<br />
shares<br />
share<br />
option<br />
option price dkk<br />
financially<br />
linked<br />
parties<br />
Niels Jacobsen (i) Chairman of the Board 50 168,694,203 0 0<br />
Þórður Magnússon (ii) vice Chairman of the Board 38 85,440,215 0 8,456<br />
Arne Boye Nielsen Board member 0 0 0 0<br />
Kristján Tómas Ragnarsson Board member 25 619,539 0 4,250<br />
Svafa Grönfeldt Board member 25 0 0 0<br />
ceo and eXecutive ManageMent<br />
Jón Sigurðsson CEO 924 11,934 1,250,000 7.2 3,234<br />
Egill Jónsson vP of Manufacturing and operations 305 818,499 308,000 7.2 4,250<br />
Hilmar Janusson vP of R&D 324 0 308,000 7.2<br />
Hjörleifur Pálsson CFO 382 0 308,000 7.2 0<br />
Mahesh Mansukani President of Össur Americas 514 0 500,000 5.4<br />
Ólafur Gylfason Managing Director of Össur EMEA 545 0 308,000 7.2 0<br />
vesting date for all share options is 1.12.2011 except for Mahesh Mansukani, where vesting date is 15.7.2012<br />
(i) Shares owned by William Demant Invest A/S which Niels Jacobsen represents on the Board<br />
(ii) Shares owned by Eyrir Invest ehf. of which Þórður Magnússon owns 20.3% and is the chairman of the Board<br />
<strong>annual</strong> report 09<br />
38<br />
reMuneration
the reMuneration policy<br />
of Össur hf.<br />
in accordance With article 79.a. of<br />
the act respecting liMited liability<br />
coMpanies no. 2/1995<br />
⋅ It is the policy and priority of Össur hf. to attract and<br />
retain exceptional employees. In order to achieve<br />
this, the Company must have in place a competitive<br />
compensation structure in each of its operations.<br />
This remuneration policy is designed and implemented<br />
to ensure the alignment of interest of the<br />
long-term shareholders of Össur hf. and its employees<br />
and other stakeholders, in a principled, simple,<br />
and transparent way.<br />
⋅ In addition to base salary, Össur hf. (the<br />
“Company”), provides employees with necessary<br />
working equipment. The Company compensates<br />
managers and employees with other payments,<br />
reimbursements and other rewards.<br />
⋅ Performance-linked payments and benefits. The<br />
Company can pay bonuses that reflect individual<br />
contributions to the Company’s projects, specific divisions<br />
or the Company as a whole. Managers will be<br />
provided with vehicles only in exceptional cases.<br />
⋅ With share options. The Board of Directors of<br />
Össur hf. (the “Board”) can offer employees share<br />
options in the Company. The strike price of such<br />
share options agreements shall never be below the<br />
market prices of the Company’s shares at the time<br />
of issuing. All share option agreements offered to<br />
the managers of the Company will be laid before a<br />
shareholders’ meeting for approval. Össur’s <strong>annual</strong><br />
report always discloses the share options held by<br />
managers and members of the Board. The Board can<br />
in exceptional circumstances provide the Company’s<br />
managers with sales rights on their options of shares<br />
in the Company.<br />
⋅ Össur hf. does not provide managers or other<br />
employees with loans or guarantees in relation<br />
to purchase of shares in the Company, as authorized<br />
in the 2nd paragraph of Article 104 in the Act<br />
respecting Public Limited Companies, or for other<br />
purposes, except in exceptional circumstances.<br />
Such instances are always subject to the approval of<br />
the Board.<br />
⋅ Össur hf. pays the employer’s share to pension funds<br />
for employees in accordance with applicable laws<br />
and general labor contracts. The Company does not<br />
enter into special pension fund agreements, and<br />
no such agreements exist. The Company, in<br />
exceptional circumstances, pays an additional<br />
pension contribution for managers, never exceeding<br />
20% of their <strong>annual</strong> salary.<br />
⋅ Össur hf. does not enter into special retirement<br />
agreements with managers and other employees,<br />
but prefers to have mutual termination clauses<br />
apply as practiced on the labor market. Össur’s<br />
employees have a three-months notice clause in accordance<br />
with employment agreements or general<br />
union labor requirements. The Board reserves the<br />
right to approve, in specific instances, a termination<br />
notice up to 12 [twelve] months, particularly in the<br />
case of managers located abroad. Currently, some<br />
managers have a termination clause of up to 12<br />
[twelve] months.<br />
⋅ The remuneration of the Board of Directors is<br />
approved, with forward effect for one year at a<br />
time, by the Company’s Annual General Meeting, in<br />
accordance with Company Law.<br />
This Remuneration Policy is reviewed once a year<br />
by The Board of Directors of Össur hf.<br />
39 <strong>annual</strong> report 09
○○ MiaMi luMbar <br />
The Miami Lumbar is an easy-to-use spinal orthosis<br />
for post-surgical immobilization, pain relief, and<br />
the protection of injured ligaments or muscles. The<br />
superior anatomical design follows the contours<br />
of the spine while simultaneously ensuring better<br />
immobilization and comfort. A modular system, it<br />
enables step-down treatment options for every state<br />
of the recovery process.
isk factors<br />
Investment in Össur’s shares involves a high degree of risk. Össur’s business, financial<br />
condition and results of operation going forward rest upon certain assumptions and<br />
could be seriously harmed by any of the occurrences described below. No assurance<br />
can be given that the Company’s assumptions will prove to be correct. Furthermore,<br />
additional risks and uncertainties not presently known to Össur, or that it currently<br />
deems immaterial, may also adversely affect its business operations and financial<br />
results. The risk factors discussed below are not listed in any order of priority.<br />
general risks<br />
responsible: Jón sigurðsson, president & ceo<br />
Össur’s assumptions regarding market trends may prove incorrect.<br />
Assumptions regarding demographic trends are important to Össur. The Company<br />
expects, for example, that the population of elderly will continue to grow, an increasing<br />
proportion of this population will live an active lifestyle and that the number of people<br />
with diabetes will increase in the future. No assurance can be given that these assumptions<br />
will prove to be correct or that these demographic trends will result in demand<br />
for the Company’s products.<br />
Össur is subject to risks related to its international operations.<br />
Headquartered in Reykjavík, Iceland, Össur has significant operations in the United<br />
States and Europe and also has operations in Asia. Össur’s business and results of<br />
operations are therefore subject to various risks inherent to international operations.<br />
Such risks include, among others recessionary trends, inflation or instability of financial<br />
markets, exposure to different legal standards and enforcement mechanisms, trade<br />
barriers, rules regarding the origins of products, labor unrest, foreign exchange controls<br />
and restrictions on repatriation of funds and political and social instability.
Product liability claims could adversely impact Össur’s<br />
financial condition and results of operations and impair<br />
its reputation.<br />
Össur is responsible for the safety and effectiveness of<br />
its products. Although Össur engages in internal quality<br />
control and product testing procedures, Össur cannot<br />
guarantee that it will not be found liable for a product<br />
liability claim in the future or that insurance coverage will<br />
be sufficient or continue to be available on commercially<br />
reasonable terms.<br />
Össur’s business is subject to healthcare industry<br />
reforms and legislative and regulatory changes that<br />
could result in reduced sales of its products.<br />
Most of Össur’s customers rely on third-party payers,<br />
including both government healthcare programs and<br />
private health insurance plans, to cover and reimburse<br />
some or all of the costs associated with Össur’s products.<br />
All third-party payers, whether governmental or<br />
commercial, are developing increasingly sophisticated<br />
methods of controlling healthcare costs. These costcontrol<br />
methods also potentially limit the coverage and<br />
the amount of payment for which governmental and<br />
third-party payers may be willing to pay for medical<br />
products. As such, the continuing efforts of both governmental<br />
and private payers of healthcare costs to contain<br />
or reduce costs could lead to patients being unable<br />
to obtain approval for payment from these third-party<br />
payers. If that were to occur, sales of Össur’s products<br />
may decline significantly and its customers may reduce<br />
or eliminate purchases of its products. Further, future<br />
legislative or regulatory initiatives directed at reducing<br />
costs could be introduced at either the federal or state<br />
level. The Company cannot predict the impact of future<br />
legislative or regulatory initiatives on its business.<br />
Össur’s failure to comply with regulatory requirements,<br />
or receive regulatory clearance, or approval for its products<br />
or operations, including healthcare fraud and abuse<br />
laws and regulations, would adversely affect Össur’s revenues<br />
and potential for future growth.<br />
Össur’s products are medical devices that are subject<br />
to extensive regulation in the United States by the<br />
Food and Drug Administration (FDA), and by respective<br />
authorities in foreign countries where Össur does business.<br />
Such regulation can regulate virtually all aspects<br />
of a medical device’s design and testing, manufacture,<br />
safety, labeling, storage, recordkeeping, reporting, clearance<br />
and approval, promotion and distribution. Failure<br />
to comply with the regulatory requirements of the applicable<br />
authority may subject a company to administrative<br />
or judicially imposed sanctions ranging from warning<br />
letters to criminal penalties or product withdrawal.<br />
risks related to finance<br />
responsible: hJÖrleifur pálsson, chief financial<br />
officer<br />
Össur may fail to continue to grow through acquisitions.<br />
A significant proportion of Össur’s growth in recent<br />
years has been driven by acquisitions. No assurance<br />
can be given that Össur will be successful in identifying<br />
appropriate acquisition candidates in the key markets<br />
in which Össur operates or desires to operate.<br />
Össur may also be unable to complete acquisitions<br />
of targets in a timely manner or on acceptable terms.<br />
Acquisitions involve a number of other risks, including,<br />
among others, diversion of management resources and<br />
management focus, difficulties integrating the acquired<br />
business with Össur’s existing business, unexpected or<br />
high integration costs, a failure to retain key employees<br />
of the acquired business, a failure to attain the synergies<br />
expected from completing the acquisition.<br />
Össur is exposed to financing risk and financial markets<br />
instability.<br />
Össur had around US dollar 80 million in cash on its<br />
balance sheet at yearend 2009 and is therefore subject<br />
to counterparty risk. Össur’s debt financing currently<br />
originates from the Icelandic banking system which has<br />
limited access to international markets. Össur’s functional<br />
and reporting currency is the US dollar. In addition,<br />
a large portion of the Company’s indebtedness is<br />
denominated in US dollars as are the majority of its revenues<br />
and expenses. However, a significant portion of<br />
the Company’s revenues and expenses are denominated<br />
in euro. Because there is a currency mismatch between<br />
Össur’s revenues and costs, fluctuations in exchange<br />
rates, mainly between the US dollar and the euro and<br />
Icelandic krona, could adversely affect Össur’s financial<br />
condition and results of operations.<br />
Össur’s financing structure within the consolidation is<br />
subject to laws and governmental approvals.<br />
Össur finances certain subsidiaries internally through<br />
its Swiss financial branch. The purpose of the branch is<br />
to minimize corporate taxation by taking advantage of<br />
the favorable taxation of Swiss financial branches. The<br />
financing structure results in tax deductions in countries<br />
where tax is higher than that imposed on the financing<br />
branch. No assurance can be given that the relevant laws<br />
and regulations will remain unchanged.<br />
Össur is dependant on IT systems<br />
Össur’s business is supported by several systems. The<br />
systems that are classified as mission critical are the<br />
43 <strong>annual</strong> report 09
ERP system, the voIP phone system and the Exchange/<br />
Outlook email system. Despite redundancy and backup<br />
efforts to mitigate risks, those systems can fail with<br />
serious influence on the business. Without the ERP system<br />
working the ability to receive orders and complete<br />
shippings is seriously reduced.<br />
risks related to research &<br />
developMent<br />
responsible: hilMar bragi Janusson,<br />
vice president of r&d<br />
Össur may be adversely affected by developments in<br />
medicine.<br />
Össur’s main products are intended to improve the quality<br />
of life for individuals suffering the effects of accidents<br />
or illnesses that are currently incurable. No assurance<br />
can be given that Össur’s target market will not be materially<br />
diminished by advances in medical science, or that<br />
Össur will be able to generate comparable revenue from<br />
alternative market segments.<br />
<strong>annual</strong> report 09<br />
44<br />
Össur may be unable to develop or secure the use of new<br />
technologies.<br />
Össur operates in markets that are characterized by<br />
rapid technological change, driven by extensive research<br />
that is carried out by market participants. The development<br />
by any of Össur’s competitors of substitute products<br />
that better satisfy market demands could have a<br />
material adverse effect on Össur’s business and results<br />
of operations. A failure by Össur to develop new products<br />
or enhance existing products could have a material<br />
adverse effect on the Company.<br />
Össur is subject to risks relating to the protection of<br />
intellectual property rights.<br />
Össur relies on a combination of patents, trademarks,<br />
trade secrets and non-disclosure and non-competition<br />
agreements to protect its proprietary intellectual property,<br />
and will continue to do so. While Össur intends to<br />
defend against any threats to its intellectual property,<br />
there can be no assurance that these patents, trademarks,<br />
trade secrets or other agreements will adequately<br />
protect Össur’s intellectual property.<br />
risks related to sales &<br />
Marketing<br />
responsible: Mahesh Mansukhani, president of<br />
Össur aMericas, and ólafur gylfason, Managing<br />
director of Össur eMea<br />
Össur relies on orthopaedic professionals, and other<br />
agents in connection with the sale and distribution of<br />
its products.<br />
Össur’s sales depend primarily on the prescriptions and<br />
recommendations of its products by orthopaedic professionals.<br />
The Company has developed and maintained<br />
close relationships with a number of orthopaedics and<br />
prosthetic (O&P) workshops that support and recommend<br />
the Company’s products. A failure to maintain the<br />
support of such orthopaedics professionals and O&P<br />
workshops or a failure to develop relationships with<br />
new orthopaedic professionals and O&P workshops<br />
could adversely affect Össur’s business and results of<br />
operations.
Össur’s aim is to maintain and increase its position as a<br />
market leader in non-invasive orthopaedics<br />
Össur’s aim is to play a leading role in the likely continuance<br />
of consolidation in its markets. Össur’s success<br />
thereof is subject to multiple factors both internal<br />
and external. As for external factors the risk remains that<br />
competitors accelerate the consolidation of the market,<br />
and strengthen their own position, at the expense of<br />
other participants like Össur.<br />
Össur relies on agents and third-party distributors in<br />
connection with the sale and distribution of its products.<br />
Third-party agents and distributors sell some of Össur’s<br />
products. The Company’s largest wholesale customer<br />
accounted for 6% of the Company’s net revenues for<br />
the year ended December 31, 2009. Other distributors<br />
accounted for less than 2% of net revenues for the same<br />
period. These agents and distributors are not employees<br />
of Össur, and Össur may be unable to influence their<br />
actions and performance.<br />
risks related to Manufacturing<br />
& operations<br />
responsible: egill Jónsson, vice president of M&o<br />
Össur is vulnerable to disruptions to its production<br />
facilities.<br />
Össur’s production facilities may be adversely affected<br />
by man-made or natural disasters. An occurrence of such<br />
a disaster or the disruption of Össur’s production for<br />
any other reason could adversely affect the Company’s<br />
production output, which, in turn, would impair the<br />
Company’s ability to fulfil customer orders. This could<br />
lead to a decline in sales and increased costs due to necessary<br />
shifts in production within the Company and the<br />
possible need to outsource production. The Company<br />
maintains insurance to cover such losses relating to<br />
man-made and natural disasters. No assurance can be<br />
given, however, that insurance payments would be sufficient<br />
to cover the full loss resulting from a disruption<br />
in Össur’s production or that Össur’s insurance would<br />
cover the event that causes such a disruption.<br />
Össur is dependent on certain raw materials.<br />
Össur’s products require silicone and carbon, metals<br />
and other raw materials. Such raw materials may not<br />
always be available on favorable terms, or at all.<br />
45 <strong>annual</strong> report 09
Össur shares<br />
Össur has been listed on NASDAQ OMX in Iceland since 1999. In addition to the listing<br />
on Iceland’s stock exchange, Össur was listed on NASDAQ OMX in Copenhagen in<br />
September 2009. The listing on NASDAQ OMX Copenhagen makes strong strategic<br />
sense for the Company as Copenhagen offers access to the international investor<br />
community, and is a recognized market for healthcare companies. The rational for<br />
the listing was to create a trading platform for investors outside of Iceland, facilitate<br />
liquidity and fair pricing. Listing and compliance requirements in Denmark and Iceland<br />
are similar, and both exchanges are part of the NASDAQ OMX Nordic group.<br />
Össur’s listing in Copenhagen has proven to be a positive step. In early November,<br />
a small equity offering of 29.5 million shares was conducted and targeted towards<br />
international investors. The shares were successfully sold to investors in five countries,<br />
diversifying the shareholders portfolio. At the end of 2009, just over 50% of the share<br />
capital was held by foreign investors. The total number of investors at yearend was<br />
2,524, compared to 2,586 at yearend 2008.<br />
MaJor shareholders<br />
Shareholders that have announced holdings above 5% to the Company are:<br />
Investor Country Holding<br />
William Demant Invest A/S Investment Fund Denmark 37.3%<br />
Eyrir Invest ehf Investment Company Iceland 18.8%<br />
ATP Pension fund Denmark 6.2%<br />
Mallard Holding Founder and family Luxemburg 5.1%<br />
The Company holds 17,992 treasury shares, the same number held at yearend 2008.<br />
No treasury shares were traded in 2009.
In 2009 Össur celebrated its 10 years of listing by ringing the NASDAQ stock<br />
market Closing Bell in New York City in November.<br />
dividend policy<br />
In 2009 dividends were not paid to Össur shareholders.<br />
In the event that an Annual General Meeting (AGM)<br />
resolves to pay dividends, the dividends will be paid to<br />
registered shareholders pursuant to the share ledger on<br />
the day of the AGM. There are no plans to pay dividends<br />
to shareholders in the near future; instead, earnings will<br />
be re-invested in the Company to help it grow for as long<br />
as the return on investment in Össur’s business yields<br />
acceptable returns.<br />
perforMance iceland<br />
turnover: usd 72.8 Million<br />
turnover rate: 20.7%<br />
voluMe: usd 88 Million shares<br />
spred: 1.05%<br />
high: 155.5<br />
loW: 71.9<br />
perforMance: 57%<br />
<strong>annual</strong> general Meeting<br />
The Company’s Annual General Meeting is held before<br />
the end of April each year. The meeting is convened<br />
using the same procedure as other shareholders meetings<br />
with at least three weeks’ notice. The results of the<br />
AGM are sent to the Stock Exchange immediately following<br />
the meeting and are also made available on the<br />
Company’s website.<br />
investor relations<br />
Placing emphasis on providing investors, analysts and<br />
other stakeholders with timely and accurate information,<br />
Össur hosts investor meetings, teleconferences and<br />
perforMance copenhagen*<br />
turnover: dkk 108.6 Million<br />
turnover rate: 13.9%<br />
voluMe: 20.9 Million shares<br />
spred: 3.22%<br />
high: 8<br />
loW: 4.7<br />
perforMance: 5%<br />
*Össur’s shares were listed on<br />
NASDAQ OMX Cph in September 2009<br />
total numBer of ShareS: 453,750,000<br />
market value at yearend 2009: USD 561 million.<br />
Stock SymBol: oSSr<br />
BloomBerg: oSS.ir<br />
reuterS: oSSr.ic<br />
internet presentations following each quarterly report,<br />
and other momentous occasions if needed.<br />
The CEO, CFO and IR manager travel frequently to<br />
London and Copenhagen to meet with current shareholders<br />
and other investors. They also visit other locations<br />
on a regular basis in order to meet with analysts,<br />
investors and other stakeholders. In the past, Össur has<br />
participated in various healthcare conferences such as<br />
the Goldman Sachs European Medtech and Healthcare<br />
Services Conference, and the Bank of America/Merrill<br />
Lynch European Healthcare Conference, both in London,<br />
as well as Piper Jaffrey Healthcare conferences in London<br />
and New York.<br />
47 <strong>annual</strong> report 09
160<br />
150<br />
140<br />
130<br />
120<br />
110<br />
100<br />
90<br />
80<br />
70<br />
ir policy<br />
2.1.2009 - 30.12.2009<br />
icl cop<br />
It is the policy of Össur to disclose financial and corporate<br />
information, providing investors, analysts and other<br />
stakeholders with comprehensive and accurate information<br />
to improve the understanding of the current and<br />
expected development of Össur.<br />
At all times, Össur complies with relevant laws and regulation,<br />
as well as the disclosure obligations of NASDAQ<br />
OMX, both in Iceland and Denmark, and adheres to the<br />
principle of granting simultaneous access to relevant<br />
information and equal treatment of all stakeholders.<br />
All press releases and announcements are disseminated<br />
via a recognized distribution vehicle. Following quarterly<br />
results, the Company hosts a meeting for investors, analysts<br />
and other stakeholders. To ensure equality between<br />
stakeholders, the quarterly meetings are web-casted in<br />
real time and are accessible through Össur’s website.<br />
Furthermore, the Company meets interested investors<br />
and analysts on a regular basis.<br />
To comply with good corporate governance, Össur does<br />
not comment on matters related to financial results<br />
or expectations in a period of six weeks prior to the<br />
announcements of the Company’s interim and full year<br />
financial results.<br />
<strong>annual</strong> report 09<br />
48<br />
7,0<br />
6,5<br />
6,0<br />
5,5<br />
5,0<br />
4,5<br />
4,0<br />
3,5<br />
3,0<br />
2,5<br />
Further details of the IR policy can be found on the<br />
Company’s website: WWW.ossur.coM/investors<br />
contact investor relations:<br />
Ms. Sigurborg Arnarsdóttir<br />
IR Manager<br />
Tel. +354-515-1339<br />
e-mail: sarnarsdottir@ossur.com.<br />
shareholder inforMation on the<br />
internet<br />
Össur’s website hosts extensive information on the<br />
Company. For example, stakeholders can read and subscribe<br />
to press releases sent to the Nasdaq/OMX Stock<br />
Exchange, monitor the price trends of their shares, utilize<br />
interactive analyst tools, read the Company’s <strong>annual</strong><br />
reports and listen to teleconferences with Company<br />
management, following conferences. A tool monitoring<br />
up-to-date recommendations by analysts is the latest<br />
addition to the IR website. The website also contains<br />
extensive information about Company products and<br />
technology.<br />
WWW.ossur.coM –WWW.ossur.coM/investors<br />
Össur hf. analysts<br />
europe<br />
ABG Sundal Collier<br />
Morten Larsen<br />
Tel: +46(8)566 28 693<br />
e-mail: morten.larsen@abgsc.se<br />
NORDEA Markets<br />
Kristian Marthedal<br />
Tel: + 45 33 33 29 72<br />
e-mail:kristian.marthedal@nordea.com<br />
Piper Jaffray<br />
Julie Simmonds<br />
Tel: +44 (0)20 3142 8747<br />
e-mail:Julie.L.Simmonds@pjc.com<br />
SEB Enskilda<br />
Niels Granholm-Leth<br />
Tel: +45 3697 7531<br />
e-mail: niels.leth@enskilda.dk<br />
Jefferies International Ltd<br />
Stephan Gasteyger<br />
Tel: +44 207 029 87 03<br />
e-mail: SGasteyger@Jefferies.com<br />
iceland<br />
IFS Ráðgjöf<br />
valdimar Halldórsson<br />
Tel: 354-533-4608<br />
e-mail: valdimar@ifs.is
publication schedule for reports<br />
First Quarter 27 April 2010<br />
Second Quarter 27 July 2010<br />
Third Quarter 26 October 2010<br />
Fourth Quarter 8 February 2011<br />
Annual General Meeting 4 March 2011<br />
press releases in 2009<br />
12/30/2009 Össur Reporting Calendar 2010<br />
12/30/2009 Össur appoints a new market maker<br />
on NASDAQ OMX Copenhagen<br />
12/3/2009 New Articles of Association<br />
following capital increase<br />
30 November 2009.<br />
11/30/2009 Total number of voting<br />
rights and capital<br />
11/30/2009 Insignificant share capital increase<br />
11/12/2009 Össur signs a new market making<br />
agreement with New Kaupthing<br />
11/12/2009 Össur signs a new market making<br />
agreement with Saga Capital<br />
11/6/2009 Changes in Major shareholdings<br />
11/6/2009 Össur hf: New Articles<br />
of Assosiation<br />
11/6/2009 Registration of the capital increase<br />
of 29,500,000 shares completed<br />
11/3/2009 Completion of the Offering of<br />
29,500,000 new shares<br />
11/2/2009 Össur hf. to offer up to 29,500,000<br />
new shares in a private placement<br />
at market price<br />
10/27/2009 Össur hf. - Third Quarter<br />
Report 2009<br />
10/20/2009 Össur Investor meeting<br />
Tuesday 27 October in Copenhagen<br />
9/3/2009 Össur appoints market maker on<br />
NASDAQ OMX Copenhagen<br />
9/3/2009 Össur's listing on NASDAQ OMX<br />
Copenhagen approved<br />
8/26/2009 Össur applies for listing on<br />
NASDAQ OMX Copenhagen<br />
7/28/2009 Össur hf. - Second Quarter<br />
Report 2009<br />
7/23/2009 Össur - Q2 Investor meeting<br />
Tuesday 28 July 2009<br />
4/28/2009 Össur hf. - First Quarter<br />
Report 2009<br />
4/20/2009 Össur Q1 2009 - Investor<br />
meeting Tuesday 28 April<br />
3/31/2009 Changes in major shareholding<br />
3/31/2009 Insider Trading<br />
3/31/2009 Changes in Major Shareholdings<br />
3/31/2009 Insider Trading<br />
3/24/2009 Össur Management sells shares<br />
3/24/2009 Changes in Major Shareholdings<br />
3/24/2009 Major Sharholder Cahanges<br />
3/24/2009 Insider Trading<br />
3/24/2009 Insider Trading<br />
3/24/2009 Insider Trading<br />
3/24/2009 Insider Trading<br />
3/24/2009 Insider Trading<br />
3/24/2009 Insider Trading<br />
3/24/2009 Insiders Trading<br />
3/19/2009 Statement from Össur hf.<br />
2/20/2009 Össur hf. Annual Report<br />
2/20/2009 Results of Össur hf. -<br />
Annual General Meeting<br />
2/12/2009 Össur hf. - Annual General Meeting<br />
2/6/2009 Össur hf. - Annual General Meeting<br />
2/5/2009 Össur hf. - 2008 Full Year Report<br />
2/2/2009 Össur - Investor meeting<br />
Thursday 5 February<br />
49 <strong>annual</strong> report 09
○○ vari-fleX ® With evo <br />
The well-established vari-Flex prosthetic foot from<br />
the Flex-Foot ® product family now incorporates<br />
Energy vector Optimization technology (EvO) for<br />
the smoothest roll-over ever. Improved dynamic<br />
response and uncompromised stability through<br />
the gait cycle allows amputees to walk in complete<br />
comfort and confidence.
perforMance overvieW 2009<br />
Total sales amounted to USD 331 million, a slight decline from 2008, or 1% measured<br />
in local currency. Sales and EBITDA for the year were in line with management guidance.<br />
Overall, Össur’s 2009 sales were satisfying when taking into consideration the<br />
global economic environment.<br />
Sales growth in prosthetics continues and was 8%, measured in local currency. This<br />
increase confirms Össur’s technical leadership and the Company’s strong position in<br />
this market segment. Sales of bracing and supports declined by 6% and sales of compression<br />
therapy products declined by 5%, both measured in local currency.<br />
The effect of the economic environment on sales varied by region, both in the US and<br />
in Europe. In the US, the effect has been most profound in those states suffering from<br />
higher unemployment rates. In such states, a trading down to lower priced products in<br />
the bracing and supports side of the business has been documented. Europe showed<br />
similar trends as the US. Some markets were more volatile than others. Some of the<br />
Asian markets have been affected, such as Korea, however, main markets and segments<br />
in Asia showed a handsome growth despite the economic downturn.<br />
USD ‘000 2009 % of sales groWth usd groWth lcy<br />
Americas 159,278 48% -1% 0%<br />
EMEA 156,906 48% -9% -1%<br />
Asia 14,396 4% 12% 13%<br />
Total 330,580 100% -5% -1%
sales<br />
Össur experienced a slight decline in overall sales in<br />
2009. Total sales amounted to USD 330.6 million, compared<br />
to USD 346.8 million in 2008. Exchange rate trends<br />
had a negative impact on sales, amounting to USD 13.8<br />
million. Sales measured in USD declined by 5% and by<br />
1% in LCY. However, in the later part of the year sales<br />
gradually increased with Q4 proving to be the strongest<br />
quarter of 2009.<br />
Total sales for the Americas was flat in LCY for the year.<br />
Prosthetics performed well with an increasing contribution<br />
from Össur’s Bionic products, while there was a<br />
contraction in the B&S business. Overall, the first half of<br />
2009 was affected by customer destocking in an uncertain<br />
environment. However, sales increased in the latter<br />
half of the year.<br />
Overall sales in EMEA decreased slightly, or by 1% in<br />
LCY. Some markets were more affected by the weak<br />
economy than others, especially markets in the UK and<br />
Spain. The Gibaud subsidiary had a reasonably good<br />
year, which was somewhat effected by discontinued<br />
product lines. However, compression therapy sales are<br />
picking up. For the full year sales sales of compression<br />
therapy declined by 10%, measured in US dollars, and<br />
by 5% in LCY. However, sales in LCY grew by 1% in the<br />
fourth quarter.<br />
Discontinuation of contracts with third party suppliers<br />
has had a temporary negative effect on the sales in EMEA<br />
but not on profitability. various initiatives resulted in<br />
improved performance and towards the end of the year<br />
sales trends in bracing and supports were positive. The<br />
Asian market continues to experience a strong performance<br />
in all main markets.<br />
At yearend, Össur ran operations in 14 different locations<br />
worldwide.<br />
gross profit<br />
Gross profit margins have been stable, above 60%<br />
throughout 2009. The slight decline in gross profit margin<br />
in 2009 compared to 2008 is partly due to a revaluation<br />
of inventory as a consequence of the significant<br />
weakening of the Icelandic Krona, and increased provisions<br />
for obsolite inventory.<br />
operating eXpenses<br />
Össur’s operations were stable in 2009. Operating<br />
expenses decreased slightly, or by 0.7 percentagepoints<br />
when adjusted for exchange rate effects. Contributing to<br />
the decrease was the formation of a more efficient sales<br />
and marketing structure within the Americas, as well as<br />
a gradual improvement in general and administrative<br />
expenses. Opportunities exist for Össur to capitalize<br />
on economies of scale to further improve operational<br />
performance.<br />
Comparison of profit resulting from operations between<br />
2009 and 2008 is affected by one-time income in 2008,<br />
derived from the sale of Össur’s advanced wound care<br />
product line. Excluding this one-time gain in 2008, profit<br />
from operations remains at a similar level between years.<br />
One-time income related to the sale of the advanced<br />
wound care product line amounted to USD 8.4 million<br />
in 2008.<br />
Amortization of intangible assets, relating to acquisitions<br />
made in previous years, amounted to USD 10.6<br />
million in 2009, compared to USD 14.7 million in 2008.<br />
This amortization is in accordance with accounting standards,<br />
affecting Össur’s income statements. However,<br />
the underlying intangible assets may not be decreasing<br />
in value. Amortization will drop significantly in 2010 and<br />
is expected to amount to approximately USD 5 million<br />
in 2010.<br />
Allocation of<br />
aMortization of intangible<br />
assets to eXpense iteMs<br />
2009<br />
USD<br />
‘000<br />
%<br />
of sales<br />
2008<br />
USD<br />
‘000<br />
%<br />
of<br />
sales<br />
Cost of goods sold 8 0.0% 70 0.0%<br />
Sales & marketing expenses 6,765 2.0% 9,096 2.6%<br />
Research & development expenses 3,441 1.0% 4,185 1.2%<br />
General & administrative expenses 354 0.1% 1,404 0.4%<br />
Effect on profit from operations 10,568 3.2% 14,755 4.3%<br />
financial iteMs, taX and net profit<br />
Net financial expenses for 2009 amounted to USD 15.3<br />
million, compared to USD 18.1 million in 2008. The<br />
decrease in financial expenses is a direct consequence<br />
of decreasing net financial debt. Income tax was USD<br />
7.5 million, corresponding to a 26% effective tax rate, as<br />
in 2008. Net profit amounted to USD 22.8 million, compared<br />
to USD 28.5 million in 2008. Comparison between<br />
years is affected by one-time gain in 2008, related to the<br />
divestment of the Company’s advanced wound care<br />
product line.<br />
balance sheets<br />
Össur’s balance sheet is healthy. The equity ratio at the<br />
end of the period was 50% compared to 41% at the end<br />
of 2008. Leverage is decreasing and net interest bearing<br />
debt over EBITDA was 2.4x at the end of the period.<br />
53 <strong>annual</strong> report 09
Currently, Össur has favorable financing terms and no<br />
financial covenant issues.<br />
It is the intention to internationalize the debt structure<br />
of Össur.<br />
earnings per share<br />
earnings per share 2009 2008 change<br />
EPS diluted (US cents) 5.30 6.73 -21%<br />
Cash EPS diluted (US cents) 9.66 12.29 -21%<br />
cash floW<br />
Össur had a strong cash flow in 2009. The Company’s<br />
liquidity position has improved further and cash at the<br />
end of the year amounted to USD 80 million, compared<br />
to USD 31 million at the end of 2008.<br />
cash floW<br />
cash floW (USD ‘000) 2009 % of<br />
Sales<br />
2008 % of<br />
sales<br />
Working capital provided by operating activities 44,473 13% 58,070 17%<br />
Net cash provided by operating activities 69,155 21% 52,835 15%<br />
capital eXpenditure and investMents<br />
Capital investments amounted to USD 9.7 million or<br />
2.9% of sales, compared to USD 7.8 million and 2.2%<br />
of sales in the same period of 2008. Capital investments<br />
continue to be in line with the Company’s guidance of<br />
2.5-3.5%.<br />
split betWeen currencies 2009<br />
currency split incoMe cost<br />
USD 48.2% 50.9%<br />
EUR 35.0% 29.7%<br />
ISK 0.3% 9.1%<br />
Other European currencies 16.5% 10.3%<br />
<strong>annual</strong> report 09<br />
54<br />
sales by segMent<br />
usd ‘000 2009 % of<br />
sales<br />
bracing &<br />
supports<br />
groWth<br />
usd<br />
161,732 49% -10% -6%<br />
prosthetics 148,513 45% 4% 8%<br />
coMpression<br />
therapy<br />
18,159 5% -10% -5%<br />
groWth<br />
lcy<br />
other 2,176 1% -57% -53%<br />
total 330,580 100% -5% -1%
Össur hf. consolidated financial stateMents 2009
FINANCIAL RATIOS<br />
CONSOLIDATED STATEMENTS 2009 2008 2007 2006 2005<br />
INCOME Net sales 1 USD ‘000 330,580 346,835 331,966 248,653 159,827<br />
STATEMENT Gross profit 1 USD ‘000 201,815 214,203 192,033 154,797 94,771<br />
Operating expenses 2 USD ‘000 154,071 167,678 171,160 127,130 75,697<br />
Profit from operations USD ‘000 48,240 55,958 39,716 19,743 16,525<br />
Net profit USD ‘000 22,762 28,488 7,580 4,360 11,688<br />
EBITDA USD ‘000 66,988 79,440 64,392 39,493 25,832<br />
BALANCE SHEET Total assets USD ‘000 628,217 603,778 635,821 612,752 407,986<br />
Equity USD ‘000 312,223 249,648 250,282 161,639 152,829<br />
Net interest-bearing debt (NIBD) USD ‘000 157,633 234,281 283,106 350,252 175,281<br />
CASH fLOW Working capital from operating activities USD ‘000 44,473 58,070 43,991 24,663 18,954<br />
Cash provided by operating activities USD ‘000 69,155 52,835 45,701 15,988 15.481<br />
Cash flows from investing activities USD ‘000 ( 16,423 ) ( 6,648 ) ( 17,781 ) ( 179,052 ) ( 249,659 )<br />
Cash flows from financing activities USD ‘000 ( 4,284 ) ( 30,610 ) ( 25,289 ) 154,197 250,923<br />
Free Cash flow USD ‘000 58,629 46,187 38,762 6,352 8,791<br />
KEY fIGURES Sales Growth % ( 4.7 ) 4.5 33.5 55.6 28.4<br />
Operating margin % 14.6 16.0 12.0 8.0 10.3<br />
EBITDA margin % 20.3 22.9 19.4 15.9 16.2<br />
Equity ratio % 49.7 41.3 39.4 26.4 37.5<br />
Ratio of net debt to EBITDA 2.4 2.9 4.4 8.9 6.8<br />
Current ratio 2.3 1.1 0.9 0.6 2.1<br />
Return on equity % 8.1 11.0 4.0 3.0 14.9<br />
Employees Number 1,532 1,587 1,617 1,190 680<br />
MARKET Market value of equity 3 USD ‘000 529,151 349,263 672,024 605,572 695,125<br />
Number of shares Millions 454 423 423 385 385<br />
Price/earnings ratio, (P/E) 23.2 12.3 88.7 138.9 59.5<br />
Diluted EPS US Cent 5.30 6.73 1.94 1.13 3.52<br />
Diluted Cash EPS US Cent 9.66 12.29 8.24 6.27 6.33<br />
NOTES<br />
1 Distribution costs and revenues to/from customers have been reclassed to sales and marketing expenses years.<br />
2005 to 2008 to align with 2009 method of reporting.<br />
2 Excluding other income and restructuring expenses.<br />
3 Market value based on last trade at 30.12.2009 on Nasdaq OMX, Iceland and Denmark.<br />
All amounts in thousands of USD 57 <strong>annual</strong> report 09<br />
Össur hf. consolidated financial stateMents 2009
Össur hf. consolidated financial stateMents 2009<br />
STATEMENT BY THE BOARD OF DIRECTORS AND PRESIDENT AND CEO<br />
It is the opinion of the Board of Directors and the President<br />
and CEO of Össur hf., that these Consolidated Financial<br />
Statements present the necessary information to evaluate the<br />
financial position of the Company at year-end, the operating<br />
results for the year and financial developments during the<br />
year 2009. Össur Consolidated Financial Statements are prepared<br />
in accordance with International Financial Reporting<br />
Standards (IFRS) as adopted by the European Union and<br />
additional Icelandic and Danish disclosure requirements for<br />
listed companies.<br />
Össur hf. designs, manufactures and sells orthopaedic prod-<br />
ucts specializing in prosthetics, bracing and support and<br />
compression therapy solutions. The Company’s headquarters<br />
are located in Iceland, but the Company owns and operates<br />
subsidiaries in the United States, Canada, France, the<br />
Netherlands, the UK, Sweden, Norway, Spain, Swiss, China<br />
and Australia. The Company sells its products world wide,<br />
but the principal market areas are North America and Europe.<br />
The total sales of the Össur Consolidation amounted to<br />
USD 330.6 million, compared to USD 346.8 million in the<br />
<strong>annual</strong> report 09<br />
58<br />
preceding year. This represents a decline in sales of approximately<br />
4.7%. Net profit amounted to USD 22.8 million compared<br />
to USD 28.5 million in 2008. Diluted Earnings per<br />
Share amounted to US cents 5.3 compared to US cents 6.73<br />
in 2008. Earnings before interest, taxes, depreciation and<br />
amortization (EBITDA) amounted to USD 67.0 million compared<br />
to USD 79.4 million in the preceding year.<br />
The total assets of the Ossur Consolidation amounted to<br />
USD 628.2 million at year-end, liabilities were 316.0 million,<br />
and equity was 312.2 million. The equity ratio at year-end was<br />
50%, compared to 41% the preceding year.<br />
In the course of the year the Company employed on average<br />
1,532 employees.<br />
The market value of the Company at year-end was 529 mil-<br />
lion USD and increased by 51.5% over the year. At year-end,<br />
shareholders in Össur hf. numbered 2,524 compared to<br />
2,586 at the beginning of the year. Two shareholders owned<br />
more than 10% of the shares in the Company at year-end:<br />
Reykjavik, 3 february 2010<br />
Board of Directors<br />
Niels Jacobsen<br />
Chairman of the Board<br />
Arne Boye Nielsen Kristjan T. Ragnarsson<br />
Thordur Magnusson Svafa Gronfeldt<br />
president and CEO<br />
Jón Sigurðsson<br />
William Demant Invest A/S, with 37.2% and Eyrir Invest ehf.<br />
with 18.8%.<br />
In its procedures, the Board of Directors complies with<br />
the Articles of Association of the Company and the Board<br />
of Directors‘ Rules of Procedure. The rules comply with<br />
the guidelines on Corporate Governance issued by the<br />
NASDAQ OMX Iceland, the Iceland Chamber of Commerce<br />
and the Confederation of Icelandic Employers. The Rules<br />
of Procedure address issues such as allocation of responsibilities<br />
and power of decision within the Board, independency<br />
issues, confidentiality etc. An Audit Committee and a<br />
Remuneration Committee are present within the Board. No<br />
Össur employees are sitting on the Board of Directors<br />
The Board of Directors does not recommend payment of<br />
dividends to shareholders in 2010. As regards to changes<br />
in the equity of the Company, the Board refers to the Notes<br />
attached to the Consolidated Financial Statements.<br />
The Board of Directors and President and CEO of Össur hf. hereby confirm the Consolidated Financial Statements of Össur for the year 2009 with their signatures.
INDEPENDENT AUDITOR’S REPORT<br />
To the Board of Directors and shareholders of <strong>össur</strong> hf.<br />
We have audited the accompanying Consolidated<br />
Financial Statements of Össur hf., which comprise the<br />
balance sheet at December 31, 2009, and the income<br />
statement, statement of changes in equity and cash flow<br />
statement for the year then ended, and a summary of significant<br />
accounting policies and other explanatory notes.<br />
Management’s Responsibility for the Consolidated<br />
financial Statements<br />
Management is responsible for the preparation and fair<br />
presentation of these Consolidated Financial Statements<br />
in accordance with International Financial Reporting<br />
Standards as adopted by the European Union and<br />
additional Icelandic disclosure requirements for listed<br />
companies. This responsibility includes: designing, implementing<br />
and maintaining internal control relevant to the<br />
preparation and fair presentation of financial statements<br />
that are free from material misstatement, whether due to<br />
fraud or error; selecting and applying appropriate accounting<br />
policies; and making accounting estimates that are<br />
reasonable in the circumstances.<br />
Auditor’s Responsibility<br />
Our responsibility is to express an opinion on these<br />
Consolidated Financial Statements based on our audit.<br />
We conducted our audit in accordance with International<br />
Standards on Auditing. Those standards require that we<br />
comply with ethical requirements and plan and perform<br />
the audit to obtain reasonable assurance whether the<br />
Consolidated Financial Statements are free from material<br />
misstatement.<br />
An audit involves performing procedures to obtain<br />
audit evidence about the amounts and disclosures in<br />
the Consolidated Financial Statements. The procedures<br />
selected depend on the auditor’s judgment, including the<br />
assessment of the risks of material misstatement of the<br />
Consolidated Financial Statements, whether due to fraud<br />
or error. In making those risk assessments, the auditor<br />
considers internal control relevant to the entity’s preparation<br />
and fair presentation of the Consolidated Financial<br />
Statements in order to design audit procedures that are<br />
appropriate in the circumstances, but not for the purpose<br />
of expressing an opinion on the effectiveness of the entity’s<br />
internal control. An audit also includes evaluating the<br />
Kópavogur, 3 february 2010<br />
Deloitte hf.<br />
Sigurdur Pall Hauksson<br />
State Authorized public Accountant<br />
Thorsteinn Petur Gudjonsson<br />
State Authorized public Accountant<br />
appropriateness of accounting policies used and the reasonableness<br />
of accounting estimates made by management,<br />
as well as evaluating the overall presentation of the<br />
Consolidated Financial Statements.<br />
We believe that the audit evidence we have obtained is<br />
sufficient and appropriate to provide a basis for our audit<br />
opinion.<br />
Opinion<br />
In our opinion, based on our own audit and the audit<br />
reports on the Consolidated Financial Statements of<br />
the foreign subsidiaries of Össur hf., the Consolidated<br />
Financial Statements give a true and fair view of the<br />
financial position of Össur hf. and subsidiaries as of<br />
December 31, 2009, and of its financial performance and<br />
its cash flows for the year then ended in accordance with<br />
International Financial Reporting Standards (IFRS) as<br />
adopted by the European Union and additional Icelandic<br />
disclosure requirements for listed companies.<br />
59 <strong>annual</strong> report 09<br />
Össur hf. consolidated financial stateMents 2009
Össur hf. consolidated financial stateMents 2009<br />
CONSOLIDATED INCOME STATEMENTS FOR THE YEARS 2009 AND 2008<br />
<strong>annual</strong> report 09<br />
60<br />
NOTES 2009 2008<br />
NET SALES 5 330,580 346,835<br />
Cost of goods sold ( 128,765 ) ( 132,632 )<br />
GROSS pROfIT 201,815 214,203<br />
Other income 7 496 9,433<br />
Sales and marketing expenses ( 92,567 ) ( 97,812 )<br />
Research and development expenses ( 19,080 ) ( 20,930 )<br />
General and administrative expenses ( 42,424 ) ( 48,936 )<br />
pROfIT fROM OpERATIONS 48,240 55,958<br />
Financial income 254 864<br />
Financial expenses ( 15,587 ) ( 18,303 )<br />
Net exchange rate difference ( 2,670 ) ( 286 )<br />
Net financial income / (expenses) 10 ( 18,003 ) ( 17,725 )<br />
pROfIT BEfORE TAx 30,237 38,233<br />
Income tax 11 ( 7,475 ) ( 9,745 )<br />
NET pROfIT 22,762 28,488<br />
Attributable to:<br />
Owners of the Company 22,706 28,488<br />
Non-controlling interests 56 0<br />
22,762 28,488<br />
Earnings per Share 12<br />
Basic Earnings per Share 5.32 6.74<br />
Diluted Earnings per Share 5.30 6.73
CONSOLIDATED STATEMENTS OF COMPREHENSIvE INCOME FOR THE YEARS 2009 AND 2008<br />
NOTES 2009 2008<br />
NET pROfIT 22,762 28,488<br />
OTHER COMpREHENSIVE INCOME<br />
Gain / (loss) on hedge of a net investment in foreign operations ( 1,216 ) 1,473<br />
Loss on cash flow hedges ( 521 ) ( 10,124 )<br />
Transl. difference of shares in foreign operations 10,775 ( 22,029 )<br />
Income tax relating to components of other comprehensive income 313 1,298<br />
Other comprehensive income (net of tax) 9,351 ( 29,382 )<br />
Total comprehensive income 32,113 ( 894 )<br />
Attributable to:<br />
Owners of the Company 32,057 ( 894 )<br />
Non-controlling interests 56 0<br />
32,113 ( 894 )<br />
All amounts in thousands of USD 61 <strong>annual</strong> report 09<br />
Össur hf. consolidated financial stateMents 2009
Össur hf. consolidated financial stateMents 2009<br />
CONSOLIDATED STATEMENTS OF FINANCIAL POSITION<br />
ASSETS<br />
NON-CURRENT ASSETS<br />
<strong>annual</strong> report 09<br />
62<br />
NOTES 31.12.2009 31.12.2008<br />
Property, plant and equipment 14 32,286 32,927<br />
Goodwill 15 334,844 322,381<br />
Other intangible assets 16 35,382 45,175<br />
Other Financial assets 18 3,567 1,156<br />
Deferred tax asset 29 42,367 61,563<br />
CURRENT ASSETS<br />
448,446 463,202<br />
Inventories 21 43,526 55,818<br />
Accounts receivables 22 43,693 43,821<br />
Other assets 22 10,413 10,031<br />
Assets classified as held for sale 19 2,308 0<br />
Bank balances and cash 20 79,831 30,906<br />
179,771 140,576<br />
TOTAL ASSETS 628,217 603,778
31 DECEMBER 2009 AND 31 DECEMBER 2008<br />
EqUITY AND LIABILITIES<br />
EqUITY<br />
NOTES 31.12.2009 31.12.2008<br />
Issued capital 23 201,997 172,902<br />
Reserves 24 5,582 ( 4,257 )<br />
Retained earnings 25 103,647 81,003<br />
Equity attributable to owners of the company 311,226 249,648<br />
Non-controlling interest in equity 997 0<br />
NON-CURRENT LIABILITIES<br />
312,223 249,648<br />
Borrowings 27 210,282 183,117<br />
Deferred tax liabilities 29 11,024 27,076<br />
Provisions 30 5,744 3,575<br />
Other financial liabilities 28 9,995 9,474<br />
CURRENT LIABILITIES<br />
237,045 223,242<br />
Borrowings 27 27,182 82,070<br />
Accounts payable 13,353 13,593<br />
Tax payable 2,452 1,434<br />
Provisions 30 2,686 7,659<br />
Other liabilities 32 33,276 26,132<br />
78,949 130,888<br />
TOTAL EqUITY AND LIABILITIES 628,217 603,778<br />
All amounts in thousands of USD 63 <strong>annual</strong> report 09<br />
Össur hf. consolidated financial stateMents 2009
Össur hf. consolidated financial stateMents 2009<br />
CONSOLIDATED STATEMENTS OF CASH FLOWS FOR THE YEARS 2009 AND 2008<br />
CASH fLOWS fROM OpERATING ACTIVITIES NOTES 2009 2008<br />
Profit from operations 48,240 55,958<br />
Depreciation and amortization 14, 16 18,748 23,482<br />
Gain on disposal of assets 531 40<br />
Change in provisions ( 2,811 ) 1,369<br />
Changes in operating assets and liabilities 21,062 ( 9,389 )<br />
CASH GENERATED BY OpERATIONS 85,770 71,460<br />
Interest received 302 283<br />
Interest paid ( 10,570 ) ( 16,948 )<br />
Taxes paid ( 6,347 ) ( 1,960 )<br />
NET CASH pROVIDED BY OpERATING ACTIVITIES 69,155 52,835<br />
CASH fLOWS fROM INVESTING ACTIVITIES<br />
Purchase of fixed assets 14, 16 ( 9,679 ) ( 7,754 )<br />
Proceeds from sale of fixed assets 762 959<br />
Acquisition of subsidiaries ( 5,897 ) 0<br />
Changes in financial assets ( 1,609 ) 147<br />
CASH fLOWS fROM fINANCING ACTIVITIES<br />
<strong>annual</strong> report 09<br />
64<br />
( 16,423 ) ( 6,648 )<br />
Repayments of short-term borrowings ( 7,493 ) ( 14,271 )<br />
Repayments of long-term borrowings ( 25,912 ) ( 15,943 )<br />
Paid in capital 23 29,121 ( 396 )<br />
( 4,284 ) ( 30,610 )<br />
NET CHANGE IN CASH 48,448 15,577<br />
EffECTS Of fOREIGN ExCHANGE RATE ADJUSTMENTS 477 ( 560 )<br />
CASH AT BEGINNING Of YEAR 30,906 15,889<br />
CASH AT END Of YEAR 79,831 30,906<br />
Additional information regarding cash flow 13
CONSOLIDATED STATEMENT OF CHANGES IN EQUITY<br />
FOR THE THE YEARS 2009 AND 2008<br />
ATTRIB. TO NON-<br />
SHARE SHARE STATUTORY STOCK OpTION HEDGING TRANSLATION ACCUMULATED OWNERS Of CONTROLLING TOTAL<br />
CApITAL pREMIUM RESERVE RESERVE RESERVE RESERVE pROfITS THE pARENT INTEREST EqUITY<br />
Balance at 1 January 2008 4,821 168,477 1,043 332 552 22,379 52,677 250,281 250,281<br />
Net profit 28,488 28,488 28,488<br />
Gain on hedge of a net investment in<br />
foreign operations net of tax 1,252 1,252 1,252<br />
Loss on cash flow hedges net of tax ( 8,605 ) ( 8,605 ) ( 8,605 )<br />
Translation difference of shares in<br />
foreign operations ( 22,029 ) ( 22,029 ) ( 22,029 )<br />
Total comprehensive income for the period 0 0 0 0 ( 8,605 ) ( 20,777 ) 28,488 ( 894 ) 0 ( 894 )<br />
Cost due to increasing capital ( 396 ) ( 396 ) ( 396 )<br />
Share option charge for the period 657 657 657<br />
Transferred to statutory reserves 162 ( 162 ) 0 0<br />
Balance at 31 December 2008 4,821 168,081 1,205 989 ( 8,053 ) 1,602 81,003 249,648 0 249,648<br />
Net profit 22,706 22,706 56 22,762<br />
Loss on hedge of a net investment in<br />
foreign operations net of tax ( 997 ) ( 997 ) ( 997 )<br />
Loss on cash flow hedges net of tax ( 427 ) ( 427 ) ( 427 )<br />
Translation difference of shares<br />
in foreign operations 10,775 10,775 10,775<br />
Total comprehensive income for the period 0 0 0 0 ( 427 ) 9,778 22,706 32,057 56 32,113<br />
Share option charge for the period 426 426 426<br />
Arising on acquisition 0 941 941<br />
Paid in share capital 247 28,848 29,095 29,095<br />
Transferred to statutory reserves 62 ( 62 ) 0 0<br />
Balance at 31 December 2009 5,068 196,929 1,267 1,415 ( 8,480 ) 11,380 103,647 311,226 997 312,223<br />
All amounts in thousands of USD 65 <strong>annual</strong> report 09<br />
Össur hf. consolidated financial stateMents 2009
Össur hf. consolidated financial stateMents 2009<br />
NOTES TO THE CONSOLIDATED FINANCIAL STATEMENTS<br />
1. general inforMation<br />
Össur hf. (the Company) is a global orthopaedics company,<br />
specializing in the development, manufacturing and<br />
sales of prosthetics, bracing and supports and compression<br />
therapy products. The principal market areas of the<br />
Company are Americas, Europe, Middle East and Africa<br />
(EMEA) and Asia, which are served by subsidiaries in the<br />
United States, Canada, Sweden, Norway, the Netherlands,<br />
UK, France, Australia, Spain, Swiss and China in addition<br />
to the Iceland-based parent company.<br />
The main production of the Company is conducted at<br />
Össur hf. in Iceland, Gibaud Group (La Tour Finance)<br />
in St. Etienne, Trevoux in France and at Össur Americas<br />
in California USA. Part of the production is outsourced<br />
to Asia.<br />
According to the Company’s organizational structure, the<br />
consolidation is divided into four main functions; Corporate<br />
Finance, responsible for overall financial management;<br />
Manufacturing & Operations, responsible for quality control<br />
and all production, inventory management and distribution;<br />
Research & Development, responsible for product development<br />
and product management; Sales & Marketing responsible<br />
for sales and marketing through the subsidiaries.<br />
2. adoption of neW<br />
and revised standards<br />
2.1 standards and interpretations effective in the<br />
current and prior periods<br />
The Consolidated Financial Statements is presented in<br />
accordance with the new and revised standards (IFRS<br />
<strong>annual</strong> report 09<br />
66<br />
/ IAS) and new interpretations (IFRIC), applicable in<br />
2009. The standards and interpretations relevant to the<br />
Company are:<br />
IFRS 2 (revised) Share based payment<br />
IFRS 7 (revised) Financial Instruments: Disclosures<br />
IFRS 8 Operating Segments<br />
IAS 1 (revised) Presentation of Financial Statements<br />
IAS 23 (revised) Borrowing Costs<br />
IAS 32 (revised) Financial Instruments Presentation<br />
IFRIC 13 Customer loyalty programmes<br />
IFRIC 16 Hedges of Net Investments in Foreign<br />
Operation.<br />
The adoption of the new and revised standard and interpretations<br />
has not led to material changes in the accounting<br />
policies.<br />
2.2 standards not yet effective<br />
New and revised standards and interpretations have also<br />
been approved but are not yet effective. Management<br />
believe that implementation of those standards and<br />
interpretations do not have a material affect on the<br />
Consolidated Financial Statements of the Company.<br />
Following is an overview of those management believe are<br />
relevant for the Company:<br />
IFRS 2 (revised) Share-based Payment (effective for<br />
accounting periods beginning on or<br />
after 1 January 2010)<br />
IFRS 3 (revised) Business combinations (effective for<br />
accounting periods beginning on or<br />
after 1 July 2009)<br />
IAS 27 (revised) Consolidated and separate Financial<br />
Statements (effective for accounting<br />
periods beginning on or after 1 July<br />
2009)<br />
IAS 32 (revised) Financial Instruments: Presentation<br />
(effective for accounting periods beginning<br />
on or after 1 February 2009<br />
IAS 39 (revised) Financial Instruments: Recognition<br />
and measurement (effective for<br />
accounting periods beginning on or<br />
after 1 July 2009)<br />
3. suMMary of significant<br />
accounting policies<br />
3.1 stateMent of coMpliance<br />
The Consolidated Financial Statements have been prepared<br />
in accordance with International Financial Reporting<br />
Standards (IFRS) as adopted by the EU and additional<br />
Icelandic and Danish disclosure requirements for<br />
Consolidated Financial Statements for listed companies.<br />
3.2 basis of preparation<br />
The Consolidated Financial Statements have been prepared<br />
on the historical cost basis except for the revaluation<br />
of certain non-current assets and financial instruments.<br />
The Financial Statements are presented in USD, which is<br />
the Company’s functional currency. The principal accounting<br />
policies are set out below.<br />
3.3 basis of consolidation<br />
The Consolidated Financial Statements incorporate<br />
the Financial Statements of the Company and entities
controlled by the Company (its subsidiaries). Control is<br />
achieved where the Company has the power to govern the<br />
financial and operating policies of an investee enterprise<br />
so as to obtain benefits from its activities.<br />
The results of subsidiaries acquired during the year are<br />
included in the consolidated income statement from the<br />
effective date of acquisition as appropriate. Where necessary,<br />
adjustments are made to the Financial Statements<br />
of subsidiaries to bring their accounting policies into line<br />
with those used by other members of the Company.<br />
All intra-group transactions, balances, income and expenses<br />
are eliminated in full on consolidation.<br />
3.4 business coMbination<br />
Acquisitions of subsidiaries and businesses are accounted<br />
for using the acquisition (purchase) method. The cost of<br />
the business combination is measured as the aggregate<br />
of the fair values (at the date of exchange) of assets given,<br />
liabilities incurred or assumed, and equity instruments<br />
issued by the Company in exchange for control of the<br />
acquire. Acquisition-related costs are recognised in profit<br />
or loss as incurred.<br />
The acquiree’s identifiable assets, liabilities and contingent<br />
liabilities that meet the conditions for recognition<br />
under IFRS 3 (2008) are recognised at their fair value at<br />
the acquisition date, except that:<br />
• deferred tax assets or liabilities and liabilities or<br />
assets related to employee benefit arrangements<br />
are recognised and measured in accordance with<br />
IAS 12 Income Taxes and IAS 19 Employee Benefits<br />
respectively;<br />
• liabilities or equity instruments related to the replacement<br />
by the Company of an acquiree’s share-based<br />
payment awards are measured in accordance with<br />
IFRS 2 Share-based Payment; and<br />
• assets (or disposal groups) that are classified as<br />
held for sale in accordance with IFRS 5 Non-current<br />
Assets Held for Sale and Discontinued Operations<br />
are measured in accordance with that Standard.<br />
Goodwill arising on acquisition is recognised as an asset<br />
and initially measured at cost, being the excess of the<br />
purchase price of the business combination over the<br />
Company’s interest in the net fair value of the identifiable<br />
assets, liabilities and contingent liabilities recognised. If,<br />
after reassessment, the Company’s interest in the net fair<br />
value of the acquiree’s identifiable assets, liabilities and<br />
contingent liabilities exceeds the cost of the business<br />
combination, the excess is recognised immediately in<br />
profit or loss.<br />
The measurement period is the period from the date of<br />
acquisition to the date the Company obtains complete<br />
information about facts and circumstances that existed as<br />
of the acquisition date – and is subject to a maximum of<br />
one year.<br />
3.5 investMents in associates<br />
An associate is an entity over which the Company has<br />
significant influence and that is neither a subsidiary nor<br />
an interest in a joint venture. Significant influence is the<br />
power to participate in the financial and operating policy<br />
decisions of the investee but is not control or joint control<br />
over those policies.<br />
The results and assets and liabilities of associates are<br />
incorporated in the Consolidated Financial Statements<br />
using the equity method of accounting. Under the equity<br />
method, investments in associates are carried in the<br />
consolidated statement of financial position at cost as<br />
adjusted for post-acquisition changes in the Company’s<br />
share of the net assets of the associate, less any impairment<br />
in the value of individual investments. Losses of an<br />
associate in excess of the Company’s interest in that associate<br />
are recognised only to the extent that the Company<br />
has incurred legal or constructive obligations or made<br />
payments on behalf of the associate.<br />
Any excess of the cost of acquisition over the Company’s<br />
share of the net fair value of the identifiable assets, liabilities<br />
and contingent liabilities of the associate recognised<br />
at the date of acquisition is recognised as goodwill. The<br />
goodwill is included within the carrying amount of the<br />
investment and is assessed for impairment as part of that<br />
investment. Any excess of the Company’s share of the net<br />
fair value of the identifiable assets, liabilities and contingent<br />
liabilities over the cost of acquisition, after reassessment,<br />
is recognised immediately in profit or loss.<br />
Where a group entity transacts with an associate of the<br />
Company, profits and losses are eliminated to the extent<br />
of the Company’s interest in the relevant associate.<br />
3.6 goodWill<br />
Goodwill arising in a business combination represents the<br />
excess of the purchase price over the Company’s interest<br />
in the net fair value of the identifiable assets, liabilities and<br />
contingent liabilities of the subsidiary or jointly controlled<br />
entity recognised at the date of acquisition. Goodwill is<br />
initially recognised as an asset at cost and is subsequently<br />
measured at cost less any accumulated impairment<br />
losses.<br />
Goodwill is not amortised but is reviewed for impairment<br />
at least <strong>annual</strong>ly. For the purpose of impairment testing,<br />
goodwill is allocated to each of the Company’s cash-generating<br />
units expected to benefit from the synergies of the<br />
All amounts in thousands of USD 67 <strong>annual</strong> report 09<br />
Össur hf. consolidated financial stateMents 2009
Össur hf. consolidated financial stateMents 2009<br />
combination. Cash-generating units to which goodwill has<br />
been allocated are tested for impairment <strong>annual</strong>ly, or more<br />
frequently when there is an indication that the unit may be<br />
impaired. If the recoverable amount of the cash-generating<br />
unit is less than its carrying amount, the impairment<br />
loss is allocated first to reduce the carrying amount of any<br />
goodwill allocated to the unit and then to the other assets<br />
of the unit pro-rata on the basis of the carrying amount of<br />
each asset in the unit. An impairment loss recognised for<br />
goodwill is not reversed in a subsequent period.<br />
On disposal of a subsidiary, the attributable amount of<br />
goodwill is included in the determination of the profit or<br />
loss on disposal.<br />
The Company’s policy for goodwill arising on the acquisition<br />
of an associate is described at 3.5 above.<br />
3.7 revenue recognition<br />
Revenue is measured at the fair value of the consideration<br />
received or receivable. Revenue is reduced for estimated<br />
customer returns, rebates and other similar allowances.<br />
SALE OF GOODS<br />
Revenue from the sale of goods is recognised when all<br />
the following conditions are satisfied; the Company has<br />
transferred to the buyer the significant risks and rewards<br />
of ownership of the goods, the Company retains neither<br />
continuing managerial involvement to the degree usually<br />
associated with ownership nor effective control over the<br />
goods sold, the amount of revenue can be measured reliably,<br />
it is probable that the economic benefits associated<br />
with the transaction will flow to the entity and the costs<br />
incurred or to be incurred in respect of the transaction can<br />
be measured reliably.<br />
<strong>annual</strong> report 09<br />
68<br />
ROYALTIES<br />
Royalty revenue is recognised on an accrual basis in<br />
accordance with the substance of the relevant agreement.<br />
Royalties determined on a time basis are recognised on<br />
a straight-line basis over the period of the agreement.<br />
Royalty arrangements that are based on production, sales<br />
and other measures are recognised by reference to the<br />
underlying arrangement.<br />
INTEREST INCOME<br />
Interest income is accrued on a time basis, by reference<br />
to the principal outstanding and at the effective interest<br />
rate applicable.<br />
3.8 leasing<br />
Operating lease payments are recognised as an expense<br />
on a straight-line basis over the lease term, except where<br />
another systematic basis is more representative of the<br />
time pattern in which economic benefits from the leased<br />
assets are consumed. Contingent rentals arising under<br />
operating leases are recognised as an expense in the period<br />
in which they are incurred.<br />
In the event that lease incentives are received to enter<br />
into operating leases, such incentives are recognised as a<br />
liability. The aggregate benefit of incentives is recognised<br />
as a reduction of rental expense on a straight-line basis,<br />
except where another systematic basis is more representative<br />
of the time pattern in which economic benefits from<br />
the leased assets are consumed.<br />
3.9 foreign currencies<br />
For the purpose of presenting Consolidated Financial<br />
Statements, the assets and liabilities of the Company’s<br />
foreign operations are expressed in USD using exchange<br />
rates prevailing at the balance sheet date. Income and<br />
expense items are translated at the average exchange rates<br />
for each quarter within the period, unless exchange rates<br />
fluctuated significantly during that period, in which case<br />
the exchange rates at the dates of the transactions are<br />
used. Exchange differences arising, if any, are classified<br />
as equity and transferred to the Company’s translation<br />
reserve. Gains and losses on hedging instruments that<br />
are designated as hedges of net investments in foreign<br />
operations are included in the foreign currency translation<br />
reserve. Such exchange differences are recognised in<br />
profit or loss in the period in which the foreign operation<br />
is disposed of.<br />
Exchange differences are recognised in profit or loss in the<br />
period, except exchange differences relating to hedge of a<br />
net investment in foreign operations.<br />
Goodwill and fair value adjustments arising on the acquisition<br />
of a foreign operation are treated as assets and<br />
liabilities of the foreign operation and translated at the<br />
closing rate.<br />
3.10 borroWing costs<br />
Borrowing costs directly attributable to the acquisition,<br />
construction or production of qualifying assets, which are<br />
assets that necessarily take a substantial period of time<br />
to get ready for their intended use or sale, are added to<br />
the cost of those assets, until such time as the assets are<br />
substantially ready for their intended use or sale.<br />
All other borrowing costs are recognised in profit or loss in<br />
the period in which they are incurred.
3.11 share-based payMents<br />
Equity-settled share-based payments to employees and<br />
others providing similar services are measured at the fair<br />
value of the equity instruments at the grant date. Details<br />
regarding the determination of the fair value of equity-settled<br />
share-based transactions are set out in note 26.<br />
The fair value determined at the grant date of the equitysettled<br />
share-based payments is expensed on a straightline<br />
basis over the vesting period, based on the Company’s<br />
estimate of equity instruments that will eventually vest. At<br />
the end of each reporting period, the Company revises its<br />
estimate of the number of equity instruments expected<br />
to vest. The impact of the revision of the original estimates,<br />
if any, is recognised in profit or loss such that the<br />
cumulative expense reflects the revised estimate, with a<br />
corresponding adjustment to the equity-settled employee<br />
benefits reserve.<br />
3.12 taXation<br />
Income tax expense represents the sum of the tax currently<br />
payable and deferred tax.<br />
CURRENT TAX<br />
The tax currently payable is based on taxable profit for the<br />
period. Taxable profit differs from net profit as reported<br />
in the income statement because it excludes items of<br />
income or expense that are taxable or deductible in other<br />
periods and it further excludes items that are never taxable<br />
or deductible. The Consolidated Company’s current tax<br />
liability is calculated using the tax rates for each country.<br />
DEFERRED TAX<br />
Deferred tax is recognised on differences between the carrying<br />
amounts of assets and liabilities in the Consolidated<br />
Financial Statements and the corresponding tax bases<br />
used in the computation of taxable profit, and is accounted<br />
for using the balance sheet liability method. Deferred tax<br />
liabilities are generally recognised for all taxable temporary<br />
differences, and deferred tax assets are generally recognised<br />
for all deductible temporary differences to the extent<br />
that it is probable that taxable profits will be available<br />
against which those deductible temporary differences can<br />
be utilised. Such assets and liabilities are not recognised if<br />
the temporary difference arises from goodwill or from the<br />
initial recognition (other than in a business combination)<br />
of other assets and liabilities in a transaction that affects<br />
neither the taxable profit nor the accounting profit.<br />
Deferred tax liabilities are recognised for taxable temporary<br />
differences associated with investments in subsidiaries<br />
and associates, and interests in joint ventures, except<br />
where the Company is able to control the reversal of the<br />
temporary difference and it is probable that the temporary<br />
difference will not reverse in the foreseeable future.<br />
Deferred tax assets arising from deductible temporary differences<br />
associated with such investments and interests<br />
are only recognised to the extent that it is probable that<br />
there will be sufficient taxable profits against which to<br />
utilise the benefits of the temporary differences and they<br />
are expected to reverse in the foreseeable future.<br />
The carrying amount of deferred tax assets is reviewed at<br />
each balance sheet date and reduced to the extent that it<br />
is no longer probable that sufficient taxable profits will be<br />
available to allow all or part of the asset to be recovered.<br />
Deferred tax assets and liabilities are measured at the<br />
tax rates that are expected to apply in the period in which<br />
the liability is settled or the asset realised, based on tax<br />
rates (and tax laws) that have been enacted or substantively<br />
enacted at the balance sheet date. The measurement<br />
of deferred tax liabilities and assets reflects the tax consequences<br />
that would follow from the manner in which<br />
the Company expects, at the reporting date, to recover or<br />
settle the carrying amount of its assets and liabilities.<br />
Deferred tax assets and liabilities are offset when there<br />
is a legally enforceable right to set off current tax assets<br />
against current tax liabilities and when they relate to<br />
income taxes levied by the same taxation authority and the<br />
Company intends to settle its current tax assets and liabilities<br />
on a net basis.<br />
In the preparation of the Consolidated Financial<br />
Statements, accumulated gains in inventories from intercompany<br />
transactions are eliminated. This has an effect<br />
on the income tax expenses of the consolidated companies,<br />
and an adjustment is included in the deferred tax<br />
asset. Income tax expense is calculated in accordance with<br />
tax rates in the countries where the inventories originate.<br />
3.13 property, plant and equipMent<br />
Property, plant and equipment are recognised as an asset<br />
when it is probable that future economic benefits associated<br />
with the asset will flow to the consolidation and the<br />
cost of the asset can be measured in a reliable manner.<br />
Property, plant and equipment which qualifies for recognition<br />
as an asset is initially measured at cost.<br />
The cost of a property, plant and equipment comprises its<br />
purchase price and any directly attributable cost of bringing<br />
the asset to working condition for its intended use.<br />
The depreciable amount of the asset is allocated on a<br />
straight-line basis over its useful life. The depreciation<br />
charge for each period is recognised as an expense. The<br />
estimated useful lives, residual values and depreciation<br />
method are reviewed at each year end, with the effect of any<br />
changes in estimate accounted for on a prospective basis.<br />
All amounts in thousands of USD 69 <strong>annual</strong> report 09<br />
Össur hf. consolidated financial stateMents 2009
Össur hf. consolidated financial stateMents 2009<br />
Assets held under finance leases are depreciated over their<br />
expected useful lives on the same basis as owned assets.<br />
The gain or loss arising on the disposal or retirement of<br />
an asset is determined as the difference between the sales<br />
proceeds and the carrying amount of the asset and is<br />
recognised in the income statement.<br />
3.14 intangible assets<br />
INTANGIBLE ASSETS ACQUIRED SEPARATELY<br />
Intangible assets acquired separately are reported at cost<br />
less accumulated amortisation and accumulated impairment<br />
losses. Amortisation is charged on a straight-line<br />
basis over their estimated useful lives. The estimated useful<br />
life and amortisation method are reviewed at the end of<br />
each <strong>annual</strong> reporting period, with the effect of any changes<br />
in estimate being accounted for on a prospective basis.<br />
INTERNALLY-GENERATED INTANGIBLE ASSETS – RESEARCH<br />
AND DEvELOPMENT EXPENDITURE<br />
Expenditure on research activities is recognised as an<br />
expense in the period in which it is incurred.<br />
An internally-generated intangible asset arising from the<br />
Company’s development is recognised only if all of the<br />
following conditions are met: the technical feasibility of<br />
completing the intangible asset so that it will be available<br />
for use or sale; the intention to complete the intangible<br />
asset and use or sell it; the ability to use or sell the intangible<br />
asset; how the intangible asset will generate probable<br />
future economic benefits; the availability of adequate<br />
technical, financial and other resources to complete the<br />
development and to use or sell the intangible asset and<br />
the ability to measure reliably the expenditure attributable<br />
to the intangible asset during its development.<br />
<strong>annual</strong> report 09<br />
70<br />
The amount initially recognised for internally-generated<br />
intangible assets is the sum of the expenditure incurred<br />
from the date when the intangible asset first meets the<br />
recognition criteria listed above. Where no internally-generated<br />
intangible asset can be recognised, development<br />
expenditure is charged to profit or loss in the period in<br />
which it is incurred.<br />
Subsequent to initial recognition, internally-generated<br />
intangible assets are reported at cost less accumulated<br />
amortisation and accumulated impairment losses, on the<br />
same basis as intangible assets acquired separately.<br />
INTANGIBLE ASSETS ACQUIRED IN A BUSINESS<br />
COMBINATION<br />
Intangible assets acquired in a business combination<br />
are identified and recognised separately from goodwill<br />
where they satisfy the definition of an intangible asset<br />
and their fair values can be measured reliably. The cost<br />
of such intangible assets is their fair value at the acquisition<br />
date.<br />
Subsequent to initial recognition, intangible assets<br />
acquired in a business combination are reported at cost<br />
less accumulated amortisation and accumulated impairment<br />
losses, on the same basis as intangible assets<br />
acquired separately.<br />
3.15 iMpairMent of tangible and<br />
intangible assets eXcluding goodWill<br />
At each balance sheet date, the Company reviews the<br />
carrying amounts of its tangible and intangible assets<br />
to determine whether there is any indication that those<br />
assets have suffered an impairment loss. If any such<br />
indication exists, the recoverable amount of the asset is<br />
estimated in order to determine the extent of the impairment<br />
loss (if any). Where it is not possible to estimate the<br />
recoverable amount of an individual asset, the Company<br />
estimates the recoverable amount of the cash-generating<br />
unit to which the asset belongs. Where a reasonable and<br />
consistent basis of allocation can be identified, corporate<br />
assets are also allocated to individual cash-generating<br />
units, or otherwise they are allocated to the smallest group<br />
of cash-generating units for which a reasonable and consistent<br />
allocation basis can be identified.<br />
Intangible assets with indefinite useful lives and intangible<br />
assets not yet available for use are tested for impairment<br />
<strong>annual</strong>ly, and whenever there is an indication that the<br />
asset may be impaired.<br />
If the recoverable amount of an asset (or cash-generating<br />
unit) is estimated to be less than its carrying<br />
amount, the carrying amount of the asset (cash-generating<br />
unit) is reduced to its recoverable amount. An<br />
impairment loss is recognised immediately in profit or<br />
loss, unless the relevant asset is carried at a revalued<br />
amount, in which case the impairment loss is treated as<br />
a revaluation decrease.<br />
Where an impairment loss subsequently reverses, the<br />
carrying amount of the asset (cash-generating unit)<br />
is increased to the revised estimate of its recoverable<br />
amount, but so that the increased carrying amount does<br />
not exceed the carrying amount that would have been<br />
determined had no impairment loss been recognised for<br />
the asset (cash-generating unit) in prior years. A reversal<br />
of an impairment loss is recognised immediately in profit<br />
or loss, unless the relevant asset is carried at a revalued<br />
amount, in which case the reversal of the impairment loss<br />
is treated as a revaluation increase.
3.16 inventories<br />
Inventories are stated at the lower of cost and net realisable<br />
value. Costs, including an appropriate portion of fixed<br />
and variable overhead expenses, are assigned to inventories<br />
held by the method most appropriate to the particular<br />
class of inventory, with the majority being valued on a<br />
standard cost basis. Net realisable value represents the<br />
estimated selling price for inventories less all estimated<br />
costs of completion and costs necessary to make the sale.<br />
3.17 provisions<br />
Provisions are recognised when the Company has a present<br />
obligation as a result of a past event, it is probable<br />
that the Company will be required to settle the obligation,<br />
and a reliable estimate can be made of the amount of the<br />
obligation.<br />
The amount recognised as a provision is the best estimate<br />
of the consideration required to settle the present obligation<br />
at the balance sheet date, taking into account the<br />
risks and uncertainties surrounding the obligation. Where<br />
a provision is measured using the cash flows estimated<br />
to settle the present obligation, its carrying amount is the<br />
present value of those cash flows.<br />
When some or all of the economic benefits required to<br />
settle a provision are expected to be recovered from a<br />
third party, the receivable is recognised as an asset if it<br />
is virtually certain that reimbursement will be received<br />
and the amount of the receivable can be measured<br />
reliably.<br />
RESTRUCTURINGS<br />
A restructuring provision is recognised when the Company<br />
has developed a detailed formal plan for the restructuring<br />
and has started to implement it. The measurement of a<br />
restructuring provision includes only the direct expenditures<br />
arising from the restructuring, which are those<br />
amounts that are both necessarily entailed by the restructuring<br />
and not associated with the ongoing activities of<br />
the entity.<br />
WARRANTIES<br />
Provisions for warranty costs are recognised at the date<br />
of sale of the relevant products, at the directors’ best estimate<br />
of the expenditure required to settle the Company’s<br />
obligation.<br />
3.18 risk ManageMent<br />
Financial risk management is governed by the Company’s<br />
Financial Risk Management Policy, approved by the Board<br />
of Directors. The policy sets limits to the extent of financial<br />
risks and guidelines for financial transactions in general.<br />
The general policy is to apply natural currency hedging to<br />
the extent possible and prohibit any speculative trading of<br />
financial instruments.<br />
Long term financing is managed from the Company´s<br />
Corporate Finance function and individual subsidiaries do<br />
not engage in substantial external financing contracts with<br />
banks and/or credit institutions.<br />
The Company is outset for normal business risk in collecting<br />
accounts receivable. Adequate allowance is made for<br />
bad debt expenses.<br />
3.19 financial assets<br />
All financial assets are recognised and derecognised on<br />
a trade date where the purchase or sale of an investment<br />
is under a contract whose terms require delivery of the<br />
investment within the timeframe established by the market<br />
concerned, and are initially measured at fair value, net<br />
of transaction costs, except for those financial assets classified<br />
at fair value through profit or loss, which are initially<br />
measured at fair value.<br />
Financial assets are classified into the following specified<br />
categories: financial assets as ‘at fair value through<br />
profit or loss’ (FvTPL), ‘held-to-maturity investments’,<br />
‘available-for-sale’ (AFS) financial assets and ‘loans and<br />
receivables’. The classification depends on the nature and<br />
purpose of the financial assets and is determined at the<br />
time of initial recognition.<br />
EFFECTIvE INTEREST METHOD<br />
The effective interest method is a method of calculating<br />
the amortised cost of a debt instrument and of allocating<br />
interest income over the relevant period. The effective<br />
interest rate is the rate that exactly discounts estimated<br />
future cash receipts (including all fees on points paid or<br />
received that form an integral part of the effective interest<br />
rate, transaction costs and other premiums or discounts)<br />
through the expected life of the debt instrument, or, where<br />
appropriate, a shorter period to the net carrying amount<br />
on initial recognition.<br />
Income is recognised on an effective interest basis for<br />
debt instruments other than those financial assets classified<br />
as at fair value through profit or loss.<br />
FINANCIAL ASSETS AT FAIR vALUE THROUGH<br />
PROFIT OR LOSS<br />
Financial assets are classified as at fair value through profit<br />
or loss where the financial asset is either held for trading<br />
or it is designated as at fair value through profit or loss.<br />
Financial assets at fair value through profit or loss are stated<br />
at fair value, with any resultant gain or loss recognised<br />
in profit or loss. The net gain or loss recognised in profit<br />
All amounts in thousands of USD 71 <strong>annual</strong> report 09<br />
Össur hf. consolidated financial stateMents 2009
Össur hf. consolidated financial stateMents 2009<br />
or loss incorporates any dividend or interest earned on the<br />
financial asset.<br />
LOANS AND RECEIvABLES<br />
Account receivables, loans, and other receivables that<br />
have fixed or determinable payments that are not quoted<br />
in an active market are classified as loans and receivables.<br />
Loans and receivables are measured at amortised cost<br />
using the effective interest method, less any impairment.<br />
Interest income is recognised by applying the effective<br />
interest rate, except for short-term receivables when the<br />
recognition of interest would be immaterial.<br />
IMPAIRMENT OF FINANCIAL ASSETS<br />
Financial assets, other than those at FvTPL, are assessed<br />
for indicators of impairment at each balance sheet date.<br />
Financial assets are impaired where there is objective evidence<br />
that, as a result of one or more events that occurred<br />
after the initial recognition of the financial asset, the estimated<br />
future cash flows of the investment have been<br />
impacted.<br />
For certain categories of financial asset, such as account<br />
receivables, assets that are assessed not to be impaired<br />
individually are subsequently assessed for impairment on<br />
a collective basis. Objective evidence of impairment for a<br />
portfolio of receivables could include the Company’s past<br />
experience of collecting payments, an increase in the number<br />
of delayed payments in the portfolio past the companies<br />
average credit period, as well as observable changes<br />
in national or local economic conditions that correlate<br />
with default on receivables.<br />
For financial assets carried at amortised cost, the amount<br />
of the impairment is the difference between the asset’s<br />
carrying amount and the present value of estimated future<br />
cash flows, discounted at the financial asset’s original<br />
effective interest rate.<br />
<strong>annual</strong> report 09<br />
72<br />
The carrying amount of the financial asset is reduced<br />
by the impairment loss directly for all financial assets<br />
with the exception of trade receivables, where the carrying<br />
amount is reduced through the use of an allowance<br />
account. When a accounts receivable is considered uncollectible,<br />
it is written off against the allowance account.<br />
Subsequent recoveries of amounts previously written off<br />
are credited against the allowance account. Changes in the<br />
carrying amount of the allowance account are recognised<br />
in profit or loss.<br />
3.20 financial liabilities<br />
Financial liabilities are classified as either financial liabilities<br />
at ‘fair value through profit and loss’ or ‘other financial<br />
liabilities’.<br />
FINANCIAL LIABILITIES AT FAIR vALUE THROUGH PROFIT<br />
OR LOSS<br />
Financial liabilities are classified as at fair value through<br />
profit or loss when the financial liability is either held for<br />
trading or it is designated as at fair value through profit<br />
or loss.<br />
Financial liabilities at fair value through profit or loss<br />
are stated at fair value, with any gains or losses arising<br />
on remeasurement recognised in profit or loss. The net<br />
gain or loss recognised in profit or loss incorporates any<br />
interest paid on the financial liability and is included in<br />
the ‘other gains and losses’ line item in the statement of<br />
comprehensive income.<br />
OTHER FINANCIAL LIABILITIES<br />
Other financial liabilities, including borrowings, are initially<br />
measured at fair value, net of transaction costs.<br />
Other financial liabilities are subsequently measured at<br />
amortised cost using the effective interest method, with<br />
interest expense recognised on an effective yield basis.<br />
The effective interest method is a method of calculating<br />
the amortised cost of a financial liability and of allocating<br />
interest expense over the relevant period. The effective<br />
interest rate is the rate that exactly discounts estimated<br />
future cash payments through the expected life of the<br />
financial liability, or, where appropriate, a shorter period<br />
to the net carrying amount on initial recognition.<br />
DERECOGNITION OF FINANCIAL LIABILITIES<br />
The Company derecognises financial liabilities when, and<br />
only when, the Company’s obligations are discharged,<br />
cancelled or they expire.<br />
3.21 derivative financial instruMents<br />
The Company enters into a variety of derivative financial<br />
instruments to manage its exposure to interest rate and foreign<br />
exchange rate risk, including foreign exchange forward<br />
contracts and interest rate swaps. Further details of derivative<br />
financial instruments are disclosed in note 33.<br />
Derivatives are initially recognised at fair value at the date<br />
a derivative contract is entered into and are subsequently<br />
remeasured to their fair value at each balance sheet<br />
date. The resulting gain or loss is recognised in profit<br />
or loss immediately unless the derivative is designated<br />
and effective as a hedging instrument, in which event<br />
the timing of the recognition in profit or loss depends<br />
on the nature of the hedge relationship. The Company<br />
designates certain derivatives as either hedges of the fair<br />
value of recognised assets or hedges of net investments<br />
in foreign operations.
A derivative is presented as a non-current asset or a noncurrent<br />
liability if the remaining maturity of the instrument<br />
is more than 12 months and it is not expected to be<br />
realised or settled within 12 months. Other derivatives are<br />
presented as current assets or current liabilities.<br />
HEDGE ACCOUNTING<br />
The Company designates certain hedging instruments,<br />
which include derivatives and non-derivatives in respect of<br />
foreign currency risk, as either cash flow hedges or hedges<br />
of net investments in foreign operations. Hedges of foreign<br />
exchange risk on firm commitments are accounted<br />
for as cash flow hedges.<br />
At the inception of the hedge relationship the entity documents<br />
the relationship between the hedging instrument<br />
and hedged item, along with its risk management objectives<br />
and its strategy for undertaking various hedge transactions.<br />
Furthermore, at the inception of the hedge and on<br />
an ongoing basis, the Company documents whether the<br />
hedging instrument that is used in a hedging relationship<br />
is highly effective in offsetting changes in fair values or<br />
cash flows of the hedged item.<br />
The hedging reserve within equity represents the cumulative<br />
portion of gains and losses on hedging instruments<br />
deemed effective in cash flow hedges. The cumulative<br />
deferred gain or loss on the hedging instrument is reclassified<br />
to profit or loss only when the hedged transaction<br />
affects the profit or loss, or is included as a basis adjustment<br />
to the non-financial hedged item, consistent with the<br />
relevant accounting policy.<br />
Note 28 sets out details of the fair values of the derivative<br />
instruments used for hedging purposes. Movements in<br />
the hedging reserve in equity are also detailed in note 24.<br />
HEDGES OF NET INvESTMENTS IN FOREIGN OPERATIONS<br />
Any gain or loss on the hedging instrument relating to the<br />
effective portion of the hedge is recognised in equity in the<br />
foreign currency translation reserve.<br />
Gains and losses deferred in the foreign currency translation<br />
reserve are recognised in profit or loss on disposal of<br />
the foreign operation.<br />
4. critical accounting JudgeMents and<br />
key sources of estiMation uncertainty<br />
In the application of the Company’s accounting policies,<br />
which are described in note 3, the directors are required<br />
to make judgments, estimates and assumptions about<br />
the carrying amounts of assets and liabilities that are not<br />
readily apparent from other sources. The estimates and<br />
associated assumptions are based on historical experience<br />
and other factors that are considered to be relevant.<br />
Actual results may differ from these estimates.<br />
The estimates and underlying assumptions are reviewed<br />
on an ongoing basis. Revisions to accounting estimates<br />
are recognized in the period in which the estimate is<br />
revised if the revision affects only that period or in the<br />
period of the revision and future periods if the revision<br />
affects both current and future periods.<br />
Determining whether goodwill is impaired requires an<br />
estimations of the value in use of the cash-generating<br />
units to which goodwill has been allocated. The value in<br />
use calculation requires the entity to estimate the future<br />
cash flows expected to arise from the cash-generating unit<br />
and a suitable discount rate in order to calculate present<br />
value.<br />
As described at 3.15 above, the Company reviews the estimated<br />
useful lives of property, plant and equipment at the<br />
end of each <strong>annual</strong> reporting period.<br />
All amounts in thousands of USD 73 <strong>annual</strong> report 09<br />
Össur hf. consolidated financial stateMents 2009
Össur hf. consolidated financial stateMents 2009<br />
5. net sales<br />
Specified according to geographical segments:<br />
<strong>annual</strong> report 09<br />
74<br />
2009 2008<br />
Americas 159,278 160,353<br />
EMEA 156,906 173,627<br />
Asia 14,396 12,855<br />
Specified according to product lines:<br />
330,580 346,835<br />
Prosthetics 148,513 142,943<br />
Bracing and supports 161,732 178,755<br />
Compression Therapy (Phlebology) 18,159 20,082<br />
Other products 2,176 5,055<br />
Specified according to currency:<br />
330,580 346,835<br />
US Dollar, USD 159,080 166,217<br />
Euro, EUR 115,954 116,557<br />
British Pound, GBP 17,953 24,630<br />
Canadian Dollar, CAD 13,921 15,060<br />
Swedish Krona, SEK 11,326 12,111<br />
Norwegian Krona, NOK 6,708 6,559<br />
Australian Dollar, AUD 2,857 2,258<br />
Icelandic Krona, ISK 951 1,791<br />
Other 1,830 1,653<br />
330,580 346,835
6. geographical segMents<br />
The Company uses geographical markets as its primary segments. Segment information is presented below, according to location of customers:<br />
2009 AMERICAS EMEA ASIA ELIMINATIONS CONSOLIDATED<br />
REVENUE<br />
External sales 159,278 156,906 14,396 0 330,580<br />
Inter-segment sales 19,260 60,542 0 ( 79,802 ) 0<br />
Total revenue 178,538 217,448 14,396 ( 79,802 ) 330,580<br />
Inter-segment sales are calculated from production cost.<br />
RESULT<br />
Segment result 24,201 19,096 4,943 0 48,240<br />
Financial income/(expenses) ( 18,003 )<br />
Profit before tax 30,237<br />
Income tax ( 7,475 )<br />
Net profit 22,762<br />
OTHER INfORMATION<br />
Capital additions 1,856 7,668 155 0 9,679<br />
Depreciation and amortization 9,374 9,178 196 0 18,748<br />
STATEMENT Of fINANCIAL pOSITION 31.12.2009<br />
ASSETS<br />
Segment assets 429,724 1,034,923 8,378 ( 844,808 ) 628,217<br />
LIABILITIES<br />
Segment liabilities 308,668 588,956 8,469 ( 590,099 ) 315,994<br />
All amounts in thousands of USD 75 <strong>annual</strong> report 09<br />
Össur hf. consolidated financial stateMents 2009
Össur hf. consolidated financial stateMents 2009<br />
2008 AMERICAS EMEA ASIA ELIMINATIONS CONSOLIDATED<br />
REVENUE<br />
External sales 160,353 173,627 12,855 0 346,835<br />
Inter-segment sales 26,712 75,787 0 ( 102,498 ) 0<br />
Total revenue 187,064 249,414 12,855 ( 102,498 ) 346,835<br />
RESULT<br />
Segment result 21,892 30,612 3,454 0 55,958<br />
Financial income/(expenses) ( 17,725 )<br />
Profit before tax 38,233<br />
Income tax ( 9,745 )<br />
Net profit 28,488<br />
OTHER INfORMATION<br />
Capital additions 2,073 5,184 497 0 7,754<br />
Depreciation and amortization 13,533 9,887 62 0 23,482<br />
STATEMENT Of fINANCIAL pOSITION 31.12.2008<br />
ASSETS<br />
Segment assets 406,532 926,189 4,245 ( 733,188 ) 603,778<br />
LIABILITIES<br />
Segment liabilities 295,042 553,895 6,353 ( 501,160 ) 354,130<br />
<strong>annual</strong> report 09<br />
76
7. other incoMe<br />
Included in other income in 2008 is a gain amounting to 8.4 million USD related to sale of<br />
the Advanced Wound Care product line to BSN medical GmbH, a leading global provider<br />
of wound care products.<br />
8. salaries<br />
Salaries and salary-related expenses, paid by the consolidation, are specified as follows:<br />
2009 2008<br />
Salaries 76,714 85,273<br />
Salary-related expenses 27,110 27,751<br />
103,824 113,023<br />
Average number of positions 1,532 1,587<br />
Salaries and salary-related expenses, classified by operational category, are specified as<br />
follows:<br />
2009 2008<br />
Cost of goods sold 37,285 41,525<br />
Sales and marketing 41,838 43,826<br />
Research and development 7,052 7,235<br />
General and administrative 17,648 20,438<br />
103,824 113,023<br />
MANAGEMENT SALARIES AND BENEfITS<br />
SALARIES STOCK SHARES<br />
AND RELATED Exp. OpTIONS OWNED<br />
BOARD Of DIRECTORS:<br />
Niels Jacobsen Chairman of the Board (i) 50 0 168,694,203<br />
Thordur Magnusson vice Chairman (ii) 38 0 85,448,671<br />
Arne Boye Nielsen 0 0 0<br />
Kristjan Tomas Ragnarsson 25 0 623,789<br />
Svafa Gronfeldt 25 0 0<br />
Össur Kristinsson, former board member 25 0 0<br />
ExECUTIVE COMMITTEE:<br />
Jón Sigurðsson President and CEO 924 1,250,000 15,168<br />
Hjörleifur Pálsson CFO 382 308,000 0<br />
Egill Jonsson vP of Manufacturing & Operations 305 308,000 822,749<br />
Hilmar Bragi Janusson vP of R&D 324 308,000 0<br />
Mahesh Mansukhani Presid. of S&M America 514 500,000 0<br />
Ólafur Gylfason Man. Director S&M EMEA 545 308,000 0<br />
The shares owned by members of the board and executive committee are either owned by<br />
them personally or through holding companies.<br />
(i) Shares owned by William Demant Invest A/S which Niels Jacobsen represents on the<br />
Board.<br />
(ii) Shares owned by Eyrir Invest ehf. of which Thordur Magnusson ownes 20.3% and is<br />
the Chairman of the Board.<br />
All amounts in thousands of USD 77 <strong>annual</strong> report 09<br />
Össur hf. consolidated financial stateMents 2009
Össur hf. consolidated financial stateMents 2009<br />
9. fees to auditors<br />
<strong>annual</strong> report 09<br />
78<br />
2009 2008<br />
Audit of Financial Statements 839 710<br />
Review of Interim Financial Statements 243 252<br />
Other services 118 235<br />
10. financial incoMe / (eXpenses)<br />
fINANCIAL INCOME:<br />
1,200 1,198<br />
2009 2008<br />
Interests on bank deposits 205 204<br />
Income from other financial assets 11 0<br />
Fair value changes of derivatives 0 640<br />
Other financial income 38 20<br />
fINANCIAL ExpENSES:<br />
254 864<br />
Interest on bank overdrafts and loans ( 15,479 ) ( 17,627 )<br />
Expenses from other financial assets 0 ( 131 )<br />
Other financial expenses ( 108 ) ( 545 )<br />
( 15,587 ) ( 18,303 )<br />
Net-exchange rate differences ( 2,670 ) ( 286 )<br />
Net Financial income / (expenses) ( 18,003 ) ( 17,725 )<br />
11. incoMe taX<br />
2009 2008<br />
Current tax expenses ( 4,996 ) ( 465 )<br />
Deferred tax expenses ( 2,479 ) ( 9,280 )<br />
( 7,475 ) ( 9,745 )<br />
2009 2008<br />
AMOUNT % AMOUNT %<br />
Profit before taxes 30,237 38,233<br />
Income tax calculated at 15% ( 4,536 ) 15% ( 5,735 ) 15%<br />
Effect of different tax rates of other jurisdictions ( 2,645 ) 9% ( 1,585 ) 4%<br />
Effect of nondeductible expenses 450 ( 1% ) ( 1,126 ) 3%<br />
Effect of change in tax rate 518 ( 2% ) ( 590 ) 2%<br />
Other changes ( 1,262 ) 4% ( 709 ) 2%<br />
Deferred tax:<br />
( 7,475 ) 25% ( 9,745 ) 25%<br />
2009 2008<br />
Origination and reversal of temporary differences 5,907 5,600<br />
Write-downs (reversals of previous w-d) of deferred tax assets 47 936<br />
Losses recognised and utilised ( 4,008 ) 2,088<br />
Effect of changes in tax rate and laws 533 656<br />
Total deferred tax expense 2,479 9,280
Deferred tax balances:<br />
OpENING RECOGNISED IN RECOGNISED ACqUISITIONS / ExC. RATE<br />
2008 BALANCE INCOME STATEMENT DIRECTLY IN EqUITY DISpOSALS DIffERENCE RECLASSIfIED NET<br />
Goodwill 44,706 ( 5,918 ) 1,361 7,322 47,471<br />
Intangible assets ( 30,988 ) 4,021 ( 930 ) 821 ( 27,076 )<br />
Operating fixed assets 452 1,203 15 ( 821 ) 849<br />
Tax loss carry forward 6,180 ( 1,594 ) 185 4,771<br />
Inventories 3,440 ( 284 ) 131 3,287<br />
Provisions 2,091 250 ( 221 ) 63 2,183<br />
Current liabilities 7,199 ( 5,540 ) 216 1,875<br />
Other 1,186 ( 1,418 ) 1,412 ( 53 ) 1,127<br />
Total 34,266 ( 9,280 ) 1,191 0 988 7,322 34,487<br />
OpENING RECOGNISED IN RECOGNISED ACqUISITIONS / ExC. RATE<br />
2009 BALANCE INCOME STATEMENT DIRECTLY IN EqUITY DISpOSALS DIffERENCE RECLASSIfIED NET<br />
Goodwill 47,471 ( 6,125 ) ( 661 ) 222 ( 16,051 ) 24,856<br />
Intangible assets ( 27,076 ) 5,245 221 ( 594 ) 16,051 ( 6,153 )<br />
Operating fixed assets 849 ( 24 ) 43 868<br />
Tax loss carry forward 4,771 ( 682 ) 147 359 4,595<br />
Inventories 3,287 ( 893 ) 3 2,397<br />
Provisions 2,183 ( 1,666 ) 100 ( 700 ) ( 83 )<br />
Current liabilities 1,875 ( 420 ) 73 10 1,538<br />
Other 1,127 2,086 240 ( 128 ) 3,325<br />
Total 34,487 ( 2,479 ) 313 ( 293 ) 15 ( 700 ) 31,343<br />
All amounts in thousands of USD 79 <strong>annual</strong> report 09<br />
Össur hf. consolidated financial stateMents 2009
Össur hf. consolidated financial stateMents 2009<br />
12. earnings per share<br />
The calculation of Earnings per Share is based on the following data:<br />
<strong>annual</strong> report 09<br />
80<br />
2009 2008<br />
Net profit 22,762 28,488<br />
Total average number of shares outstanding<br />
during the year (in thousands) 427,776 422,982<br />
Total average number of shares including potential<br />
shares (in thousands) 429,750 423,026<br />
Basic Earnings per Share (US cent) 5.32 6.74<br />
Diluted Earnings per Share (US cent) 5.30 6.73<br />
Cash Earnings per Share 9.70 12.29<br />
Diluted Cash Earnings per Share 9.66 12.29<br />
13. additional inforMation regarding cash floW<br />
2009 2008<br />
Net profit 22,762 28,488<br />
Items not affecting cash 21,711 29,582<br />
Working capital provided by operating activities 44,473 58,070<br />
Decrease / (increase) in inventories 13,787 ( 4,567 )<br />
Decrease in receivable 4,279 535<br />
Increase / (decrease) in payables 6,616 ( 1,203 )<br />
Net cash provided by operating activities 69,155 52,835<br />
NON-CASH TRANSACTIONS<br />
During the year the Company entered into the following non-cash investing and financing<br />
activities which are not reflected in the statement of cash flows:<br />
In February 2009 the Company refinanced its loan facilities where a bridge loan facility<br />
agreement with the outstanding amount of USD 48.7 million was converted to a longterm<br />
facility. This transaction is not reflected in the statement of cash flow.<br />
The purchase of 62.25% of shares in Team Makena was partly paid with the issue of a<br />
bond which is not reflected in the statement of cash flows.
14. property, plant and equipMent<br />
Operating fixed assets are specified as follows:<br />
BUILDINGS MACHINERY fIxTURES<br />
2008 & SITES & EqUIpMENT & OffICE EqUIp. TOTAL<br />
COST<br />
At 1 January 2008 17,274 34,286 28,182 79,742<br />
Additions 419 3,870 3,465 7,754<br />
Exchange rate differences ( 620 ) ( 1,880 ) ( 1,025 ) ( 3,525 )<br />
Eliminated on disposal 0 ( 1,776 ) ( 794 ) ( 2,570 )<br />
Fully depreciated assets 0 ( 471 ) 0 ( 471 )<br />
At 31 December 2008 17,073 34,029 29,828 80,930<br />
ACCUMULATED DEpRECIATION<br />
At 1 January 2008 8,351 20,731 14,690 43,772<br />
Charge for the period 525 3,339 4,863 8,727<br />
Exchange rate differences ( 355 ) ( 1,515 ) ( 585 ) ( 2,455 )<br />
Eliminated on disposal 0 ( 954 ) ( 616 ) ( 1,570 )<br />
Fully depreciated assets 0 ( 471 ) 0 ( 471 )<br />
At 31 December 2008 8,521 21,130 18,352 48,003<br />
Carrying Amount at 31 December 2008 8,552 12,899 11,476 32,927<br />
BUILDINGS MACHINERY fIxTURES<br />
All amounts in thousands of USD 81 <strong>annual</strong> report 09<br />
Össur hf. consolidated financial stateMents 2009
Össur hf. consolidated financial stateMents 2009<br />
14. property, plant and equipMent (continued)<br />
BUILDINGS MACHINERY fIxTURES<br />
2009 & SITES & EqUIpMENT & OffICE EqUIp. TOTAL<br />
COST<br />
At 1 January 2009 17,073 34,029 29,828 80,930<br />
Reclassification 0 302 0 302<br />
Classified as held for sale ( 3,214 ) 0 0 ( 3,214 )<br />
Additions 850 5,008 3,771 9,629<br />
Acquired on acquisition of subsidiary 0 1,496 89 1,585<br />
Exchange rate differences 347 1,004 537 1,888<br />
Eliminated on disposal 0 ( 1,392 ) ( 532 ) ( 1,924 )<br />
Fully depreciated assets 0 ( 110 ) ( 26 ) ( 136 )<br />
At 31 December 2009 15,056 40,337 33,667 89,060<br />
ACCUMULATED DEpRECIATION<br />
At 1 January 2009 8,521 21,130 18,352 48,003<br />
Reclassification 0 274 0 274<br />
Classified as held for sale ( 906 ) 0 0 ( 906 )<br />
Charge for the period 429 3,338 4,413 8,180<br />
Acquired on acquisition of subsidiary 0 1,289 83 1,372<br />
Exchange rate differences 200 833 326 1,359<br />
Eliminated on disposal 0 ( 1,138 ) ( 234 ) ( 1,372 )<br />
Fully depreciated assets 0 ( 110 ) ( 26 ) ( 136 )<br />
At 31 December 2009 8,244 25,616 22,914 56,774<br />
Carrying Amount at 31 December 2009 6,812 14,721 10,753 32,286<br />
<strong>annual</strong> report 09<br />
82
Depreciation classified by operational category, is shown in the following schedule:<br />
2009 2008<br />
Cost of goods sold 3,594 3,507<br />
Sales and marketing expenses 603 678<br />
Research and development expenses 317 319<br />
General and administrative expenses 3,666 4,223<br />
The following useful lives are used in the calculation of depreciation:<br />
8,180 8,727<br />
Buildings 20 - 50 years<br />
Fixtures & furniture 3 - 10 years<br />
Machinery & equipment 4 - 10 years<br />
ASSETS pLEDGED AS SECURITY<br />
All the Company´s assets have been pledged in relation to financing arranged by Arion<br />
Bank. The Company is not allowed to pledge the assets as security to raise further<br />
financing.<br />
15. goodWill<br />
2008 / 2009<br />
COST<br />
At 1 January 2008 342,359<br />
Reclassification of Goodwill to deferred tax ( 7,322 )<br />
Addition due to previous acquisitions 2,399<br />
Exchange rate differences ( 15,055 )<br />
At 31 December 2008 322,381<br />
Arising on acquisition of subsidiaries 7,083<br />
Exchange rate differences 5,380<br />
At 31 December 2009 334,844<br />
During the year, the Company assessed the recoverable amount of goodwill and determined<br />
that none of the Company´s cash-generating units have suffered an impairment<br />
loss.<br />
15.1 allocation of goodWill to cash-generating units<br />
In April 2009 improvements to IAS 36 were issued that apply prospectively for periods<br />
beginning on or after 1. January 2010. The Company adopted the amendment before<br />
effective date. The effect of the early adoption is a reallocation of the Company’s goodwill<br />
to the operating segments.<br />
The carrying amount of goodwill was allocated to the following cash-generating units:<br />
WACC % 2009 2008<br />
Americas 11.72 / 10.03 205,312 196,280<br />
EMEA 12.03 / 11.03 126,611 123,524<br />
Asia 11.57 / 11.33 2,921 2,577<br />
All amounts in thousands of USD 83 <strong>annual</strong> report 09<br />
334,844 322,381<br />
The recoverable amount of the cash-generating units is determined based on a value in<br />
use calculation which uses cash flow projections based on the financial budget for 2010<br />
approved by the directors. The discount rate of 11.57. - 12.03% (2008: 10.0 - 11.3%) per<br />
annum was used.<br />
Cash flows beyond 2014 have been extrapolated using a steady 3% per annum growth<br />
rate. This growth rate does not exceed the long-term average growth rate for the market<br />
in each market area. The directors believe that any reasonably further change in the<br />
key assumptions on which recoverable amount is based would not cause the carrying<br />
amount to exceed its recoverable amount.<br />
Össur hf. consolidated financial stateMents 2009
Össur hf. consolidated financial stateMents 2009<br />
16. other intangible assets<br />
CUST./DISTRIB.<br />
2008 RELATIONSHIp pATENTS TRADEMARKS OTHER TOTAL<br />
COST<br />
At 1 January 2008 29,731 16,615 36,307 16,784 99,437<br />
Exchange rate differences ( 1,496 ) ( 758 ) ( 1,564 ) 0 ( 3,818 )<br />
At 31 December 2008 28,235 15,857 34,743 16,784 95,619<br />
AMORTIzATION<br />
At 1 January 2008 14,097 8,451 5,568 9,524 37,640<br />
Charge for the year 8,828 2,362 1,125 2,440 14,755<br />
Exchange rate differences ( 916 ) ( 565 ) ( 470 ) 0 ( 1,951 )<br />
At 31 December 2008 22,009 10,248 6,223 11,964 50,444<br />
Carrying amount at 31 December 2008 6,226 5,609 28,520 4,820 45,175<br />
CUST./DISTRIB.<br />
2009 RELATIONSHIp pATENTS TRADEMARKS OTHER TOTAL<br />
COST<br />
At 1 January 2009 28,235 15,857 34,743 16,784 95,619<br />
Reclassification 0 ( 302 ) 0 0 ( 302 )<br />
Additions 0 0 0 50 50<br />
Fully depreciated assets 0 ( 373 ) 0 ( 1,350 ) ( 1,723 )<br />
Exchange rate differences 784 493 636 0 1,913<br />
At 31 December 2009 29,019 15,675 35,379 15,484 95,557<br />
AMORTIzATION<br />
At 1 January 2009 22,009 10,248 6,223 11,964 50,444<br />
Reclassification 0 ( 274 ) 0 0 ( 274 )<br />
Charge for the period 5,760 2,256 480 2,072 10,568<br />
Fully depreciated assets 0 ( 373 ) 0 ( 1,350 ) ( 1,723 )<br />
Exchange rate differences 539 389 174 58 1,160<br />
At 31 December 2009 28,308 12,246 6,877 12,744 60,175<br />
Carrying amount at 31 December 2009 711 3,429 28,502 2,740 35,382<br />
<strong>annual</strong> report 09<br />
84
Amortization classified by operational category, is shown in the following schedule:<br />
2009 2008<br />
Cost of goods sold 8 70<br />
Sales and marketing expenses 6,765 9,096<br />
Research and development expenses 3,441 4,185<br />
General and administrative expenses 354 1,404<br />
10,568 14,755<br />
Part of the intangible assets included above have finite useful lives, over which the assets are amortized.<br />
These intangible assets will be amortized on a straight line basis over their useful lives.<br />
The following useful lives are used in the calculation of amortisation.<br />
Customer and distribution relationships 4 - 5 years<br />
Patents 5 - 50 years<br />
Trademarks 3 - infinitive<br />
Other 3 - 10 years<br />
The Company main intangible assets are in relation to the acquisition of Royce Medical and<br />
Gibaud Group.The amortization in 2009 amounted to USD 10.5 million (2008: 14.8 million) and<br />
the expected amount for 2010 is USD 5.2 million. The Gibaud trademarks amounting to USD 16.1<br />
million are estimated to have infinitive life. The trademark has been well established within the<br />
French market since the foundation of the company in 1890.<br />
All amounts in thousands of USD 85 <strong>annual</strong> report 09<br />
Össur hf. consolidated financial stateMents 2009
Össur hf. consolidated financial stateMents 2009<br />
17. the consolidation<br />
NAME Of SUBSIDIARY<br />
pLACE Of REGISTRATION<br />
AND OpERATION OWNERSHIp % pRINCIpAL ACTIVITY<br />
Össur Holding, AB Sweden 100% Holding<br />
Össur Nordic, AB Sweden 100% Sales, distribution and services<br />
Össur Nordic, AS Norway 100% Sales, distribution and services<br />
Össur Americas Holdings, Inc. USA 100% Holding<br />
Össur Americas, Inc. USA 100% Manufacturer, sales, distribution and services<br />
Empower Reimbursement Services Inc. USA 100% Services<br />
Empower Business Solutions, Inc USA 100% No operation<br />
Team Makena LLC USA 62% Distribution<br />
Össur Funding LLC USA 100% Holding<br />
Össur Canada, Inc. Canada 100% Manufacturer, sales, distribution and services<br />
Össur Europe Holding, Bv Netherlands 100% Holding<br />
Össur Europe, Bv Netherlands 100% Sales, distribution and services<br />
Össur UK, Holdings, Ltd UK 100% Holding<br />
IMP Holdings, Ltd UK 100% Holding<br />
Össur UK, Ltd UK 100% Sales, distribution and services<br />
TIM Holdings, Ltd UK 100% Holding<br />
TIM, Ltd UK 100% Distribution and services<br />
IMP. Ltd UK 100% No operation<br />
Ortex, Ltd. UK 100% No operation<br />
Medistox, Ltd UK 100% No operation<br />
Össur Iberia SA Spain 100% Sales, distribution and services<br />
Össur Holding France SAS France 100% Holding<br />
La tour Finance SAS France 100% Holding<br />
Gibaud Pharma EURL France 100% Immaterial Operations<br />
Gibaud SAS France 100% Manufacturer, sales, distribution and services<br />
Tournier Bottu SAS France 100% Manufacturer<br />
Gibaud Suisse SA Swiss 100% Sales, distribution and services<br />
Össur Asia Pacific PTY, Ltd. Australia 100% Sales, distribution and services<br />
Össur Prosth. & Rehabilit. Co, Ltd. China 100% Manufacturer, sales, distribution and services<br />
Össur Holding Bv Netherlands 100% Holding<br />
Össur Hong Kong Limited Hong Kong 100% No operation<br />
Gentleheal ehf. Iceland 100% No operation<br />
Össur hf. operates a finance branch in Switzerland to govern certain intercompany long-term liabilities.<br />
Three new companies were established in 2009, Empower Reimbursement Services Inc., Össur Holding Bv and Össur Hong Kong Limited.<br />
Furthermore, the company acquired a 62,25% stake in Team Makena LLC, which is a distribution company in America.<br />
<strong>annual</strong> report 09<br />
86
18. other financial assets<br />
fINANCIAL ASSETS CARRIED AT fAIR VALUE THROUGH pROfIT OR LOSS (fVTpL)<br />
31.12.2009 31.12.2008<br />
Investment in associates 1,445 96<br />
Loans and receivables 2,122 1,060<br />
INVESTMENTS IN ASSOCIATES<br />
NAME<br />
Derby<br />
Finances, SAS<br />
Dashe<br />
Orthopedic<br />
Supplies, Inc.<br />
pLACE Of<br />
REGISTRATION<br />
AND<br />
OpERATION<br />
OWNER-<br />
SHIp<br />
%<br />
3,567 1,156<br />
pRINCIpAL<br />
ACTIVITY 31.12.2009 31.12.2008<br />
France 50% Manufacturer 21 22<br />
USA 50% Distribution 1,424 0<br />
Orthomart Inc USA 30% Distribution 0 74<br />
1,445 96<br />
The Company acquired a 50% stake in Dashe Orthopedic Supplies Inc, which is a distribution<br />
company in America.<br />
19. assets classified as held for sale<br />
The Company intents to dispose of its office facilities in Aliso viejo, California. The book<br />
value of these assets is USD 2.3 million in December 2009. The assets have been put on<br />
sale and will be vacated when the Company headquarters in the Americas will be relocated<br />
in March 2010.<br />
20. bank balances and cash<br />
31.12.2009 31.12.2008<br />
Bank accounts 76,619 27,836<br />
Bankers draft received 2,818 2,840<br />
Cash and other cash equivalents 395 230<br />
21. inventories<br />
All amounts in thousands of USD 87 <strong>annual</strong> report 09<br />
79,831 30,906<br />
31.12.2009 31.12.2008<br />
Raw material 14,397 16,756<br />
Work in progress 3,170 5,191<br />
Finished goods 25,959 33,871<br />
43,526 55,818<br />
In the preparation of the Consolidated Financial Statements, accumulated gains in inventories<br />
from intercompany transactions amounting to 8.1 million (2008: 10.2 million) were<br />
eliminated. This has an effect on the income tax expense of the consolidated companies,<br />
and an adjustment of 2.1 million (2008: 2.6 million) is made in the Consolidated<br />
Financial Statements to reduce income tax expense to account for this.<br />
22. accounts receivables and other assets<br />
31.12.2009 31.12.2008<br />
Nominal value 47,940 47,552<br />
Allowances for doubtful accounts ( 3,521 ) ( 3,016 )<br />
Allowances for sales return ( 726 ) ( 715 )<br />
43,693 43,821<br />
The average credit period on sales of goods is 43 days (2008: 49 days). Allowance has<br />
been made for doubtful accounts and sales returns, this allowance has been determined<br />
by management in reference to past default experience. The directors consider that the<br />
carrying amount of receivables approximates their fair value.<br />
Össur hf. consolidated financial stateMents 2009
Össur hf. consolidated financial stateMents 2009<br />
AGING Of ACCOUNTS RECEIVABLES<br />
<strong>annual</strong> report 09<br />
88<br />
31.12.2009 31.12.2008<br />
Less than three months 41,464 41,269<br />
Three to six months 6,288 3,228<br />
Six to nine months 79 726<br />
Older than nine months 109 2,329<br />
MOVEMENT IN THE ALLOWANCE fOR DOUBTfUL ACCOUNTS<br />
47,940 47,552<br />
2009 2008<br />
At 1 January ( 3,016 ) ( 3,797 )<br />
Impairment losses recognised on receivables 582 ( 1,004 )<br />
Arising on acquisition ( 1,341) 0<br />
Amounts written off as uncollectible 288 1,542<br />
Exchange rate difference ( 34 ) 243<br />
At 31 December ( 3,521 ) ( 3,016 )<br />
In determining the recoverability of an accounts receivable, the Company considers any<br />
change in the credit quality of the accounts receivable from the date credit was initially<br />
granted up to the reporting date. The concentration of credit risk is limited due to the<br />
customer base being large and unrelated. Accordingly, the directors believe that there is<br />
no further credit provision required in excess of the allowance for doubtful debts.<br />
OTHER ASSETS<br />
31.12.2009 31.12.2008<br />
vAT refundable 1,779 865<br />
Prepaid expenses 5,174 5,497<br />
Other 3,460 3,669<br />
10,413 10,031<br />
23. issued capital<br />
Common stock is as follows in millions of shares and USD thousands:<br />
SHARES NOMINAL<br />
VALUE<br />
Total share capital at year-end 454 5,068<br />
Shares issued and outstanding at period-end totalled of 453,732,008 (2008: 423 million).<br />
The nominal value of each share is one Icelandic krona.<br />
Changes in share capital are as follows:<br />
SHARE SHARE ISSUED<br />
CApITAL pREMIUM CApITAL<br />
Balance at 1 January 2008 4,821 168,477 173,298<br />
Cost due to increasing capital 0 ( 396 ) ( 396 )<br />
Balance at 1 January 2009 4,821 168,081 172,902<br />
29,500,000 fully paid ordinary shares 3 Nov 2009 237 27,572 27,809<br />
1,250,000 fully paid ordinary shares 30 Nov 2009 10 1,276 1,286<br />
Balance at 31 December 2009 5,068 196,929 201,997<br />
24. reserves<br />
STOCK TRANS-<br />
STATUTORY OpTION HEDGING LATION TOTAL<br />
RESERVE RESERVE RESERVE RESERVE RESERVES<br />
Balance at 1 January 2008 1,043 332 552 22,380 24,307<br />
Loss on cash flow hedges ( 8.605 ) ( 8,605 )<br />
Share option charge for the period 657 657<br />
Transferred to statutory reserves 162 162<br />
Gain on hedge of a net investment 1,252 1,252<br />
Transl. diff. of foreign operations ( 22,031 ) ( 22,031 )<br />
Balance at 1 January 2009 1,205 989 ( 8,053 ) 1,602 ( 4,257 )<br />
Loss on cash flow hedges ( 427 ) ( 427 )<br />
Share option charge for the period 426 426<br />
Loss on hedge of a net investment ( 997 ) ( 997 )<br />
Transl. diff. of foreign operations 10,775 10,775<br />
Transferred to statutory reserves 62 62<br />
Balance at 31 December 2009 1,267 1,415 ( 8,480 ) 11,380 5,582
25. retained earnings<br />
RETAINED<br />
EARNINGS<br />
At 1 January 2008 52,677<br />
Transferred to statutory reserves ( 162 )<br />
Net profit 28,488<br />
At 1 January 2009 81,003<br />
Transferred to statutory reserves ( 62 )<br />
Net profit 22,706<br />
At 31 December 2009 103,647<br />
26. stock option contracts<br />
and obligations to increase share capital<br />
The Company has in place a share option plan, approved at the Company’s Annual<br />
General Meetings, under which managers may be granted options to purchase ordinary<br />
shares at an exercise price, which is the average of the Company’s share price twenty<br />
working days prior to the grant date.<br />
Each employee share option converts into one ordinary share on exercise. No amounts<br />
are paid or payable by the recipient on receipt of the option. The options carry neither<br />
rights to dividends nor voting rights. The options expire one month after the exercise<br />
date.<br />
The Company’s listing on NASDAQ OMX Copenhagen activated a clause in the share<br />
option agreements changing the exercise price from ISK to DKK using the exchange rate<br />
at grant date. This lowered the estimated remaining cost due to the stock option contracts<br />
by USD 0.8 million.<br />
The following share-based payment arrangements were in existence at year end:<br />
GRANT/ fAIR VALUE<br />
NUMBER<br />
ISSUE<br />
DATE<br />
ExERCISE ExERCISE AT GRANT<br />
DATE pRICE DKK DATE (i)<br />
Issued to Executive Management 1,540,000 5.2.07 1.12.11 7.8 5.5<br />
Issued to President and CEO 1,250,000 5.2.07 1.12.11 7.8 5.5<br />
Issued to Management team 1,950,000 23.2.08 23.2.12 6.9 5.5<br />
Issued to Executive Management 500,000 15.7.08 15.7.12 5.4 5.5<br />
Issued to Management team 200,000 2.3.09 2.3.13 4.4 5.2<br />
Issued to Management team 300,000 15.12.09 15.12.13 5.2 5.2<br />
Total issued option contracts 5,740,000<br />
(i) Date of conversion in DKK.<br />
The employee must remain continuously employed with Össur until expiring date, either<br />
as an employee or in any other way, deemed satisfactory by the Company.<br />
2009 2008<br />
WEIGHTED WEIGHTED<br />
NUMBER Of AVERAGE NUMBER Of AVERAGE<br />
SHARES (IN CONTRACT SHARES (IN CONTRACT<br />
THOUSANDS) RATE (IN DKK) THOUSANDS) RATE (IN ISK)<br />
Outstanding at beginning of year 5,740 7.2 3,098 92.3<br />
Granted during the year 500 4.9 3,150 91.2<br />
Forfeited during the year ( 500 ) 6.9 ( 508 ) 91.9<br />
Outstanding at the end of the year 5,740 7.0 5,740 91.7<br />
Estimated remaining cost due to the stock option contracts are USD 1.0 million which<br />
will be expensed over the next four years. An expense of USD 0.5 million is recognised in<br />
the Income Statement for the period.<br />
All amounts in thousands of USD 89 <strong>annual</strong> report 09<br />
Össur hf. consolidated financial stateMents 2009
Össur hf. consolidated financial stateMents 2009<br />
27. borroWings<br />
<strong>annual</strong> report 09<br />
CURRENT NON - CURRENT<br />
31.12.2009 31.12.2008 31.12.2009 31.12.2008<br />
Secured – at amortized cost<br />
Loans in USD 13,641 13,630 102,721 116,339<br />
Loans in EUR 13,022 7,172 104,886 66,736<br />
Other borrowings 496 32 2,675 42<br />
Bank overdrafts 23 7,583 0 0<br />
Bridge loan in EUR 0 53,653 0 0<br />
At end of year 27,182 82,070 210,282 183,117<br />
Aggregated <strong>annual</strong> maturities of long term loans are as follows:<br />
31.12.2009 31.12.2008<br />
In 2010 / 2009 27,159 20,834<br />
In 2011 / 2010 104,006 20,886<br />
In 2012 / 2011 103,601 75,604<br />
In 2013 / 2012 0 86,627<br />
90<br />
234,766 203,951<br />
In February 2009 the Company refinanced its loan facilities. The bridge loan facility agreement<br />
with the outstanding amount of USD 48.7 million was converted to a long term<br />
facility and interest was renegotiated for all the facilities.<br />
The terms of the loan facilities include various provisions that limit certain actions by the<br />
Company without prior consulting with the lender. In addition, the loan facilities include<br />
certain financial covenants. The Company has pledged certain assets, including buildings,<br />
machinery, equipment and inventories to secure banking facilities granted.<br />
Debt issuance cost has been capitalized and is amortized over the term of the loan. The<br />
remaining amount is USD 1.2 million at year-end.<br />
The terms of the loan facility include various provisions that limit certain actions by the<br />
Company without prior consulting with the lender. In addition the loan facilities include<br />
certain financial covenants.<br />
28. other financial liabilities<br />
Outstanding interest rate swap contracts (cash flow hedge) at 31 December 2009 are<br />
due over the next three years. The contracts´ fair value is negative USD 10.0 million and<br />
principal amount USD 147 million.<br />
29. deferred taX asset / (liability)<br />
31.12.2009 31.12.2008<br />
At beginning of period 34,487 34,266<br />
Income tax payable for the period 4,996 376<br />
Calculated tax for the period ( 7,475 ) ( 9,656 )<br />
Reclassification to deferred tax asset/ (liability) ( 700 ) 7,322<br />
Recognised due to acquisition / disposal of subsidiaries ( 293 ) 0<br />
Recognised directly through equity 313 1,191<br />
Exchange rate differences 15 988<br />
The following are the major deferred tax liabilities and assets recognised:<br />
31,343 34,487<br />
ASSETS LIABILITIES NET<br />
Goodwill 28,619 ( 3,763 ) 24,856<br />
Intangible assets 522 ( 6,675 ) ( 6,153 )<br />
Operating fixed assets 1,046 ( 178 ) 868<br />
Tax loss carry forward 4,595 0 4,595<br />
Inventories 2,397 0 2,397<br />
Provisions 617 ( 700 ) ( 83 )<br />
Current liabilities 1,809 ( 271 ) 1,538<br />
Other 3,325 0 3,325<br />
Total tax assets/ (liabilities) 42,930 ( 11,587 ) 31,343<br />
Tax asset and liabilities offsetting ( 563 ) 563 0<br />
Total 42,367 ( 11,024 ) 31,343
30. provisions<br />
CURRENT NON-CURRENT<br />
31.12.2009 31.12.2008 31.12.2009 31.12.2008<br />
Warranty (i) 715 3,835 4,271 2,704<br />
Restructuring (ii) 0 3,017 0 0<br />
Other 1,971 807 1,971 871<br />
2,686 7,659 5,744 3,575<br />
(i) The warranty provision represents management’s best estimate of the Company’s<br />
liability under warranties granted on prosthetics products, based on past experience<br />
and industry averages for defective products.<br />
(ii) The restructuring provision is related to the acquisition of Gibaud in December 2006.<br />
WARRANTY RESTRUCTURING OTHER<br />
pROVISIONS pROVISIONS pROVISIONS TOTAL<br />
At 1 January 2008 4,194 3,788 2,059 10,041<br />
Additional provision recognised 4,225 0 ( 238 ) 3,987<br />
Utilization of provision ( 1,880 ) ( 604 ) 0 ( 2,484 )<br />
Exchange differences 0 ( 167 ) ( 143 ) ( 310 )<br />
At 31 December 2008 6,539 3,017 1,678 11,234<br />
Additional provision recognised 3,633 0 1,157 4,790<br />
Utilization of provision ( 3,686 ) ( 2,753 ) ( 264 ) ( 6,703 )<br />
Exchange differences 0 ( 264 ) 0 ( 264 )<br />
Reclassification ( 1,500 ) 0 873 ( 627 )<br />
At 31 December 2009 4,986 0 3,444 8,430<br />
Non-current 4,271 0 1,473 5,744<br />
Current 715 0 1,471 2,686<br />
At 31 December 2009 4,986 0 3,444 8,430<br />
31. related party transactions<br />
The Company had no material transactions with related parties in 2009.<br />
32. other liabilities<br />
31.12.2009 31.12.2008<br />
Accrued expenses 11,999 7,279<br />
Accrued salaries and related expenses 14,760 12,928<br />
Accrued Royalties 1,185 1,334<br />
Sales tax and vAT 934 429<br />
Payable due to previous acquisition 2,324 2,324<br />
Other 2,075 1,839<br />
33. financial instruMents<br />
33.1 capital risk ManageMent<br />
All amounts in thousands of USD 91 <strong>annual</strong> report 09<br />
33,276 26,132<br />
The Company manages its capital to ensure that entities in the Company will be able to<br />
continue as a going concern while maximizing the return to stakeholders through the<br />
optimisation of the debt and equity balance. The Company’s overall strategy remains<br />
unchanged from the previous period.<br />
The capital structure of the Company consists of debt, which includes the borrowings<br />
disclosed in note 27, cash and cash equivalents and equity attributable to equity holders<br />
of the parent, comprising issued capital, reserves and retained earnings as disclosed in<br />
notes 23, 24 and 25 respectively.<br />
EQUITY RATIO<br />
The Company’s management continuously reviews the capital structure. As part of this<br />
review, the management considers amongst other the cost of capital. The Company has<br />
a target equity ratio of minimum 30% determined as the proportion of equity to total<br />
assets.<br />
The equity ratio at the year-end was as follows:<br />
31.12.2009 31.12.2008<br />
Equity 312,223 249,648<br />
Total assets 628,217 603,778<br />
Equity ratio 49.7% 41.3%<br />
Össur hf. consolidated financial stateMents 2009
Össur hf. consolidated financial stateMents 2009<br />
33.2 significant accounting polices<br />
Details of the significant accounting policies and methods adopted, including the criteria<br />
for recognition, the basis of measurement and the basis on which income and expenses<br />
are recognised, in respect of each class of financial asset, financial liability and equity<br />
instrument are disclosed in note 3 to the Consolidated Financial Statements.<br />
33.3 financial risk ManageMent obJectives<br />
The Company’s Corporate finance function provides services to the business, co-ordinates<br />
access to domestic and international financial markets, monitors and manages<br />
the financial risks relating to the operations of the Company through internal risk reports<br />
which analyse exposures by degree and magnitude of risks. These risks include market<br />
risk (including currency risk, fair value interest rate risk and price risk), credit risk, liquidity<br />
risk and cash flow interest rate risk.<br />
The Company seeks to minimise the effects of these risks by using derivative financial<br />
instruments to hedge these risk exposures. The use of financial derivatives is governed<br />
by the Company’s policies approved by the board of directors, which provide written principles<br />
on foreign exchange risk, interest rate risk, credit risk, the use of financial derivatives<br />
and non-derivative financial instruments, and the investment of excess liquidity. The<br />
Company does not enter into or trade financial instruments, including derivative financial<br />
instruments, for speculative purposes.<br />
33.4 foreign currency risk ManageMent<br />
The Company operates on a global market hence exposure to exchange rate fluctuations<br />
arise. Exchange rate exposures are managed within approved policy parameters. The<br />
general policy is to apply natural exchange rate hedging to the extent possible but the<br />
Company also utilizes forward foreign exchange contracts when appropriate.<br />
The carrying amounts of the Company´s foreign currency denominated monetary assets<br />
and monetary liabilities at the reporting date are as follows:<br />
<strong>annual</strong> report 09<br />
92<br />
LIABILITIES ASSETS<br />
31.12.2009 31.12.2008 31.12.2009 31.12.2008<br />
USD 148,144 156,000 75,052 67,498<br />
EUR 137,838 151,193 62,419 55,936<br />
DKK 0 0 28,563 0<br />
GBP 1,664 1,169 4,407 8,046<br />
SEK 3,055 2,196 5,542 5,370<br />
CAD 532 358 2,445 2,296<br />
Other 5,306 4,905 4,910 2,587<br />
296,540 315,820 183,338 141,732<br />
FOREIGN CURRENCY SENSITIvITY ANALYSIS<br />
The Company is mainly exposed to the currency of Iceland (ISK) and the European Union<br />
(EUR).<br />
The following table details the Company´s sensitivity to a 10% decrease in USD against<br />
the relevant foreign currencies with all other variables fixed. The sensitivity analysis<br />
includes all foreign currency denominated items and adjusts their translation at the period<br />
end for a 10% change in foreign currency rates. The table below indicates the effect on<br />
profit or loss and other equity where USD weakens 10% against the relevant currency. For<br />
a 10% strengthening of USD against the relevant currency, there would be an equal and<br />
opposite impact on the profit or loss and other equity.<br />
EUR (i) ISK (ii)<br />
2009 2008 2009 2008<br />
Profit or loss 2,514 2,549 ( 2,488 ) ( 2,952 )<br />
Other equity 7,792 6,264 305 ( 287 )<br />
(i) 30% (2008: 28%) of the Company´s cost is in EUR against 35% (2008: 32%) of its<br />
total income causing an increase in profit if the USD decreases against the EUR<br />
(ii) This is attributable to the fact that approximately 9% (2008: 10%) of the Company´s<br />
operating cost is in ISK against 0.3% (2008: 0.5%) of its income.<br />
33.5 interest rate risk ManageMent<br />
The Company is exposed to interest rate risk as funds are mainly borrowed at floating<br />
interest rates. Interest rate risk is managed by the Corporate Finance function by maintaining<br />
an appropriate mix between fixed and floating rate borrowings, by the use of interest<br />
rate swap contracts. Hedging activities are evaluated regularly to align with interest<br />
rate views and defined risk appetite; ensuring optimal hedging strategies are applied.
The Company’s exposures to interest rates on financial assets and financial liabilities are<br />
detailed in the liquidity risk management section of this note.<br />
Contracts with nominal values of USD 140 million and EUR 48.6 million have been made<br />
to swap floating interest rates to fixed with an average weighted interest rate of 5.69%<br />
for periods up to 2012. The fair value of interest rate swaps at the reporting date is determined<br />
by discounting the future cash flows using the curves at reporting date and the<br />
credit risk inherent in the contract, and is disclosed below. The average interest rate is<br />
based on the outstanding balances at the start of the financial period.<br />
Outstanding interest rate swap contracts (cash flow hedge) at 31 December 2009 are<br />
due over the next three years. The contracts´ fair value is negative USD 10.0 million<br />
(2008: negative USD 9.5 million) and principal amount USD 147 million (2008: USD 167<br />
million).<br />
Following the collapse of Kaupthing Bank in October 2008, the treatment of Össur’s<br />
interest rate swap agreements has been subject to uncertainty. In April 2009, Össur formally<br />
declared the agreements void and invalid, based on the counterparty’s inability to<br />
fulfil its obligations according to the agreements. Kaupthing Bank has argued that the<br />
agreements remained in full force. In January 2010, Kaupthing Bank formally declared<br />
that the agreements had been closed as of 30 December 2009 because Össur had denied<br />
to pay outstanding payments and put up collateral. Preliminary settlement discussions<br />
between Össur and Kaupthing Bank are currently ongoing. As a precaution, the agreements<br />
will continue to be accounted for according to International Financial Reporting<br />
Standards in the Company’s Consolidated Financial Statements. At the end of December<br />
their market value amounted to minus USD 10.0 million (2008: 9.5 million). Changes in<br />
market value are realized through equity.<br />
33.6 liquidity risk ManageMent<br />
The Company manages liquidity risk by maintaining adequate reserves, banking facilities<br />
and reserve borrowing facilities, by monitoring forecast and actual cash flows and matching<br />
the maturity profiles of financial assets and liabilities. At period end the Company had<br />
undrawn revolving credit facilities at its disposal amounting to USD 10.8 million (2008:<br />
0.8 million) to further reduce liquidity risk.<br />
The following tables detail the Company´s remaining contractual maturity for its nonderivative<br />
financial liabilities. The tables have been drawn up based on the undiscounted<br />
cash flows of financial liabilities based on the earliest date on which the Company can be<br />
required to pay. The table includes both interest and principal cash flows.<br />
WEIGHTED<br />
AVERAGE LESS<br />
EffECTIVE THAN<br />
INTEREST 1 YEAR 1–5 YEARS 5+ YEARS TOTAL<br />
2009<br />
Borrowings 5.69% 39,994 225,314 0 265,308<br />
Non-interest bearing liabilities – 49,081 0 0 49,081<br />
89,075 225,314 0 314,389<br />
2008<br />
Borrowings 5.95% 97,882 208,769 0 306,651<br />
Non-interest bearing liabilities – 41,159 0 0 41,159<br />
34. operating lease arrangeMents<br />
139,041 208,769 0 347,810<br />
Payments recognised as an expense:<br />
2009 2008<br />
Minimum lease payments 7,807 7,641<br />
Non-cancellable operating lease commitments<br />
31.12.2009 31.12.2008<br />
Not longer than 1 year 8,485 5,964<br />
Longer than 1 year and not longer than 5 years 24,429 16,691<br />
Longer than 5 years 11,217 7,735<br />
All amounts in thousands of USD 93 <strong>annual</strong> report 09<br />
44,131 30,390<br />
Operating lease payments represent rentals payable by the consolidation for certain<br />
of its office properties and cars. Thirty rental agreements are in place for premises in<br />
Reykjavik, Netherlands, Germany, Canada, Australia, Sweden, United Kingdom, China<br />
and the United States. The leases expire in the periods 2010-2017.<br />
Össur hf. consolidated financial stateMents 2009
Össur hf. consolidated financial stateMents 2009<br />
35. litigation<br />
On 5 December 2006, Össur hf., parent company of Össur North America Inc. and<br />
Royce Medical Inc., Össur America’s predecessor companies, disclosed to the Office of<br />
Inspector General of the U.S. Department of Defence that Össur North America, Inc. and<br />
Royce Medical Company may have made some sales to the government that were not<br />
consistent with the requirements of the Buy American Act or Trade Agreements Act. A<br />
review was conducted by third party experts of the sales and the circumstances surrounding<br />
the sales. The review’s conclusions were sent in a report to the Inspector General of<br />
the Department of Defence in the last quarter of 2007. The likely outcome of this matter<br />
remains uncertain.<br />
36. insurance<br />
INSURANCE BOOK<br />
VALUE VALUE<br />
Fixed assets and inventories 170,728 82,684<br />
<strong>annual</strong> report 09<br />
94<br />
The consolidation has purchased a business interruption insurance intended to compensate<br />
for temporary breakdown of operations. The insurance amount is USD 349 million.<br />
In addition the consolidation has a product & professional liability insurance with a USD<br />
30 million limit and a product recall insurance with a USD 2 million limit. The deductable<br />
amount on the product & professional liability and product recall insurances is USD 50<br />
thousand.<br />
37. approval of the consolidated financial stateMents<br />
The Consolidated Financial Statements were approved by the Board of Directors and<br />
authorised for issue on February 3th 2010.
unaudited inforMation<br />
The following notes are not audited as they relate to quarterly information and the Company only requires an audit for the full year.<br />
q4 q3 q2 q1<br />
2009 2009 2009 2009 2009<br />
Net sales 87,871 84,184 81,345 77,180 330,580<br />
Cost of goods sold ( 34,863 ) ( 32,463 ) ( 31,284 ) ( 30,155 ) ( 128,765 )<br />
Gross profit 53,008 51,721 50,061 47,025 201,815<br />
Other income 131 18 120 227 ( 496 )<br />
Sales and marketing expenses ( 23,451 ) ( 21,948 ) ( 23,105 ) ( 24,063) ( 92,567 )<br />
Research and development expenses ( 5,132 ) ( 4,170 ) ( 4,813 ) ( 4,965 ) ( 19,080 )<br />
General and administrative expenses ( 10,834 ) ( 10,725 ) ( 10,490 ) ( 10,375 ) ( 42,424 )<br />
Profit from operations 13,722 14,896 11,773 7,849 48,240<br />
Financial income 69 45 70 70 254<br />
Financial expenses ( 4,073 ) ( 4,047 ) ( 4,080 ) ( 3,387 ) ( 15,587 )<br />
Net exchange rate difference 793 ( 4,196 ) ( 4,481 ) 5,214 ( 2,670 )<br />
Total financial income/(expenses) ( 3,211 ) ( 8,198 ) ( 8,491 ) 1,897 ( 18,003 )<br />
Profit before tax 10,511 6,698 3,282 9,746 30,237<br />
Income tax ( 2,437 ) ( 1,938 ) ( 927 ) ( 2,173 ) ( 7,475 )<br />
Net profit 8,074 4,760 2,355 7,573 22,762<br />
EBITDA 17,812 19,355 16,958 12,863 66,988<br />
All amounts in thousands of USD 95 <strong>annual</strong> report 09<br />
Össur hf. consolidated financial stateMents 2009
forWard-looking stateMents<br />
This <strong>annual</strong> report contains projections and other forward-looking statements regarding future events and/or the future financial<br />
performance of Össur hf. You can identify forward-looking statements by term, such as “expect,” “believe,” “anticipate,” “estimate,”<br />
“intend,” “will,” “could,” “may” or “might” or the negative of such terms or other similar expressions. We wish to caution you that these<br />
statements are only predictions, and that actual events or results may differ materially. We do not intend to update these statements to<br />
reflect events and circumstances occurring after the date hereof or to reflect the occurrence of unanticipated events. Many factors could<br />
cause the actual results to differ materially from those contained in our projections or forward-looking statements, including, among<br />
others, general economic conditions, our competitive environment, rapid technological and market change in our industries, as well as<br />
many other risks specifically related to Össur hf. and its operations.<br />
The Össur Annual Report has been prepared in-house by Össur employees. All photos in the report are existing marketing material.<br />
The only external cost occurred is for printing and proofreading.
<strong>annual</strong> report 2009<br />
Production: Össur Corporate Finance<br />
Design and Layout: Össur hf.<br />
Printed by: Oddi hf<br />
Photography: Grímur Bjarnason<br />
Takao Ochi et al.<br />
Copyright©Össur February 2010<br />
offices<br />
<strong>össur</strong> head office<br />
Grjothals 5<br />
110 Reykjavik, Iceland<br />
Tel. + 354 515 1300<br />
<strong>össur</strong> americas<br />
albion<br />
910 Burnstein Drive<br />
Albion, Michigan 49224, USA<br />
Tel. + 517 629 8890<br />
aliso viejo<br />
27412 Aliso Viejo Pkwy<br />
Aliso Viejo, CA 92656, USA<br />
Tel. + 800 233 6263<br />
Tel. + 949 362 3883<br />
camarillo<br />
742 Pancho Road<br />
Camarillo, CA 93012, USA<br />
Tel. + 805 484 2600<br />
foothill ranch<br />
19762 Pauling<br />
Foothill Ranch, CA 92610, USA<br />
Tel. + 949 859 4407<br />
paulsboro<br />
Mid Atlantic Corporate Center<br />
1414 Metropolitan Ave<br />
Paulsboro, New Jersey 08066, USA<br />
Tel. + 800 923 9760<br />
richmond<br />
12111 Jacobson Way<br />
Richmond, BC<br />
V6W 1L5, Canada<br />
Tel. + 604 241 8152<br />
<strong>össur</strong> europe<br />
ekkersrijt 4112-4114<br />
PO Box 120,<br />
5690 AC Son, The Netherlands<br />
Tel. + 800 3539 3668<br />
Tel. + 31 499 462840<br />
customer service germany<br />
Römerfeldstrasse 2<br />
50259, Pulheim, Germany<br />
Tel. + 49 2238 305850<br />
manchester<br />
Building 3000<br />
Manchester Business Park<br />
Aviator Way,<br />
Manchester M22 5TG, UK<br />
Tel. + 8450 065 065<br />
uppsala<br />
Box 67<br />
751 03 Uppsala, Sweden<br />
Tel. + 46 1818 2200<br />
gibaud<br />
73. Rue de la Tour-BP 78<br />
42002 St-Etienne Cedex 01, France<br />
Tel. + 33 4 7791 3030<br />
<strong>össur</strong> asia<br />
shanghai<br />
1801 Hongmei Road, 2F W16 B<br />
200233, Shanghai, China<br />
Tel. + 86 21 6127 1700<br />
sydney<br />
2 Redbank Road<br />
Northmead NSW 2152, Australia<br />
Tel. + 61 2 9630 9206<br />
www.ossur.com
ÖSSUR HF.<br />
HEAD OFFICE<br />
Grjothals 5<br />
110 Reykjavik, Iceland<br />
Tel. + 354 515 1300<br />
www.ossur.com