Download PDF, 1698 kB - Evira
Download PDF, 1698 kB - Evira
Download PDF, 1698 kB - Evira

You also want an ePaper? Increase the reach of your titles
YUMPU automatically turns print PDFs into web optimized ePapers that Google loves.
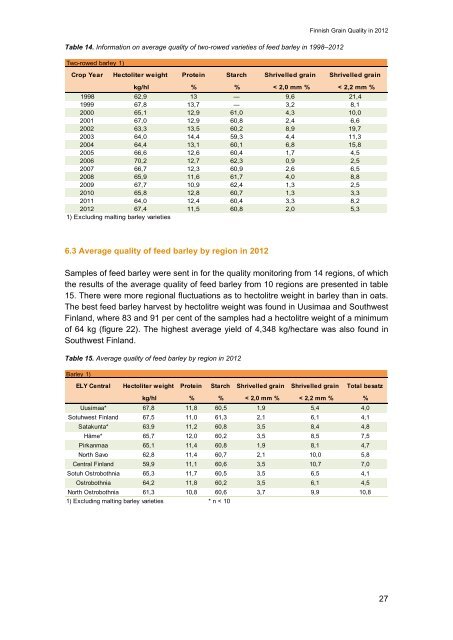
Table 14. Information on average quality of two-rowed varieties of feed barley in 1998–2012<br />
Two-rowed barley 1)<br />
6.3 Average quality of feed barley by region in 2012<br />
Finnish Grain Quality in 2012<br />
Crop Year Hectoliter weight Protein Starch Shrivelled grain Shrivelled grain<br />
kg/hl % % < 2,0 mm % < 2,2 mm %<br />
1998 62,9 13 ― 9,6 21,4<br />
1999 67,8 13,7 ― 3,2 8,1<br />
2000 65,1 12,9 61,0 4,3 10,0<br />
2001 67,0 12,9 60,8 2,4 6,6<br />
2002 63,3 13,5 60,2 8,9 19,7<br />
2003 64,0 14,4 59,3 4,4 11,3<br />
2004 64,4 13,1 60,1 6,8 15,8<br />
2005 66,6 12,6 60,4 1,7 4,5<br />
2006 70,2 12,7 62,3 0,9 2,5<br />
2007 66,7 12,3 60,9 2,6 6,5<br />
2008 65,9 11,6 61,7 4,0 8,8<br />
2009 67,7 10,9 62,4 1,3 2,5<br />
2010 65,8 12,8 60,7 1,3 3,3<br />
2011 64,0 12,4 60,4 3,3 8,2<br />
2012 67,4 11,5 60,8 2,0 5,3<br />
1) Excluding malting barley varieties<br />
Samples of feed barley were sent in for the quality monitoring from 14 regions, of which<br />
the results of the average quality of feed barley from 10 regions are presented in table<br />
15. There were more regional fluctuations as to hectolitre weight in barley than in oats.<br />
The best feed barley harvest by hectolitre weight was found in Uusimaa and Southwest<br />
Finland, where 83 and 91 per cent of the samples had a hectolitre weight of a minimum<br />
of 64 kg (figure 22). The highest average yield of 4,348 kg/hectare was also found in<br />
Southwest Finland.<br />
Table 15. Average quality of feed barley by region in 2012<br />
Barley 1)<br />
ELY Central Hectoliter weight Protein Starch Shrivelled grain Shrivelled grain Total besatz<br />
kg/hl % % < 2,0 mm % < 2,2 mm % %<br />
Uusimaa* 67,8 11,8 60,5 1,9 5,4 4,0<br />
Sotuhwest Finland 67,5 11,0 61,3 2,1 6,1 4,1<br />
Satakunta* 63,9 11,2 60,8 3,5 8,4 4,8<br />
Häme* 65,7 12,0 60,2 3,5 8,5 7,5<br />
Pirkanmaa 65,1 11,4 60,8 1,9 8,1 4,7<br />
North Savo 62,8 11,4 60,7 2,1 10,0 5,8<br />
Central Finland 59,9 11,1 60,6 3,5 10,7 7,0<br />
Sotuh Ostrobothnia 65,3 11,7 60,5 3,5 6,5 4,1<br />
Ostrobothnia 64,2 11,8 60,2 3,5 6,1 4,5<br />
North Ostrobothnia 61,3 10,8 60,6 3,7 9,9 10,8<br />
1) Excluding malting barley varieties * n ˂ 10<br />
27