

Anaerobic Digestion of Municipal Solid Waste - faculty.ait.ac.th ...
Anaerobic Digestion of Municipal Solid Waste - faculty.ait.ac.th ...
Anaerobic Digestion of Municipal Solid Waste - faculty.ait.ac.th ...

Create successful ePaper yourself
Turn your PDF publications into a flip-book with our unique Google optimized e-Paper software.
Abstr<strong>ac</strong>t:<br />
ANAEROBIC DIGESTION OF MUNICIPAL SOLID WASTE IN<br />
THERMOPHILIC CONTINUOUS OPERATION<br />
Chea Eliyan, Radha Adhikari, Jeanger P. Juanga and Chettiyappan Visvana<strong>th</strong>an ∗<br />
Environmental Engineering and Management Program, Asian Institute <strong>of</strong> Technology,<br />
P.O. Box 4, Klong Luang, Pa<strong>th</strong>um<strong>th</strong>ani 12120, Thailand<br />
<strong>Anaerobic</strong> digestion <strong>of</strong> Organic Fr<strong>ac</strong>tion <strong>of</strong> <strong>Municipal</strong> <strong>Solid</strong> <strong>Waste</strong> (OFMSW) is investigated in<br />
continuous operation. During <strong>th</strong>e re<strong>ac</strong>tor’s start-up period (first phase), <strong>th</strong>e process is stable and<br />
<strong>th</strong>ere is no inhibition occurred as me<strong>th</strong>ane composition increased and leveled <strong>of</strong>f at 66% wi<strong>th</strong> higher<br />
rate <strong>of</strong> biogas production. In <strong>th</strong>e second phase, <strong>th</strong>e re<strong>ac</strong>tor was fed in continuous mode and <strong>th</strong>e<br />
effect <strong>of</strong> mass retention time (MRT) on <strong>th</strong>e digestion process was investigated. The highest VS<br />
degradation <strong>of</strong> 51%, wi<strong>th</strong> biogas production rate <strong>of</strong> 401 L/kg VSremoved was <strong>ac</strong>hieved wi<strong>th</strong> a<br />
retention time <strong>of</strong> 25 days. However, <strong>th</strong>e me<strong>th</strong>ane content <strong>of</strong> <strong>th</strong>e biogas produced was in <strong>th</strong>e range <strong>of</strong><br />
30-40%. The drop <strong>of</strong> me<strong>th</strong>ane concentration was tr<strong>ac</strong>ed from <strong>th</strong>e technical problems on re<strong>ac</strong>tor<br />
configuration and not on <strong>th</strong>e process. Thus, designing a single stage re<strong>ac</strong>tor in dry-continuous<br />
anaerobic digestion system is a challenge for fur<strong>th</strong>er investigation.<br />
Keywords: <strong>Anaerobic</strong> digestion, Mass Retention Time, Organic Fr<strong>ac</strong>tion <strong>of</strong> <strong>Municipal</strong> <strong>Solid</strong> <strong>Waste</strong>,<br />
Thermophilic<br />
1. INTRODUCTION<br />
<strong>Solid</strong> waste management is an important environmental issue in urban areas. Increased waste<br />
generation, rising proportions <strong>of</strong> p<strong>ac</strong>kaging and toxic compounds in <strong>Municipal</strong> <strong>Solid</strong> <strong>Waste</strong> (MSW)<br />
lead to various problems in waste disposal. Increased environmental awareness and concerns over<br />
direct landfilling have stimulated new appro<strong>ac</strong>hes for solid waste treatment before disposal. Various<br />
alternatives are available for pretreatment <strong>of</strong> Organic Fr<strong>ac</strong>tion <strong>of</strong> <strong>Municipal</strong> <strong>Solid</strong> <strong>Waste</strong>s<br />
(OFMSW) before disposal namely, biological, physical and chemical processes.<br />
Biological processes like composting and <strong>Anaerobic</strong> <strong>Digestion</strong> (AD) provide advantages due to<br />
its natural treatment process over o<strong>th</strong>er technologies. AD has unique and integrative potential,<br />
simultaneously <strong>ac</strong>ting as a waste treatment and resource recovery process. AD also showed an<br />
excellent Life Cycle Analysis (LCA) performance as compared to o<strong>th</strong>er treatment technologies like<br />
composting or incineration as it can improve <strong>th</strong>e energy balance (Mata-Avarez, 2003). In addition,<br />
<strong>th</strong>e residues are stable compost potential for agricultural purpose (Torres-Castillo et al., 1995).<br />
This research aims at assessing <strong>th</strong>e effectiveness <strong>of</strong> <strong>th</strong>e AD me<strong>th</strong>od as <strong>th</strong>e pretreatment technology<br />
<strong>of</strong> OFMSW prior to landfill using different detention times in a pilot scale re<strong>ac</strong>tor in a continuous<br />
mode <strong>of</strong> operation.<br />
∗ Corresponding au<strong>th</strong>or: Tel: +66 2 524 5640; Fax: +66 2 524 5625; email: visu@<strong>ait</strong>.<strong>ac</strong>.<strong>th</strong><br />
1
2. MATERIAL AND METHODS<br />
2.1 Feedstock Preparation<br />
<strong>Solid</strong> waste used in <strong>th</strong>is study was collected from Taklong municipality dumpsite, Pa<strong>th</strong>um<strong>th</strong>ani,<br />
Thailand. The representative waste sample was manually segregated to retain <strong>th</strong>e organic fr<strong>ac</strong>tion<br />
and was subjected to particle size reduction (10 mm) by mechanical shredding. During <strong>th</strong>e start-up<br />
phase <strong>of</strong> <strong>th</strong>e process, 20% <strong>of</strong> total waste loaded during <strong>th</strong>e start-up was added as inoculums. The<br />
inoculum consisted <strong>of</strong> cow dung, anaerobic sludge, digested waste and matured le<strong>ac</strong>hate obtained<br />
from previous study (Adhikari, 2006). The experiments were carried out in <strong>th</strong>ermophilic (55°C)<br />
condition. The chemicals and physical analyses <strong>of</strong> samples were carried out for every collection in<br />
triplicate. Char<strong>ac</strong>teristic <strong>of</strong> <strong>th</strong>e solid waste is presented in Table 1.<br />
Table1. Feedstock Char<strong>ac</strong>teristics<br />
Parameters Value Parameters (mg/kg TS) Value<br />
Moisture content (MC) (%WW) 88-91 Cadmium (Cd) 0.3<br />
Total solid (TS) (%WW) 9-12 Lead (Pb) Not Detectable<br />
Volatile solid (VS) (%TS) 82.3-83.7 Zinc (Zn) 72.2<br />
Fixed solid (FS) (%TS) 17.7-16.3 Copper (Cu) 15.3<br />
N (% DM) 3.0 Chromium (Cr) 7.3<br />
P (% DM) 0.2 Nickel (Ni) 4.1<br />
K (% DM) 0.2 Manganese (Mn) 88.1<br />
C (%) 45.7 Mercury (Hg) 0.04<br />
C/N 15.0<br />
2.2 Experimental Set-up<br />
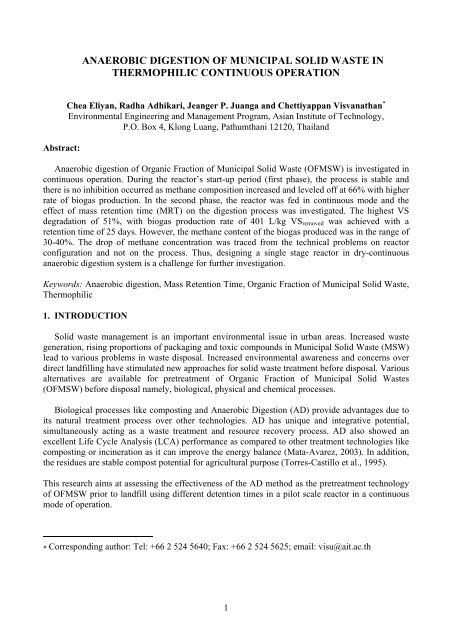
The experiments were performed in a stainless steel horizontal re<strong>ac</strong>tor wi<strong>th</strong> working volume <strong>of</strong><br />
600 L. The re<strong>ac</strong>tor’s feeding system consists <strong>of</strong> cover plate att<strong>ac</strong>hed wi<strong>th</strong> a movable shaft and a 2 m<br />
piston annexed to <strong>th</strong>e upper left <strong>of</strong> re<strong>ac</strong>tor. At <strong>th</strong>e o<strong>th</strong>er side (lower right) an outlet for <strong>th</strong>e digested<br />
waste and <strong>th</strong>e le<strong>ac</strong>hate is provided <strong>th</strong>at is fitted wi<strong>th</strong> movable paddle. Optimum <strong>th</strong>ermophilic<br />
condition (55°C) was maintained by a digital temperature controller wherein hot water from water<br />
ba<strong>th</strong> is circulating <strong>th</strong>rough <strong>th</strong>e double walled j<strong>ac</strong>ket <strong>of</strong> <strong>th</strong>e re<strong>ac</strong>tor. The gas outlet <strong>of</strong> <strong>th</strong>e re<strong>ac</strong>tor was<br />
connected a gas meter. Additionally, <strong>th</strong>e re<strong>ac</strong>tor is well insulated to minimize <strong>th</strong>e heat loss. Figure 1<br />
shows <strong>th</strong>e experimental set-up.<br />
2.3 Analytical Me<strong>th</strong>ods<br />
The parameters analyzed for <strong>th</strong>e char<strong>ac</strong>terization <strong>of</strong> OFMSW include Moisture Content (MC),<br />
Total <strong>Solid</strong> (TS), and Volatile <strong>Solid</strong> (VS) and selected heavy metals such as Cadmium (Cd), Lead<br />
(Pb), Zinc (Zn), Copper (Cu), Chromium (Cr), Nickel (Ni), Manganese (Mn), and Mercury (Hg).<br />
Nutrients analysis was also conducted by following ASTM standards (1993). Le<strong>ac</strong>hate was<br />
analyzed daily for <strong>th</strong>e following parameters, pH, alkalinity, VFA, NH3-N, TKN using Standard<br />
Me<strong>th</strong>od for Examination <strong>of</strong> Water and <strong>Waste</strong>water (APHA, AWWA, and WEF, 1998).<br />
2
Feeding Part<br />
Temperature<br />
Controller<br />
Hot Water Tank Drum Type Gas Meter Gas Sampling Point Le<strong>ac</strong>hate Tank<br />
& Rotation Paddle<br />
3. RESULTS AND DISCUSSION<br />
Figure 1. Experimental set-up<br />
This research was conducted into two stages, namely: re<strong>ac</strong>tor start-up (Phase 1); and continuous<br />
operation (Phase 2).<br />
3.1 Phase 1: Re<strong>ac</strong>tor Start-up<br />
In <strong>th</strong>is phase, <strong>th</strong>e re<strong>ac</strong>tor was fed wi<strong>th</strong> 300 kg <strong>of</strong> substrates, which is equal to 80% <strong>of</strong> re<strong>ac</strong>tor’s<br />
volume. The substrate was mixed well wi<strong>th</strong> inoculums (20% <strong>of</strong> total feedstock) before loading to<br />
<strong>th</strong>e re<strong>ac</strong>tor to initiate <strong>th</strong>e digestion process. Separate inoculum <strong>ac</strong>climatization was not conducted.<br />
However, <strong>th</strong>e re<strong>ac</strong>tor’s temperature was started-up in mesophilic and <strong>th</strong>en <strong>th</strong>e temperature was<br />
gradually increased by 2°C/day until <strong>th</strong>e optimum <strong>th</strong>ermophilic (55°C) was re<strong>ac</strong>hed (Adhikari,<br />
2006). This is used as a strategy to avoid <strong>th</strong>e temperature shock load to microorganisms. Moreover,<br />
mixing mechanism was provided <strong>th</strong>rough le<strong>ac</strong>hate percolation wi<strong>th</strong> <strong>th</strong>e rate 500 mL/min for <strong>th</strong>ree<br />
hours daily to enhance biodegradability <strong>of</strong> <strong>th</strong>e substrates.<br />
3.1.1 Biogas Generation and Me<strong>th</strong>ane Efficiency<br />
Biogas production and me<strong>th</strong>ane concentration in <strong>th</strong>e biogas are primary indicators to evaluate <strong>th</strong>e<br />
performance efficiency <strong>of</strong> <strong>th</strong>e re<strong>ac</strong>tor. During <strong>th</strong>e first 8 days <strong>of</strong> operation, biogas production<br />
fluctuated, and from day 9 to 19, it increased sharply. Likewise, me<strong>th</strong>ane composition in biogas was<br />
increased from day 1 and re<strong>ac</strong>hed <strong>th</strong>e maximum value <strong>of</strong> 66% at day 19 (Figure 2). The highest<br />
volume <strong>of</strong> biogas production (520 L/day) was <strong>ac</strong>hieved at <strong>th</strong>e same day. It is clearly seen <strong>th</strong>at <strong>th</strong>e<br />
volume <strong>of</strong> biogas increased wi<strong>th</strong> <strong>th</strong>e operation time indicating <strong>th</strong>e balanced re<strong>ac</strong>tor performance.<br />
3<br />
Digester<br />
Wi<strong>th</strong>drawal Part
Daily Gas Production (L)<br />
600<br />
500<br />
400<br />
300<br />
200<br />
100<br />
0<br />
0 5 10 15 20 25 30<br />
Run time (Days)<br />
4<br />
Daily Gas Production (L)<br />
Biogas composition<br />
Figure 2. Daily cumulative biogas production and me<strong>th</strong>ane composition<br />
pH<br />
8.0<br />
7.5<br />
7.0<br />
6.5<br />
6.0<br />
5.5<br />
5.0<br />
3.1.2 Le<strong>ac</strong>hate Char<strong>ac</strong>teristics<br />
0 5 10 15 20 25 30<br />
Run time (Days)<br />
Figure 3. Pr<strong>of</strong>ile <strong>of</strong> pH and VFA<br />
pH VFA<br />
70<br />
60<br />
50<br />
40<br />
30<br />
20<br />
10<br />
0<br />
6,500<br />
5,500<br />
4,500<br />
3,500<br />
2,500<br />
1,500<br />
The pH value <strong>of</strong> 7 and <strong>th</strong>e concentration <strong>of</strong> me<strong>th</strong>ane (50%) were taken as indicator <strong>of</strong> <strong>ac</strong>tive<br />
me<strong>th</strong>ane phase. However, during <strong>th</strong>e first 2 weeks <strong>of</strong> operation, pH value was below 7. Thus, pH <strong>of</strong><br />
<strong>th</strong>e system was adjusted to 7 using commercial grade NaOH. From day 10, <strong>th</strong>e pH and alkalinity<br />
value relatively stabilized showing good performance <strong>of</strong> <strong>th</strong>e re<strong>ac</strong>tor.<br />
Figure 3 shows <strong>th</strong>e variation pr<strong>of</strong>ile <strong>of</strong> pH and Volatile Fatty Acid (VFA) concentration. The<br />
highest concentration <strong>of</strong> VFA was found on day 3 wi<strong>th</strong> <strong>th</strong>e lowest pH <strong>of</strong> 5.8. It can be concluded<br />
<strong>th</strong>at <strong>th</strong>ere was a high <strong>ac</strong>idification during <strong>th</strong>e first 3 days and <strong>th</strong>e system l<strong>ac</strong>ked sufficient buffering<br />
as indicated by lower alkalinity <strong>of</strong> <strong>th</strong>e system. Me<strong>th</strong>anogenesis is favored between pH 6.8 and 7.2<br />
(Chen et al. 1996). Thus, pH adjustment aided <strong>th</strong>e system in starting up <strong>th</strong>e process <strong>of</strong><br />
me<strong>th</strong>anogenesis. After <strong>th</strong>at, <strong>th</strong>e pH stabilized in <strong>th</strong>e range <strong>of</strong> 7-7.8. Interestingly, VFA concentration<br />
which re<strong>ac</strong>hed optimum at <strong>th</strong>e first few days gradually dropped, and <strong>th</strong>ereafter remained constant at<br />
1,000 mg/L, <strong>th</strong>is indicating a balanced condition.<br />
3.2 Phase 2: Continuous operation<br />
500<br />
Me<strong>th</strong>ane (%)<br />
VFA (mg/L)
In <strong>th</strong>is phase, continuous feeding was applied in draw-feed mode. Experiments were conducted<br />
in two different Mass Retention Times (MRTs) <strong>of</strong> 25 and 20 days wi<strong>th</strong> <strong>th</strong>e loading rate <strong>of</strong> 2 and 2.5<br />
kgVS/m 3 .day. Mass retention time is defined as <strong>th</strong>e <strong>ac</strong>tive re<strong>ac</strong>tor mass (kg VS) divided by <strong>th</strong>e total<br />
wet mass fed e<strong>ac</strong>h day (kg VS) (Kayhanian and Rich, 1995).<br />
3.2.1 Le<strong>ac</strong>hate Char<strong>ac</strong>teristic<br />
The pH and alkalinity are <strong>th</strong>e two indicators used to evaluate <strong>th</strong>e performance <strong>of</strong> <strong>th</strong>e re<strong>ac</strong>tor or<br />
process stability quickly. The pH and alkalinity significantly decreased from day 54 to 71 (Figure<br />
4). Therefore, <strong>th</strong>e re<strong>ac</strong>tor was kept unfed and observed until a balanced condition was re<strong>ac</strong>hed as<br />
indicated by <strong>th</strong>e pH and alkalinity <strong>of</strong> <strong>th</strong>e system. During <strong>th</strong>e unfed period, <strong>th</strong>e pH and alkalinity<br />
gradually increased. The maximum value <strong>of</strong> pH 7.8 was <strong>ac</strong>hieved at day 82. The buffering cap<strong>ac</strong>ity<br />
<strong>of</strong> <strong>th</strong>e system was recovered during <strong>th</strong>e unfed status due to <strong>th</strong>e gradual increased <strong>of</strong> alkalinity value<br />
up to 10,000 mg/L as CaCO3.<br />
pH<br />
8.0<br />
7.7<br />
7.4<br />
7.1<br />
6.8<br />
6.5<br />
Loading rate 1 (2 kgVS/m 3 .day)<br />
pH<br />
Alkalinity<br />
30 40 50 60 70 80 90 100<br />
Run time (Days)<br />
5<br />
No loading<br />
( unfed)<br />
Loading rate 2<br />
(2.5 kgVS/m 3 .day)<br />
Figure 4. pH and alkalinity (Phase 2)<br />
13,500<br />
12,500<br />
11,500<br />
10,500<br />
Figure 5 illustrates <strong>th</strong>e daily variation <strong>of</strong> Dissolved Organic Carbon (DOC) and VFA during<br />
different loading rates. These two parameters are <strong>th</strong>e indicators <strong>of</strong> <strong>th</strong>e hydrolysis rate <strong>of</strong> anaerobic<br />
process. In <strong>th</strong>e continuous loading operation, it was anticipated to get high DOC in le<strong>ac</strong>hate which<br />
represents <strong>th</strong>e hydrolyzed products from <strong>th</strong>e fresh waste. At <strong>th</strong>e same time, VFA, product <strong>of</strong><br />
<strong>ac</strong>idification/hydrolysis, influenced <strong>th</strong>e anaerobic digestion process. During <strong>th</strong>e first 20 days <strong>of</strong><br />
loading 1, DOC remained quite stable wi<strong>th</strong> slight fluctuation in <strong>th</strong>e range <strong>of</strong> 5000-7000 mg/L. VFA<br />
also showed <strong>th</strong>e same trends. Thus, VFA was not significantly <strong>ac</strong>cumulated to cause any unstable<br />
condition as its value was found in <strong>th</strong>e range <strong>of</strong> 1,000-3,000 mg/L. This value was found in<br />
agreement wi<strong>th</strong> Veeken et al (2000). Similarly, it was also confirmed <strong>th</strong>at <strong>th</strong>e complete inhibition <strong>of</strong><br />
anaerobic digestion was at VFA around 4,000-5,000 mg/L. However, when <strong>th</strong>e feeding and<br />
wi<strong>th</strong>drawing operation was continued at same rate from day 62 to day 71, bo<strong>th</strong> parameters showed<br />
increasing trends because <strong>th</strong>e VFA produced was not utilized by me<strong>th</strong>anogenesis, which lead to<br />
VFA <strong>ac</strong>cumulation. VFA <strong>ac</strong>cumulation in <strong>th</strong>e system was indicated by increased carbon dioxide<br />
content in biogas due to prevalence <strong>of</strong> <strong>th</strong>e <strong>ac</strong>idifying microorganisms over <strong>th</strong>e me<strong>th</strong>anogenic ones<br />
(Mata-Alvarez , 2003). Immediate precautionary <strong>ac</strong>tion was taken and re<strong>ac</strong>tor was unfed which<br />
caused decreasing trends <strong>of</strong> VFA and DOC. However, when feeding was resumed at day 83 wi<strong>th</strong><br />
<strong>th</strong>e loading rate <strong>of</strong> 2.5 kg VS/m 3 .day, VFA and DOC again increased.<br />
9,500<br />
8,500<br />
7,500<br />
Alkalinity (mg/L)
DOC (mg/L)<br />
12,000<br />
11,000<br />
10,000<br />
9,000<br />
8,000<br />
7,000<br />
6,000<br />
5,000<br />
Loading rate 1 (2 kgVS/m 3 .day)<br />
DOC<br />
VFA<br />
30 40 50 60 70 80 90 100<br />
Run time (Days)<br />
3.2.2 Biogas Production and Composition<br />
No loading (<br />
unfed)<br />
6<br />
Loading rate 2<br />
(2.5 kgVS/m 3 .day)<br />
Figure 5. Variation <strong>of</strong> DOC and VFA (Phase 2)<br />
The experiment results showed <strong>th</strong>e fluctuation <strong>of</strong> daily biogas generated during bo<strong>th</strong> feeding<br />
rates as graphically presented in Figure 6. In <strong>th</strong>e unfed condition, <strong>th</strong>e average production <strong>of</strong> 170<br />
L/day was observed from day 72 to day 82. However, cumulative biogas generation was steady.<br />
Me<strong>th</strong>ane concentration in biogas for bo<strong>th</strong> loadings, except at first 3 days <strong>of</strong> loading and unfed<br />
condition was below 50% (Figure 7). It was found <strong>th</strong>at <strong>th</strong>ere was a chance <strong>of</strong> air intrusion during<br />
feeding and wi<strong>th</strong>drawal <strong>of</strong> waste due to some technical problem in <strong>th</strong>e re<strong>ac</strong>tor configuration. As<br />
oxygen is toxic to <strong>th</strong>e me<strong>th</strong>anogens, lower me<strong>th</strong>ane content in <strong>th</strong>e biogas is attributed to <strong>th</strong>e<br />
technical problem, not <strong>th</strong>e process.<br />
Biogas production (L)<br />
500<br />
400<br />
300<br />
200<br />
100<br />
0<br />
Loading rate 1 (2 kgVS/m 3 .day)<br />
No loading<br />
( unfed)<br />
30 40 50 60 70 80 90 100<br />
Run time (days)<br />
Loading rate 2<br />
(2.5 kgVS/m 3 .day)<br />
Daily biogas production Cumulative biogas production<br />
Figure 6. Biogas production (Phase 2)<br />
26,500<br />
24,500<br />
22,500<br />
20,500<br />
18,500<br />
16,500<br />
14,500<br />
12,500<br />
10,500<br />
8,500<br />
8,000<br />
7,000<br />
6,000<br />
5,000<br />
4,000<br />
3,000<br />
2,000<br />
1,000<br />
Cumulative biogas<br />
production (L)<br />
VFA (mg/L)
Bigas Composition (%)<br />
90<br />
80<br />
70<br />
60<br />
50<br />
40<br />
30<br />
20<br />
10<br />
% CH4<br />
% CO2<br />
30 40 50 60 70 80 90 100<br />
Run time (Days)<br />
3.3 Overall Process Assessment<br />
Loading rate 1 (2 kgVS/m 3 .day)<br />
7<br />
No loading<br />
( unfed)<br />
Figure 7. Biogas composition (Phase 2)<br />
Loading rate 2<br />
(2.5 kgVS/m 3 .day)<br />
The effect <strong>of</strong> specific biogas and me<strong>th</strong>ane production, VS reduction were taken into <strong>ac</strong>count to<br />
assess <strong>th</strong>e re<strong>ac</strong>tor performance and efficiency <strong>of</strong> e<strong>ac</strong>h loading rate. Specific biogas productions for<br />
<strong>th</strong>e 2 loading rates are graphically illustrated in Figure 8. The highest specific biogas production on<br />
loading rate 1 was 401 L/kgVS removed. The specific me<strong>th</strong>ane yields obtained were 140.35 and 62.55<br />
L CH4/kg VS for loading rate 1 and 2, respectively. This value corresponds to 47.57% and 21.20%<br />
process efficiency calculated based on <strong>th</strong>e laboratory BMP assay (295 L CH4/kg VS at STP),<br />
respectively.<br />
VS degradation <strong>of</strong> 51% was <strong>ac</strong>hieved when operating under loading 1 (2.5 kg VS/m 3 .day).<br />
When loading rate was increased, only 43.2% VS reductions were obtained as illustrated in Figure<br />
9. Comparably, VS reduction was lower <strong>th</strong>an <strong>th</strong>e results obtained by Castillo et al. (2006) who<br />
reported VS reduction <strong>of</strong> 77.1% and 74.1% wi<strong>th</strong> <strong>th</strong>e digestion time <strong>of</strong> 25 and 21 days respectively.<br />
By far different results in <strong>th</strong>is study were due to <strong>th</strong>e problem mentioned earlier in <strong>th</strong>is section<br />
However, <strong>th</strong>e result obtained in terms <strong>of</strong> VS removal efficiency still in line wi<strong>th</strong> Castillo et al.<br />
(2006).<br />
Specific biogas production<br />
(L/kgVSremoved)<br />
450<br />
400<br />
350<br />
300<br />
250<br />
200<br />
150<br />
100<br />
50<br />
0<br />
401<br />
278<br />
Loading rate 1 Loading rate 2<br />
VS removal (%)<br />
60<br />
50<br />
40<br />
30<br />
20<br />
10<br />
0<br />
51<br />
43.22<br />
Loading rate 1 Loading rate 2<br />
Figure 8. Specific biogas production Figure 9. VS degradation<br />
4. CONCLUSIONS<br />
This study reveals <strong>th</strong>at a direct and effective start-up <strong>of</strong> <strong>th</strong>ermophilic anaerobic digestion can be<br />
done successfully wi<strong>th</strong>out inoculum <strong>ac</strong>climatization. During <strong>th</strong>e continuous operation, when <strong>th</strong>e
loading rate was increased, <strong>th</strong>e biogas production decreased. Biogas production rate dropped from<br />
140 L/kgVS to 62.55 CH4 L/kgVS when loading was increased from 2 kgVS/ m 3 .day to 2.5 kg VS/<br />
m 3 .day. Volatile solid degradation <strong>of</strong> 51% was obtained during loading 1 compared to 43.2% in<br />
loading 2. Thus, designing a simple single stage re<strong>ac</strong>tor in dry-continuous anaerobic digestion<br />
system is a challenge for fur<strong>th</strong>er investigation.<br />
ACKNOWLEDGEMENT<br />
This study is a part <strong>of</strong> <strong>th</strong>e Asian Regional Research Program on Environmental Technology<br />
(ARRPET). Au<strong>th</strong>ors wish to convey <strong>th</strong>eir gratitude to <strong>th</strong>e Swedish International Cooperation<br />
Agency (Sida) for financial support <strong>of</strong> <strong>th</strong>is research.<br />
REFERENCES:<br />
Adhikari, R. Sequential batch and continues anaerobic digestion <strong>of</strong> municipal solid waste in pilot<br />
scale digesters. (Master <strong>th</strong>esis, No. EV-06-33, Asian Institute <strong>of</strong> Technology (2006).<br />
ASTM. Annual Book <strong>of</strong> ASTM Standards. Volume 11.04. Easton, MD, U.S.A. (1993) ISBN: 0-<br />
8031-1963-1.<br />
APHA, AWWA, and WEF. Standard me<strong>th</strong>od for <strong>th</strong>e examination <strong>of</strong> water and wastewater. 19 <strong>th</strong><br />
edition. Washington, D.C., USA. (1998)<br />
Castillo, M.E.F., Cristancho, D.E., and Arellano, V.A. Study <strong>th</strong>e operational condition for<br />
anaerobic digestion <strong>of</strong> urban solid wastes. <strong>Waste</strong> Management, 26, 546-556 (2006).<br />
Chen, T.H., and Hashimoto, A.G. Effects <strong>of</strong> pH and substrate: Inoculum ratio on batch me<strong>th</strong>ane<br />
fermentation. Bioresource Technology, 56, 179-186 (1996).<br />
Kayhanian, M., and Rich, D. Pilot-Scale High <strong>Solid</strong>s Thermophilic <strong>Anaerobic</strong> <strong>Digestion</strong> <strong>of</strong><br />
<strong>Municipal</strong> <strong>Solid</strong> <strong>Waste</strong> wi<strong>th</strong> an Emphasis on Nutrient Requirement. Biomass and Bioenergy.<br />
8 (6), 433-444 (1995).<br />
Mata-Alvarez, J. Biome<strong>th</strong>anization <strong>of</strong> <strong>th</strong>e Organic Fr<strong>ac</strong>tion <strong>of</strong> <strong>Municipal</strong> <strong>Solid</strong> <strong>Waste</strong>. IWA<br />
Publshing (2003). ISBN: 1-900222-14-0.<br />
Torres-Castillo, R., Llabrés-Luengo, P., and Mata-Avarez, J. Temperature effect on anaerobic<br />
digestion <strong>of</strong> bedding straw in a one phase system at different inoculum concentration.<br />
Agriculture, Ecology and Environment, 54, 55-66 (1995).<br />
Veeken, A., Kalyuzhnyi, S., Scharff, H., and Hamelers, B. Effect <strong>of</strong> pH and VFA on hydrolysis <strong>of</strong><br />
organic solid waste. Journal <strong>of</strong> Environmental Engineering, 126, (12), 1076-1081 (2000).<br />
8
<strong>Anaerobic</strong> <strong>Digestion</strong> <strong>of</strong> MSW in Thermophilic Continuous Operation<br />
<strong>Anaerobic</strong> <strong>Digestion</strong> <strong>of</strong> <strong>Municipal</strong> <strong>Solid</strong> <strong>Waste</strong><br />
in Thermophilic Continuous Operation<br />
C. Eliyan, R. Adhikari, J. P. Juanga & C. Visvana<strong>th</strong>an<br />
Environmental Engineering & Management Program<br />
Asian Institute <strong>of</strong> Technology,<br />
Thailand<br />
International Conference on Sustainable <strong>Solid</strong> <strong>Waste</strong> Management<br />
5-7 September, Chennai, India<br />
1
<strong>Anaerobic</strong> <strong>Digestion</strong> <strong>of</strong> MSW in Thermophilic Continuous Operation<br />
Introduction<br />
Landfill & associate problems<br />
Indispensable component <strong>of</strong> integrated<br />
solid waste management<br />
Cheap, simple but unsustainable in long<br />
term<br />
Environmental concerns; air, surf<strong>ac</strong>e<br />
/ground water problems<br />
Mass/volume reduction <strong>of</strong> MSW better<br />
utilization <strong>of</strong> sp<strong>ac</strong>e<br />
Asian MSW, high organic fr<strong>ac</strong>tion (>50%)<br />
& high moisture content<br />
Aerobic and anaerobic biological<br />
processes: two viable bio-technologies<br />
Infiltration ?<br />
Emissions<br />
2
<strong>Anaerobic</strong> <strong>Digestion</strong> <strong>of</strong> MSW in Thermophilic Continuous Operation<br />
Aerobic Versus <strong>Anaerobic</strong><br />
Aerobic Composting<br />
Odor problem, Less volume reduction<br />
net energy user<br />
<strong>Anaerobic</strong> <strong>Digestion</strong> Modes<br />
Low <strong>Solid</strong>s (
<strong>Anaerobic</strong> <strong>Digestion</strong> <strong>of</strong> MSW in Thermophilic Continuous Operation<br />
pH adjustment<br />
Materials & Me<strong>th</strong>ods<br />
Pilot Scale Experiment Laboratory Scale<br />
Horizontal Continuous<br />
<strong>Anaerobic</strong> <strong>Digestion</strong><br />
• Re<strong>ac</strong>tor starts up (initial feeding<br />
to 80% <strong>of</strong> re<strong>ac</strong>tor volume)<br />
• Start at mesophilic condition<br />
(increase 2 o C/day to <strong>th</strong>ermophilic)<br />
Variation <strong>of</strong> loading rates<br />
Digested <strong>Waste</strong><br />
Biochemical Me<strong>th</strong>ane<br />
Potential (BMP) Test<br />
Sampling &<br />
Analysis<br />
4
<strong>Anaerobic</strong> <strong>Digestion</strong> <strong>of</strong> MSW in Thermophilic Continuous Operation<br />
Loading rate<br />
(kgVS/m3 .d)<br />
Pilot Scale Experiments<br />
Phase 1: Re<strong>ac</strong>tor<br />
Start- up<br />
• Feeding to<br />
re<strong>ac</strong>h 80% <strong>of</strong><br />
re<strong>ac</strong>tor volume<br />
• Le<strong>ac</strong>hate<br />
percolation<br />
• Temperature<br />
pH Adjustment<br />
Materials & Me<strong>th</strong>ods<br />
Loading 1<br />
Retention time<br />
25 days<br />
Loading rate<br />
2 kgVS/m 3 .d<br />
Phase 2: Continuous feeding<br />
1 2 3<br />
Time (mon<strong>th</strong>s)<br />
Unfed Loading 2<br />
Retention<br />
time 20<br />
days<br />
Loading rate<br />
2.5 kgVS/m 3 .d<br />
4<br />
5
<strong>Anaerobic</strong> <strong>Digestion</strong> <strong>of</strong> MSW in Thermophilic Continuous Operation<br />
Experimental Set up<br />
Feeding Part<br />
Temperature<br />
Controller<br />
Materials & Me<strong>th</strong>ods<br />
Hot Water<br />
Tank Drum Type Gas<br />
Meter<br />
Gas Sampling Point<br />
Digester<br />
Wi<strong>th</strong>drawal Part<br />
Le<strong>ac</strong>hate Tank &<br />
Rotation Paddle<br />
6
<strong>Anaerobic</strong> <strong>Digestion</strong> <strong>of</strong> MSW in Thermophilic Continuous Operation<br />
Temperature<br />
controller<br />
Feedstock<br />
inlet<br />
Total volume:<br />
~ 49.2 L<br />
Hot water tank<br />
Materials & Me<strong>th</strong>ods<br />
Le<strong>ac</strong>hate percolation<br />
Experimental Set up<br />
U tube for gas<br />
sampling<br />
U Wet gas meter<br />
Thermocouple<br />
Rotating<br />
paddle<br />
Digested<br />
waste &<br />
Le<strong>ac</strong>hate<br />
U<br />
outlet<br />
Le<strong>ac</strong>hate<br />
tank<br />
7
<strong>Anaerobic</strong> <strong>Digestion</strong> <strong>of</strong> MSW in Thermophilic Continuous Operation<br />
Feedstock Preparation<br />
Dumpsite<br />
Materials & Me<strong>th</strong>ods<br />
<strong>Waste</strong><br />
Separation<br />
Shredding (Size<br />
Reduction)<br />
Weighing<br />
Mixing<br />
Re<strong>ac</strong>tor Loading<br />
8
<strong>Anaerobic</strong> <strong>Digestion</strong> <strong>of</strong> MSW in Thermophilic Continuous Operation<br />
Feedstock Char<strong>ac</strong>teristics<br />
Parameters Value<br />
MC (%WW) 88-91<br />
TS (%WW)<br />
VS (%TS)<br />
N (% D.M)<br />
P (% D.M)<br />
K (% D.M)<br />
C (%WW)<br />
C/N<br />
Results & Discussion<br />
9-12<br />
82.3-83.6<br />
3.04<br />
0.22<br />
0.22<br />
45.73<br />
15.04<br />
Heavy metals Conc.<br />
(mg/ kg D.M)<br />
Cadmium (Cd) 0.25<br />
Lead (Pb) 0<br />
Zinc (Zn) 72.24<br />
Copper (Cu) 15.29<br />
Chromium (Cr) 7.36<br />
Nickel (Ni) 4.10<br />
Mercury (Hg) 0.036<br />
Manganese (Mn) 88.10<br />
9
<strong>Anaerobic</strong> <strong>Digestion</strong> <strong>of</strong> MSW in Thermophilic Continuous Operation<br />
Daily Gas<br />
Production (L)<br />
Biogas Production: Start-up<br />
600<br />
500<br />
400<br />
300<br />
200<br />
100<br />
0<br />
pH adjustment<br />
Results & Discussion<br />
0 5 10 15 20 25 30<br />
Run time (Days)<br />
% Me<strong>th</strong>ane<br />
0<br />
70<br />
60<br />
50<br />
40<br />
30<br />
20<br />
10<br />
0<br />
10,000<br />
8,000<br />
6,000<br />
4,000<br />
2,000<br />
Daily Gas Production (L) Cummulative Gas Production (L)<br />
Cummulative Gas<br />
Production (L)<br />
Me<strong>th</strong>ane concentration<br />
increasing& re<strong>ac</strong>hed<br />
above 60%<br />
0 5 10 15 20 25 30<br />
Run Time (Days)<br />
10
<strong>Anaerobic</strong> <strong>Digestion</strong> <strong>of</strong> MSW in Thermophilic Continuous Operation<br />
pH<br />
8.0<br />
7.5<br />
7.0<br />
6.5<br />
6.0<br />
5.5<br />
5.0<br />
Results & Discussion<br />
Le<strong>ac</strong>hate Char<strong>ac</strong>teristics: Start-up<br />
0 5 10 15 20 25 30<br />
Run time (Days)<br />
pH & alkalinity increasing stable condition<br />
<strong>of</strong> <strong>th</strong>e system<br />
pH<br />
VFA<br />
pH<br />
8.0<br />
7.5<br />
7.0<br />
6.5<br />
6.0<br />
5.5<br />
5.0<br />
6,500<br />
5,500<br />
4,500<br />
3,500<br />
2,500<br />
1,500<br />
500<br />
VFA (mg/L)<br />
pH<br />
Alkalinity<br />
0 5 10 15 20 25 30<br />
Run time (Days)<br />
14,000<br />
13,000<br />
12,000<br />
11,000<br />
10,000<br />
9,000<br />
8,000<br />
7,000<br />
6,000<br />
5,000<br />
Alkalinity (mg/L)<br />
11
<strong>Anaerobic</strong> <strong>Digestion</strong> <strong>of</strong> MSW in Thermophilic Continuous Operation<br />
Biogas Composition: Continuous Operation<br />
Biogas composition (%)<br />
90<br />
80<br />
70<br />
60<br />
50<br />
40<br />
30<br />
20<br />
Results & Discussion<br />
30-40%CH 4<br />
Loading 1<br />
%CH 4 increasing<br />
Unfed<br />
10<br />
30 40 50 60 70 80 90 100<br />
Run time (Days)<br />
Me<strong>th</strong>ane Carbon dioxide<br />
Loading 2<br />
%CH 4 dropping<br />
12
<strong>Anaerobic</strong> <strong>Digestion</strong> <strong>of</strong> MSW in Thermophilic Continuous Operation<br />
Le<strong>ac</strong>hate Char<strong>ac</strong>teristics: Continuous operation<br />
DOC (mg/L)<br />
12,000<br />
11,000<br />
10,000<br />
9,000<br />
8,000<br />
7,000<br />
6,000<br />
Loading 1<br />
Parallel increase <strong>of</strong> DOC & VFA<br />
<strong>of</strong> <strong>th</strong>e system unstable condition<br />
Results & Discussion<br />
Unfed<br />
Loading 2<br />
DOC VFA<br />
pH<br />
7.7<br />
7.4<br />
7.1<br />
6.8<br />
6.5<br />
8,000<br />
7,000<br />
6,000<br />
5,000<br />
4,000<br />
3,000<br />
2,000<br />
5,000<br />
1,000<br />
30 40 50 60<br />
Run time (Days)<br />
70 80 90 100<br />
8.0<br />
Loading 1<br />
VFA (mg/L)<br />
Gradual increase <strong>of</strong><br />
pH & alkalinity, in Unfed condition<br />
Unfed<br />
30 40 50 60 70 80 90 100<br />
Run time (Days)<br />
pH Alkalinity<br />
Loading 2<br />
13,500<br />
12,500<br />
11,500<br />
10,500<br />
9,500<br />
8,500<br />
7,500<br />
Alkalinity (mg/L)<br />
13
<strong>Anaerobic</strong> <strong>Digestion</strong> <strong>of</strong> MSW in Thermophilic Continuous Operation<br />
VS Removal<br />
Results & Discussion<br />
14
<strong>Anaerobic</strong> <strong>Digestion</strong> <strong>of</strong> MSW in Thermophilic Continuous Operation<br />
Digested Quality<br />
Heavy metals<br />
below <strong>th</strong>e<br />
standards<br />
Dutch standard<br />
(Clean compost)<br />
WHO standards<br />
(Proposed)<br />
Results & Discussion<br />
Heavy metals (mg/kg DM)<br />
Cd Cr Cu Pb Ni Zn Hg<br />
1 50 60 100 20 200 0.3<br />
3 50 80 150 50 300 -<br />
Digestate 0.6 13.8 55 0 12 106 0.04<br />
Nutrient Values (NPK) were also higher <strong>th</strong>an Thai Compost Standard<br />
15
<strong>Anaerobic</strong> <strong>Digestion</strong> <strong>of</strong> MSW in Thermophilic Continuous Operation<br />
Conclusions<br />
Effective starting up <strong>th</strong>e process wi<strong>th</strong>out inoculum <strong>ac</strong>climatization<br />
Loading rate 1 gave a higher biogas production compared to<br />
loading rate 2<br />
Volatile solid degradation <strong>of</strong> 51% was observed in loading 1<br />
compared to 43.22% in loading 2.<br />
End products are stable and has a potential to be used as soil<br />
conditioner. Calorific value <strong>of</strong> digested was 11.16 MJ/kg: potential to<br />
be used as RDF<br />
Based on <strong>th</strong>e investigation and observation, <strong>th</strong>e drop in CH 4<br />
concentration could be linked to <strong>th</strong>e technical design problem<br />
ra<strong>th</strong>er <strong>th</strong>an <strong>th</strong>e process.<br />
It is concluded <strong>th</strong>at such a simple system operating in <strong>th</strong>e continuous<br />
draw-feed mode has a potential to be incorporated in <strong>th</strong>e<br />
decentralized organic waste management system. However, special<br />
attention should be given to design <strong>of</strong> inlet and egress. The research<br />
is in progress to overcome <strong>th</strong>e problem.<br />
16
<strong>Anaerobic</strong> <strong>Digestion</strong> <strong>of</strong> MSW in Thermophilic Continuous Operation<br />
17


