Summary
Summary
Summary

You also want an ePaper? Increase the reach of your titles
YUMPU automatically turns print PDFs into web optimized ePapers that Google loves.
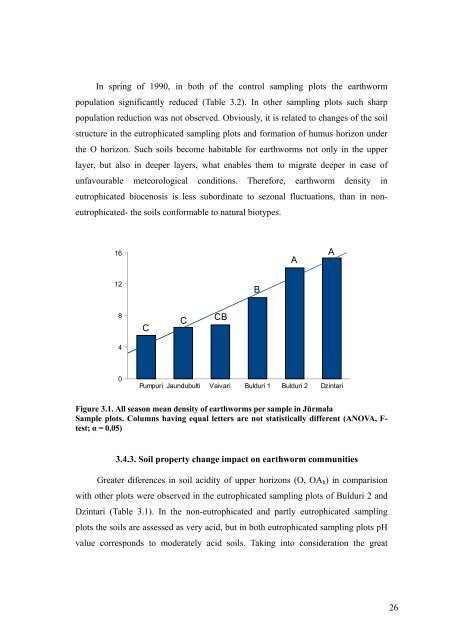
In spring of 1990, in both of the control sampling plots the earthworm<br />
population significantly reduced (Table 3.2). In other sampling plots such sharp<br />
population reduction was not observed. Obviously, it is related to changes of the soil<br />
structure in the eutrophicated sampling plots and formation of humus horizon under<br />
the O horizon. Such soils become habitable for earthworms not only in the upper<br />
layer, but also in deeper layers, what enables them to migrate deeper in case of<br />
unfavourable meteorological conditions. Therefore, earthworm density in<br />
eutrophicated biocenosis is less subordinate to sezonal fluctuations, than in noneutrophicated-<br />
the soils conformable to natural biotypes.<br />
16<br />
12<br />
8<br />
4<br />
0<br />
C<br />
C<br />
CB<br />
Pumpuri Jaundubulti Vaivari Bulduri 1 Bulduri 2 Dzintari<br />
Figure 3.1. All season mean density of earthworms per sample in Jūrmala<br />
Sample plots. Columns having equal letters are not statistically different (ANOVA, Ftest;<br />
α = 0,05)<br />
3.4.3. Soil property change impact on earthworm communities<br />
Greater diferences in soil acidity of upper horizons (O, OAh) in comparision<br />
with other plots were observed in the eutrophicated sampling plots of Bulduri 2 and<br />
Dzintari (Table 3.1). In the non-eutrophicated and partly eutrophicated sampling<br />
plots the soils are assessed as very acid, but in both eutrophicated sampling plots pH<br />
value corresponds to moderately acid soils. Taking into consideration the great<br />
B<br />
A<br />
A<br />
26