Summary
Summary
Summary

You also want an ePaper? Increase the reach of your titles
YUMPU automatically turns print PDFs into web optimized ePapers that Google loves.
matters happens more intense than in the furthest sampling plots, where just the<br />
horizon O of organic matter was found (Table 3.5) (Laiviņš et al., 1993, Vaivara,<br />
2006).<br />
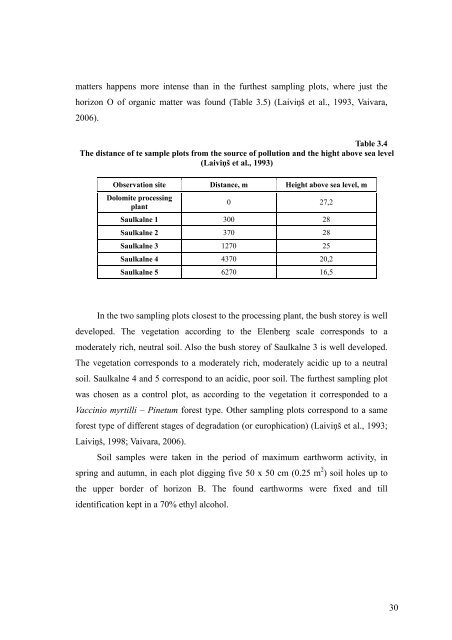
Table 3.4<br />
The distance of te sample plots from the source of pollution and the hight above sea level<br />
(Laiviņš et al., 1993)<br />
Observation site Distance, m Height above sea level, m<br />
Dolomite processing<br />
plant<br />
0 27,2<br />
Saulkalne 1 300 28<br />
Saulkalne 2 370 28<br />
Saulkalne 3 1270 25<br />
Saulkalne 4 4370 20,2<br />
Saulkalne 5 6270 16,5<br />
In the two sampling plots closest to the processing plant, the bush storey is well<br />
developed. The vegetation according to the Elenberg scale corresponds to a<br />
moderately rich, neutral soil. Also the bush storey of Saulkalne 3 is well developed.<br />
The vegetation corresponds to a moderately rich, moderately acidic up to a neutral<br />
soil. Saulkalne 4 and 5 correspond to an acidic, poor soil. The furthest sampling plot<br />
was chosen as a control plot, as according to the vegetation it corresponded to a<br />
Vaccinio myrtilli – Pinetum forest type. Other sampling plots correspond to a same<br />
forest type of different stages of degradation (or europhication) (Laiviņš et al., 1993;<br />
Laiviņš, 1998; Vaivara, 2006).<br />
Soil samples were taken in the period of maximum earthworm activity, in<br />
spring and autumn, in each plot digging five 50 x 50 cm (0.25 m 2 ) soil holes up to<br />
the upper border of horizon B. The found earthworms were fixed and till<br />
identification kept in a 70% ethyl alcohol.<br />
30