The Global Cheese Market Report 2000-‐2015 - Moproweb
The Global Cheese Market Report 2000-‐2015 - Moproweb
The Global Cheese Market Report 2000-‐2015 - Moproweb

Create successful ePaper yourself
Turn your PDF publications into a flip-book with our unique Google optimized e-Paper software.
Between <strong>2000</strong> and 2007, however, Croatia's economic fortunes began to improve slowly, with<br />
moderate but steady GDP growth between 4% and 6% led by a rebound in tourism and credit-‐<br />
driven consumer spending. Inflation over the same period has remained tame and the currency,<br />
the kuna, stable. Nevertheless, difficult problems still remain, including a stubbornly high<br />
unemployment rate, a growing trade deficit and uneven regional development.<br />
<strong>The</strong> state retains a large role in the economy, as privatization efforts often meet stiff public and<br />
political resistance. While macroeconomic stabilization has largely been achieved, structural<br />
reforms lag because of deep resistance on the part of the public and lack of strong support from<br />
politicians. <strong>The</strong> EU accession process should accelerate fiscal and structural reform.<br />
While long term growth prospects for the economy remain strong, Croatia will face significant<br />
pressure as a result of the global financial crisis. Croatia's high foreign debt, anemic export sector,<br />
strained state budget, and over-‐reliance on tourism revenue will result in higher risk to economic<br />
stability over the medium term.<br />
2. <strong>The</strong> dairy sector in general<br />
<strong>The</strong> dairy industry is one of the most important parts of Croatian agriculture with 9% of the total<br />
agricultural production value. <strong>The</strong>re are more than 20,000 dairy farms in Croatia and they are very<br />
small, however the number of dairy farmers has been halved from <strong>2000</strong> to 2007. In the same<br />
period the yield per cow has increased from 2,300kg to 3,555kg.<br />
<strong>The</strong> overall milk production in Croatia declined in the last decade but the deliveries to dairies have<br />
increased significantly with 75% illustrating the improvements in the dairy sector.<br />
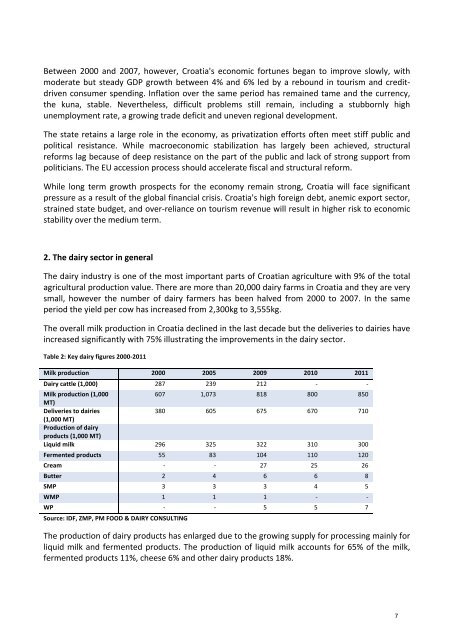
Table 2: Key dairy figures <strong>2000</strong>-‐2011<br />
Milk production <strong>2000</strong> 2005 2009 2010 2011<br />
Dairy cattle (1,000) 287 239 212 -‐ -‐<br />
Milk production (1,000<br />
MT)<br />
607 1,073 818 800 850<br />
Deliveries to dairies<br />
(1,000 MT)<br />
Production of dairy<br />
products (1,000 MT)<br />
380 605 675 670 710<br />
Liquid milk 296 325 322 310 300<br />
Fermented products 55 83 104 110 120<br />
Cream -‐ -‐ 27 25 26<br />
Butter 2 4 6 6 8<br />
SMP 3 3 3 4 5<br />
WMP 1 1 1 -‐ -‐<br />
WP -‐ -‐ 5 5 7<br />
Source: IDF, ZMP, PM FOOD & DAIRY CONSULTING<br />
<strong>The</strong> production of dairy products has enlarged due to the growing supply for processing mainly for<br />
liquid milk and fermented products. <strong>The</strong> production of liquid milk accounts for 65% of the milk,<br />
fermented products 11%, cheese 6% and other dairy products 18%.<br />
7