
Create successful ePaper yourself
Turn your PDF publications into a flip-book with our unique Google optimized e-Paper software.
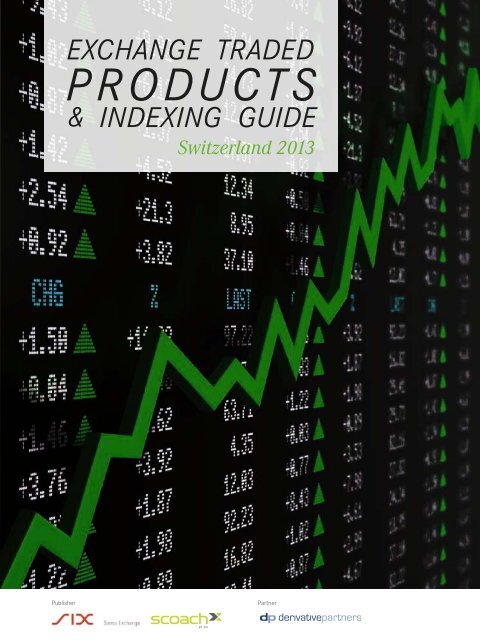
ExchangE tradEd<br />
ProductS<br />
& IndExIng guIdE<br />
<strong>Switzerland</strong> <strong>2013</strong><br />
Publisher Partner
EdITorIal<br />
daniel Manser<br />
Editor-in-chief<br />
02 ExchangE TradEd ProducTs & IndExIng guIdE <strong>Switzerland</strong> <strong>2013</strong><br />
Actively using<br />
passive strategies<br />
You are holding the very first "<strong>Exchange</strong> <strong>Traded</strong> <strong>Products</strong><br />
& <strong>Indexing</strong> <strong>Guide</strong>" dedicated to the Swiss market. With this<br />
publication, our goal is to provide investors with a practical<br />
and comprehensive tool for easily and quickly finding the<br />
right product for their relevant investment goals.<br />
In 40 product tables, we have brought together the exchange-listed<br />
products for you, divided up by asset classes<br />
and sector strategies, using which, you can best find the<br />
right asset segment. What is special here: The product wrapper<br />
is not the focus. It is not the packaging that is important,<br />
but the content. Whether it is an ETF, tracker or ETC, the one-year performance of the<br />
product in the relevant asset segment is what is decisive. The qualitative assessment<br />
of the product, expressed by the "dp-Rating", is an additional help in decision-making.<br />
The number of stars efficiently helps investors choose products. The rating was created<br />
by our editorial team consisting of investment pros and former fund managers.<br />
We invite you to actively use the <strong>Guide</strong> as a tool for selecting passive financial products.<br />
We hope you enjoy reading – and have successful investments. <br />
Martin raab<br />
Managing Editor
Top quality.<br />
Low price.<br />
UBS ETFs.<br />
Investments have been our métier since 1862.<br />
UBS Global Asset Management has reduced the prices for<br />
all ETFs in share class A to a record low.<br />
This step underscores the high demands UBS places on its<br />
investment solutions, especially in terms of high-quality<br />
index replication and a high level of transparency<br />
concerning portfolio structure and costs.<br />
Effective immediately, all UBS ETF investors can benefit<br />
from these new lower prices – including you.<br />
We will not rest<br />
ETFs how you want them.<br />
Read more at<br />
www.ubs.com/etf<br />
ab<br />
For marketing and information purposes by UBS. This document is published by UBS AG, a company registered under Swiss law. It was written without reference to any specific or future<br />
investment objective, financial or tax situation or requirement on the part of a particular individual or group. This document is intended for information purposes only and constitutes neither an offer<br />
nor a solicitation to conclude a contract of any kind or to buy or sell securities of any kind or related financial instruments. The products or securities described herein may not be eligible for sale in all<br />
jurisdictions or to certain categories of investors. The information and opinions contained in this document have been compiled or arrived at based upon information obtained from sources believed<br />
to be reliable and in good faith, but are not guaranteed as being accurate, nor are they a complete statement or summary of the securities, markets or developments referred to in the document.<br />
The details and opinions contained in this document are provided by UBS without any guarantee or warranty and are for the recipient’s personal use and information purposes only. Past performance<br />
of investments (whether simulated or actual) is no guarantee of future trends. All such information and opinions are subject to change without notice. UBS AG and/or other members of the UBS<br />
Group may have a position in and may make purchases and/or sales of any of the securities or other financial instruments mentioned in this document. Source for all data and charts (if not indicated<br />
otherwise): UBS Global Asset Management.<br />
© UBS <strong>2013</strong>. The key symbol and UBS are among the registered and unregistered trademarks of UBS. All rights reserved. E10
IMPrInT | conTEnT<br />
ExchangE TradEd ProducTs & IndExIng<br />
guIdE <strong>Switzerland</strong> <strong>2013</strong><br />
IsBn 978-3-9524216-2-8<br />
ProduCtion<br />
derivative Partners Media ag<br />
splügenstrasse 10 | 8002 Zurich<br />
Telefon +41 (0)43 305 05 30<br />
www.derivativepartners.com<br />
Editor-in-ChiEf<br />
daniel Manser<br />
Managing Editor<br />
Martin raab<br />
authorS<br />
dieter haas, daniel Manser, hans-Jörg Morath<br />
and Martin raab<br />
MarKEting & adVErtiSing<br />
nicole leimgruber<br />
dESign and Layout<br />
Veronika Kinzel<br />
Print<br />
Fo-Fotorotar<br />
gewerbestrasse 18 | 8132 Egg<br />
www.fo-fotorotar.ch<br />
tranSLation<br />
sabine hobbs and John Bunch<br />
Edition<br />
The guide is published annually in hard copy and digital, reaching<br />
more than 250'000 professional investors. This publication<br />
is distributed as special supplement together with "Bilan"<br />
(sept. 18, <strong>2013</strong>) and "Finanz und Wirtschaft" (sept. 21, <strong>2013</strong>).<br />
LanguagES<br />
The guide is published in german, French and English.<br />
diSCLaiMEr<br />
This publication provides information for professional investors<br />
only. It is not meant to be a recommendation to buy or to sell<br />
securities nor an offer to buy or sell securities. The publishers<br />
are not registered investment advisors and do not attempt or<br />
intend to influence the purchase or sale of any security. We do<br />
not guarantee the accuracy or completeness of the information<br />
displayed in any section of this publication. Investors act on<br />
their own risk. Past performance is not a guarantee for future<br />
performance.<br />
04 ExchangE TradEd ProducTs & IndExIng guIdE <strong>Switzerland</strong> <strong>2013</strong><br />
oPEning rEMarKS 05<br />
foCuS<br />
a (r)evolution with three letters 07<br />
shedding light on product concepts 14<br />
success factors in trading 21<br />
hard facts about soft costs<br />
<strong>Indexing</strong>, from an investor's point of view:<br />
25<br />
knowing what is important 31<br />
adVErtoriaL<br />
The investor in the forefront 17<br />
The solid bridge 34<br />
intErViEw<br />
Matthias Müller, head cosI Product Management<br />
at sIx swiss <strong>Exchange</strong> 19<br />
christian reuss, cEo scoach, Executive Board<br />
Member of sIx swiss <strong>Exchange</strong> 29<br />
alain Picard, head of Product Management,<br />
sIx swiss <strong>Exchange</strong> 35<br />
iSSuEr-Portrait<br />
commerzbank 37<br />
ETF securities 38<br />
lyxor 39<br />
uBs 40<br />
ProduCt tabLES 41<br />
ProduCt-Portrait<br />
uBs rada Index 46<br />
lyxor ETF Euro sToxx 50 46<br />
dividend aristocrats ETFs 49<br />
Invesco Powershares EQQQ Fund 49<br />
db x-trackers Emerging Markets liquid Eurobond ETF 56<br />
db x-trackers MscI Japan Index ETFs 56<br />
source Morningstar us Energy Infrastructure MlP ETF 69<br />
chF daily currency-hedged commodity securities 69<br />
gLoSSary 79<br />
wEbLinKS 86
oPEnIng rEMarKs<br />
05 ExchangE TradEd ProducTs & IndExIng guIdE <strong>Switzerland</strong> <strong>2013</strong><br />
Trust sets the<br />
stage for success<br />
Dear readers,<br />
Trust is very important, particularly when investing. If trust<br />
is absent, providers of investment products and asset managers<br />
will lack a foundation for doing business. Unfortunately,<br />
the financial industry squandered a lot of trust during the<br />
financial crisis. At the same time, the crisis was a chance to<br />
reaffirm the trust that already existed, and also to build on it.<br />
At the height of the crisis, SIX Swiss <strong>Exchange</strong> ensured efficient<br />
and continuous trading. We continually invest in the<br />
most modern trading technology so that this continues. Our market oversight ensured<br />
and continues to ensure that you can rely on fair trading conditions and the equal<br />
treatment of all investors, at all times. By publishing reliable and comprehensive<br />
market information, we ensure a high degree of transparency and thereby provide a<br />
solid foundation for your investment decisions.<br />
In response to the crisis, SIX Swiss <strong>Exchange</strong> has also expanded its offerings. We<br />
would particularly like to mention COSI here. COSI is our prize-winning offering for<br />
the collateralisation of structured financial products. COSI contributed considerably to<br />
helping us build trust and has become a big export success due to its growing popularity.<br />
Our sponsored fund segment, which we launched in March <strong>2013</strong>, is also worthy of<br />
mention. With its selected traditional investment funds, it provides all the advantages<br />
of regulated exchange trading, just as with the ETFs, ETPs and structured financial<br />
products that are traded on the SIX Swiss <strong>Exchange</strong> and on the Scoach <strong>Switzerland</strong>.<br />
The growth of trading volumes and the increased number of providers and financial<br />
products in our various segments is a strong indicator of the trust that has been put<br />
in us. I would like to thank you and ensure you that we will continue to work to earn<br />
your trust every day, and will continue to do so in the future. You can read what the<br />
future holds for exchange traded products in the <strong>Guide</strong>, which contains interesting<br />
articles about the development of the market environment and articles on upcoming<br />
trends. I hope you enjoy reading it. <br />
urs Widmer<br />
coo, sIx swiss <strong>Exchange</strong>
www.scoach.ch<br />
QUALITY IS NOT A<br />
MATTER OF CHANCE*<br />
* It is the product of experience, drive and foresight.<br />
Stock exchange trading of structured products in <strong>Switzerland</strong> is considered to<br />
be of particularly high quality because we pay more than just lip service to<br />
transparency, security and precision. Investors benefit from our experience in<br />
the form of quality that is measurable. A promise that only <strong>Switzerland</strong>’s original<br />
trading exchange can make.
Focus<br />
a (r)evolution with<br />
23 years ago, ETFs were born. since then, they<br />
have increasingly become part of the modern<br />
financial portfolio as transparent, inexpensive<br />
and flexible investment products. The chronicle<br />
of a victory.<br />
07 ExchangE TradEd ProducTs & IndExIng guIdE <strong>Switzerland</strong> <strong>2013</strong><br />
three letters<br />
dp Media<br />
MarTIn raaB<br />
A real accolade for exchange traded funds (ETFs) was bestowed<br />
in March of last year. Investment legend Bill Gross, the Co-<br />
CIO and founder of the famous investment management firm,<br />
PIMCO, announced to the press the launch of the PIMCO Total<br />
Return ETF. With that move, one of the most important active<br />
fund managers in the world launched a passive investment<br />
vehicle – exchange-listed and liquid on a daily basis, instead<br />
of tradable only once per day. Market observers compared<br />
his decision to replicate his flag-ship fund as an ETF as if the<br />
Devil himself had decided to sell holy water. Many doubted the<br />
success of the project. Just one year later, and all the doubters<br />
have been silenced: PIMCO has collected around USD 4.3bn<br />
from investors with its active ETF. This most recent evolution<br />
of the ETF landscape has been a huge success.
Focus<br />
A product concept with added value<br />
When a small group of exchange brokers and exchange employees<br />
in Toronto, Canada developed a new kind of investment<br />
fund 23 years ago that went by the name of the Toronto Index<br />
Participation Fund, they had no idea what revolutionary effects<br />
their new invention would have. The world's first exchange<br />
traded fund was thus born in March 1990. For the first time,<br />
investors could participate in the performance of the Canadian<br />
Stock Index, the TSE 35 Index, without having to go to the arduous<br />
step of purchasing all of the 35 shares in it. From then on, it<br />
was possible to have the entire stock index in one's securities<br />
account by purchasing a single fund share.<br />
Solid advantages<br />
The exchange traded fund performed just like the index and<br />
tracked it like a shadow. In the specialized jargon, this is referred<br />
to as a "passive investment." With it, an investor does<br />
not miss out on a market movement in the index because he<br />
just did not include one or two shares in his share account, or<br />
because he did not otherwise have the means of tracking the<br />
index. The composition and in particular the management — in<br />
the context of the operational administration — of an ETF are<br />
"ETFs become increasingly<br />
popular as product wrapper among<br />
Swiss investors."<br />
clearly simpler and more economical compared with classical<br />
investment funds, because the exclusive goal of the ETF manager<br />
is merely to track the performance of a reference index.<br />
In that way, with ETFs, the investor pays considerably less fees<br />
than he would for classical investment funds, and is always<br />
at least as good as the reference index. These innovative characteristics<br />
continue to define ETFs, to this day.<br />
A kick-start, thanks to some Wall Street innovators<br />
This novel financial product, the ETF, did not remain undiscovered<br />
for long. In January 1993, the idea reached the United<br />
States. Financial product developers Nathan Most and Steven<br />
Bloom in New York City were inspired by the ETF out of<br />
Canada. The two worked for the American Stock <strong>Exchange</strong><br />
(AMEX) and also developed a fund listed on the exchange with<br />
which an investor could track the entire Standard & Poor's<br />
500 Index with just one fund share. The new index fund was<br />
shortened to the four letters "SPDR" - for S&P Depositary Re-<br />
08 ExchangE TradEd ProducTs & IndExIng guIdE <strong>Switzerland</strong> <strong>2013</strong><br />
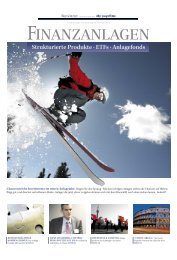
rECord figurES and ContinuaL growth<br />
CHF bn. ETFs<br />
110<br />
1'100<br />
100 Turnover SIX Swiss<br />
1'000<br />
90<br />
<strong>Exchange</strong> (in bn. CHF)<br />
Number of ETFs listed<br />
900<br />
80 on SIX Swiss <strong>Exchange</strong><br />
800<br />
70<br />
700<br />
60<br />
600<br />
50<br />
500<br />
40<br />
400<br />
30<br />
300<br />
20<br />
200<br />
10<br />
100<br />
0<br />
0<br />
2,940 10<br />
6,258 14<br />
8,361 32<br />
10,564 42<br />
13,519 53<br />
2001<br />
2002<br />
2003<br />
2004<br />
2005<br />
2006<br />
18,984 80<br />
28,814 144<br />
39,479 167<br />
2007<br />
2008<br />
source: sIx swiss <strong>Exchange</strong> | as of: 28.06.<strong>2013</strong><br />
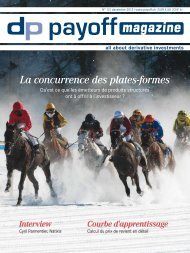
turnoVEr by Etf-iSSuEr<br />
8%<br />
14%<br />
iShares<br />
UBS-ETF<br />
ZKB ETFs<br />
7%<br />
4%<br />
18%<br />
4%<br />
Julius Baer<br />
Lyxor<br />
db x-trackers<br />
Other<br />
source: sIx swiss <strong>Exchange</strong> | as of: 28.06.<strong>2013</strong><br />
50,571 275<br />
71,678 604<br />
2009<br />
2010<br />
ceipts. In the language of the stock exchange, that abbreviation<br />
is pronounced "spider." At first, primarily large-scale asset<br />
managers and banks invested millions in "SPDR." But soon<br />
private investors discovered the advantages of the ETF. The<br />
above-mentioned "SPDR" has become the largest ETF in the<br />
76,082 888<br />
2011<br />
2012<br />
101,938 757<br />
50,316 919<br />
<strong>2013</strong><br />
YTD<br />
45%
Focus<br />
world since then, and has a market capitalization of more than<br />
USD 137bn. ETFs have established themselves in just over ten<br />
years as a fixed component of asset management. Whether<br />
it is private investors, investment consultants or institutional<br />
professional investors - all increasingly use the exchange<br />
traded index funds for their individual investment strategies<br />
and for their asset allocation. Worldwide, there were 269 ETFs<br />
in 2003, in which USD 205bn was invested; ten years later, the<br />
assets globally invested in ETFs reached USD 1.92 trillion, a<br />
new record. At the end of June <strong>2013</strong>, investors had 3,615 ETFs<br />
to choose from.<br />
"The advantages of transparency,<br />
liquidity and low costs are big drivers<br />
of the success story."<br />
An established player on the Swiss exchange<br />
13 years ago, on April 11, 2000, the first exchange traded ETFs<br />
were traded in Europe. Deutsche Börse, the German stock exchange,<br />
enabled ETF trade as the first such exchange in Europe,<br />
using its electronic trading platform, Xetra. At the same<br />
time, in continental Europe, in Scandinavia and Great Britain,<br />
launch of<br />
ETF-segment<br />
300th ETF<br />
<strong>Exchange</strong> <strong>Traded</strong> Funds<br />
First sMI<br />
ETF listed<br />
09 ExchangE TradEd ProducTs & IndExIng guIdE <strong>Switzerland</strong> <strong>2013</strong><br />
ETFs have been used primarily by institutional investors, so far.<br />
Private investors are currently still a minority in <strong>Switzerland</strong>.<br />
But even in <strong>Switzerland</strong>, the number of private investors and<br />
independent asset managers who are becoming interested<br />
in ETFs is clearly rising from year to year. The advantages of<br />
transparency, liquidity and low costs are big drivers of the<br />
success story. On the Swiss stock exchange, known as the<br />
SIX Swiss <strong>Exchange</strong>, the first ETF was authorized for trade on<br />
September 18, 2000. There are now over 900 products from<br />
19 issuers listed on the Zurich exchange. The ETF segment of<br />
the SIX continued to have very positive momentum in the first<br />
half of <strong>2013</strong>. In total, in the first six months of the year, 505,917<br />
transactions were made (+26.9% compared to the prior year)<br />
and the trade volume in them rose to CHF 50.3 billion (+30.1%<br />
compared to the prior period) since the start of <strong>2013</strong>.<br />
Winners and losers, in summary<br />
There have been interesting developments in the ETFs listed<br />
on the SIX, based on the analysis of the most recent inflows/<br />
outflows and based on net inflows and outflows ("net new money")<br />
from January to the end of June <strong>2013</strong>. The iShares S&P500<br />
ETF was the frontrunner – in absolute terms and for all asset<br />
classes – with cash inflows of CHF 1.43 billion. Among the most<br />
The milestones<br />
More than 50 bn.<br />
annual turnover<br />
launch of<br />
multi-currency<br />
trading<br />
First swiss domestic<br />
government Bond ETF<br />
First leveraged<br />
ETF listed<br />
400th ETF listed<br />
First ETF in<br />
usd listed<br />
200th ETF<br />
listed<br />
10th anniversary<br />
of ETFs in<br />
switzerland
Focus<br />
notable financial products, the SPDR Dividend Aristocrats ETF,<br />
which has been listed on the SIX since January 2012, has really<br />
taken off in the last few months. In the area of bond ETFs,<br />
iShares dominated the inflows and in the raw materials area,<br />
UBS was the clear frontrunner. In terms of redemptions, the<br />
emerging markets lost out – particularly in shares. Also very<br />
obvious, but not very surprising was the sell-out in gold ETPs.<br />
"The ETF trade volume on the Swiss<br />
exchange rose to over CHF 50 billion<br />
alone in the first half-year."<br />
On a YTD-basis, many issuers experienced net outflows, from<br />
Zurich Kantonalbank (ZKB) to Julius Bär and that included iShares/BlackRock.<br />
Reading between the lines, we can conclude<br />
that it is noticeable that the products of Lyxor, the ETF branch<br />
of Société Générale, were on the investors' sell lists.<br />
A shift in power, made possible by acquisition<br />
After the acquisition of Credit Suisse's ETF business, BlackRock<br />
(with its ETF brand iShares) is the frontrunner, with a share of<br />
approximately 45% in <strong>Switzerland</strong>, measured in terms of ove-<br />
More than 10 bn.<br />
annual turnover<br />
More than 30 bn.<br />
annual turnover<br />
More than 100 bn.<br />
annual turnover<br />
First ETF on<br />
physical gold listed<br />
More than 20 bn.<br />
annual turnover<br />
888 ETFs listed<br />
in total<br />
10 ExchangE TradEd ProducTs & IndExIng guIdE <strong>Switzerland</strong> <strong>2013</strong><br />
rall ETF sales volume on the SIX. UBS is in second place, but<br />
quite some distance behind, and is currently stable at an 18%<br />
share. In third place is the Zurich Kantonalbank representing<br />
about a 13% trade volume of the exchange. Julius Bär, in addition<br />
to ZKB, also known for its physically backed precious<br />
metal ETPs, attained a trade volume of 7% on the SIX. Julius<br />
Bär is thus on par with Lyxor, the ETF issuer of bank group<br />
Société Générale. In seventh place at 4% is db x-trackers, the<br />
ETP brand of Deutsche Bank. Amundi, Invesco Powershares<br />
and EasyETF are in the middle of the field with an average of<br />
CHF 100 million in quarterly trade volume.<br />
Stock trading gains liquidity<br />
In Europe, ETF orders have a 70:30 relationship between overthe-counter<br />
(OTC) trade and stock exchange trade. According<br />
to the MiFID (Markets In Financial Instruments Directive),<br />
trade transactions in ETFs and ETCs do not have to be reported<br />
to a state credit reporting agency, in contrast to transactions<br />
in shares. The Swiss stock exchange and London stock exchange<br />
are a positive exception to that and thus provide better<br />
transparency. All securities traders who are registered in<br />
<strong>Switzerland</strong> must report their OTC transactions to SIX within<br />
three minutes of order matching or order execution electroni-<br />
100th ETF listed<br />
First short-ETF listed
Focus<br />
cally using an internet tool or standard trading interface. "The<br />
Swiss market is very similar to the rest of Europe in terms of<br />
the share of OTC vs. exchange transactions. The majority of<br />
the local investors there are very sophisticated and often use<br />
the exchange with the best liquidity position, or trade directly<br />
via OTC. But recently, the order flow has shifted and is increasingly<br />
in the direction of the exchange, primarily due to the<br />
growing liquidity there", reported Dr. Andreas Zingg, Head<br />
of German-Swiss sales at BlackRock. As a result of the considerably<br />
improved liquidity, in daily practice, it can often occur<br />
that large individual orders in benchmark ETFs (for example,<br />
on the MSCI Emerging Markets Index) of CHF 250m or more<br />
are sent to SIX to be carried out "on exchange." "At the same<br />
time, BlackRock has been able to make carrying out ETPs in<br />
Europe much more efficient, after intensive discussions with<br />
Euroclear", added Zingg.<br />
"Cross-border processing of ETFs<br />
will become even easier in future."<br />
Processing becomes more unified<br />
In contrast to the USA, where there is a central depository, in<br />
Europe, there are multiple regional security depositories, all<br />
at the national level. Cross-border transactions, for example<br />
ETFs domiciled in Ireland that are traded on the LSE in order<br />
to then send them to a Swiss depository bank currently often<br />
result in high costs. By using a single European settlement<br />
location at the Euroclear Bank, a new international ETF product<br />
structure will improve market liquidity, simplify cross-border<br />
processing, and thereby ultimately considerably lower transaction<br />
costs for the investor. That would be a further accolade<br />
for exchange traded funds. <br />
11 ExchangE TradEd ProducTs & IndExIng guIdE <strong>Switzerland</strong> <strong>2013</strong><br />
SuMMary: EXChangE tradEd fundS<br />
what is an Etf?<br />
ETF is a synonym for index funds, and in English, referred to<br />
as an exchange traded fund. The term describes highly liquid<br />
investment funds that are listed on exchanges and that can<br />
be traded on any trading day. From a legal point of view, they<br />
are publicly authorized funds whose goal it is to track the<br />
price and performance of an index that they are based on. an<br />
investor gains a share of an ETF through a single transaction<br />
that very closely tracks a specific market (for example, the<br />
swiss Market Index).<br />
how is trade in them carried out?<br />
a prerequisite for investing in ETFs is a securities account.<br />
Trade in ETFs can be done either on an exchange or over-thecounter<br />
(oTc). larger orders, of chF 10m for example, are<br />
often done oTc in switzerland. The high liquidity helps ETFs in<br />
reducing and also in building up intraday positions. There is no<br />
termination deadline or minimum holding period.<br />
what advantages and disadvantages do Etfs have?<br />
The main difference and biggest advantage of an ETF in comparison<br />
to a classical investment fund or structured financial<br />
product is that ETFs have the same advantages (e.g. listing on<br />
an officially regulated exchange), but at the same time, avoid<br />
potential disadvantages (issuer risk, lack of transparency).<br />
In addition, ETFs are very competitive with regard to fees.<br />
The ongoing costs for investors are the lowest with ETFs in<br />
comparison to all other financial investments, and particularly<br />
compared to classical investment funds. The only disadvantage<br />
is that an investor owning ETFs never does better than<br />
the reference market that the ETF tracks. If the swiss sMI<br />
stock Index for example climbs 10%, the ETF also gains 10%<br />
on the sMI in value, and vice versa, if the market is weak.<br />
how safe are Etfs?<br />
all ETFs that can be traded in switzerland are — from a legal<br />
point of view — mutual investment funds (in accordance<br />
with the swiss Kag law), the goal of which is to track the<br />
performance of the index that they are based on. The capital<br />
invested is thus designated as "separated" and is not subject<br />
to issuer risk.
Focus<br />
toP-40 infLowS – SiX-LiStEd EtfS/EtCS<br />
naME iSin VaLor tiCKEr iSSuEr CatEgory auM<br />
(in Mn.<br />
Chf)<br />
12 ExchangE TradEd ProducTs & IndExIng guIdE <strong>Switzerland</strong> <strong>2013</strong><br />
nEt-nEw<br />
MonEy<br />
ytd (in<br />
Mn. Chf)<br />
ishares s&P 500 ucITs ETF (Inc) IE0031442068 1396252 Iusa sW Blackrock Equity countries 12'650 1'430<br />
ishares MscI Japan Eur hedged ucITs ETF IE00B42Z5J44 11834409 IJPE sW Blackrock Equity countries 2'007 1'026<br />
Vanguard s&P 500 ETF IE00B3xxrP09 18575508 Vusa sW Vanguard Equity countries 687 591<br />
ishares MscI Japan - B ucITs ETF (acc) IE00B53QdK08 10737498 csJP sW Blackrock Equity countries 1'063 419<br />
ishares MscI World ucITs ETF (Inc) IE00B0M62Q58 2308773 IWrd sW Blackrock Equity regions 5'311 417<br />
sPdr s&P us dividend aristocrats ucITs ETF IE00B6Yx5d40 13976063 usdV sW state street Equity countries 1'127 397<br />
uBs-ETF sIcaV - MscI usa lu0136234654 1272983 usacha sW uBs Equity countries 1'616 342<br />
ishares s&P 500 Eur hedged ucITs ETF IE00B3ZW0K18 11834662 IusE sW Blackrock Equity countries 755 314<br />
uBs-ETF sIcaV - MscI Japan lu0136240974 1272995 JPncha sW uBs Equity countries 1'213 296<br />
sPdr s&P 500 ucITs ETF IE00B6Yx5c33 18118572 sPY5 sW state street Equity countries 478 255<br />
ishares Euro government Bond 3-5yr ucITs ETF IE00B1FZs681 2803883 IBgx sW Blackrock Bond / single ccY 1'341 690<br />
ishares Euro corporate Bond ucITs ETF IE00B3F81r35 10012767 IEac sW Blackrock Bond / single ccY 2'668 408<br />
ishares Emerging Mkts local gov. Bond ucITs ETF IE00B5M4Wh52 13167739 IEMl sW Blackrock Bond / Multi ccY 865 345<br />
ishares usd Treasury Bond 1-3yr ucITs ETF IE00B14x4s71 2585461 IBTs sW Blackrock Bond / single ccY 1'482 335<br />
ishares usd high Yield corporate Bond ucITs ETF IE00B4PY7Y77 13876308 IhYu sW Blackrock Bond / single ccY 1'004 250<br />
db x-trackers II iBoxx germany 1-3 ucITs ETF lu0468897110 10935345 xB13 sW deutsche Bank Bond / single ccY 291 186<br />
ishares JPM usd Emerging Mkts Bond ucITs ETF IE00B2nPKV68 3801845 IEMB sW Blackrock Bond / single ccY 2'071 138<br />
sPdr Barclays EM local Bond ucITs ETF IE00B4613386 12931546 EMdl sW state street Bond / single ccY 691 132<br />
ishares Euro government Bond 1-3yr ucITs ETF IE00B14x4Q57 2585405 IBgs sW Blackrock Bond / single ccY 902 81<br />
ishares Euro aggregate Bond ucITs ETF IE00B3dKxQ41 10012758 IEag sW Blackrock Bond / single ccY 945 73<br />
uBs-ETFs plc - cMcI composite sF IE00B53h0131 11926603 ccusas sW uBs commodities 262 40<br />
uBs-ETFs plc - dJ-uBs commodity Index sF IE00B57PM175 11925917 dcusIs sW uBs commodities 76 37<br />
uBs-Is Platinum ETF ch0116015055 11601505 PTusI sW uBs commodities 128 32<br />
comstage ETF nYsE arca gold Bugs lu0488317701 11058258 cBgold sW commerzbank commodities 86 27<br />
uBs-Is gold (chF) hedged ETF ch0106027128 10602712 auchah sW uBs commodities 649 20<br />
raiffeisen ETF - solid gold ounces ch0134034849 13403484 rFsgoac sW raiffeisen commodities 80 18<br />
JB (ch) Physical Palladium (Eur) ch0106407213 10640721 JBPaEa sW swiss & global aM commodities 26 17<br />
ishares agribusiness ucITs ETF IE00B6r52143 13936193 Isag sW Blackrock commodities 40 16<br />
ishares gold Producers ucITs ETF IE00B6r52036 13937387 IauP sW Blackrock commodities 48 16<br />
JB (ch) Physical Palladium (usd) ch0106407205 10640720 JBPaua sW swiss & global aM commodities 59 10<br />
s&P us select sector Financials source ETF IE00B42Q4896 10854889 xlFs sW source Equity sectors 332 172<br />
Powershares EQQQ Fund IE0032077012 1527010 EQQQ sW Invesco Equity sectors 861 125<br />
lyxor ETF sToxx Europe 600 healthcare Fr0010344879 2632858 lYhlT sW lyxor / socgen Equity sectors 234 57<br />
s&P us select sector Technology source ETF IE00B3Vssl01 10854875 xlKs sW source Equity sectors 93 52<br />
s&P us select sector Energy source ETF IE00B435cg94 10854734 xlEs sW source Equity sectors 55 42<br />
sPdr MscI Europe health care ETF Fr0000001737 1214173 sTWs sW state street Equity sectors 136 37<br />
s&P us select sector Industrials source ETF IE00B3Yc1100 10854741 xlIs sW source Equity sectors 63 35<br />
s&P us select sector healthcare source ETF IE00B3WMTh43 10854910 xlVs sW source Equity sectors 44 33<br />
ishares global Infrastructure ucITs ETF IE00B1FZs467 2758574 InFr sW Blackrock Equity sectors 326 30<br />
lyxor ETF sToxx Europe 600 Telecommucations Fr0010344812 2632800 lYTEl sW lyxor / socgen Equity sectors 135 28<br />
data by<br />
source: etfinfo.com | as of: 28.06.<strong>2013</strong>
Focus<br />
toP-40 outfLowS – SiX-LiStEd EtfS/EtCS<br />
naME iSin VaLor tiCKEr iSSuEr CatEgory auM<br />
(in Mn.<br />
Chf)<br />
13 ExchangE TradEd ProducTs & IndExIng guIdE <strong>Switzerland</strong> <strong>2013</strong><br />
nEt-nEw<br />
MonEy<br />
ytd (in<br />
Mn. Chf)<br />
ishares MscI Emerging Markets ucITs ETF IE00B0M63177 2308849 IEEM sW Blackrock Equity regions 4'875 -1'217<br />
db x-trackers MscI EM Trn ucITs ETF lu0292107645 3067289 xMEM sW deutsche Bank Equity regions 2'821 -509<br />
ishares sMI (ch) ch0008899764 889976 cssMI sW Blackrock Equity countries 3'338 -342<br />
db x-trackers MscI Europe Trn ucITs ETF lu0274209237 2825415 xMEu sW deutsche Bank Equity regions 1'144 -336<br />
db x-trackers MscI EM asia Trn ucITs ETF lu0292107991 3067298 xMaI sW deutsche Bank Equity regions 987 -315<br />
uBs-ETFs plc - MscI Emerging Markets TrnI sF IE00B3Z3Fs74 12894611 Egusas sW uBs Equity regions 866 -285<br />
lyxor ETF MscI EMu (FcP) Fr0007085501 1644700 lYMFE sW lyxor / socgen Equity regions 347 -283<br />
db x-trackers Euro sToxx 50 ucITs ETF lu0274211217 2825565 xEsx sW deutsche Bank Equity regions 2'471 -261<br />
ishares BrIc 50 ucITs ETF IE00B1W57M07 3067362 BrIc sW Blackrock Equity regions 587 -258<br />
ishares MscI Emerging Markets ucITs ETF (lux) lu0254097446 2553407 csEM sW Blackrock Equity regions 947 -241<br />
ishares Euro corporate Bond large cap ucITs ETF IE0032523478 1582841 IBcx sW Blackrock Bond / single ccY 3'800 -344<br />
lyxor ucITs ETF EuroMTs high. rated gov. Bond Fr0010820258 10711757 lYMaa sW lyxor / socgen Bond / single ccY 136 -270<br />
ishares global government Bond ucITs ETF IE00B3F81K65 10012744 Iglo sW Blackrock Bond / Multi ccY 149 -203<br />
lyxor ucITs ETF EuroMTs 5-7Y Investment grade Fr0010411413 2864210 lYMTc sW lyxor / socgen Bond / single ccY 348 -176<br />
ishares usd corporate Bond ucITs ETF IE0032895942 1613957 lQdE sW Blackrock Bond / single ccY 1'345 -136<br />
ishares eb.rexx government germany (dE) dE0006289465 1556285 rxrgEx sW Blackrock Bond / single ccY 625 -125<br />
lyxor ETF sIcaV (Fr) - iBoxx Eur liquid hY Fr0010975771 12170548 lYYIEl sW lyxor / socgen Bond / single ccY 150 -110<br />
db x-trackers II iBoxx sov. Eurozone ucITs ETF lu0290355717 3220213 xglE sW deutsche Bank Bond / single ccY 671 -105<br />
lyxor ETF sIcaV (Fr) - EuroMTs Infl. lkd. Ig Fr0010174292 2110486 lYMTI sW lyxor / socgen Bond / single ccY 242 -82<br />
comstage ETF iBoxx Eur liq. sov. div. 1-3 Tr lu0444605991 10631104 cBEu13 sW commerzbank Bond / single ccY 201 -75<br />
ZKB gold ETF ch0047533523 4753352 ZgldEu sW Zürcher KB commodities 7'313 -1'712<br />
gold source P-ETc IE00B579F325 10326235 sgld sW source commodities 1'612 -1'241<br />
JB (ch) Physical gold Fund (usd) ch0044781141 4478114 JBgoua sW swiss & global aM commodities 1'160 -422<br />
JB (ch) Physical gold Fund (Eur) ch0044781174 4478117 JBgoEa sW swiss & global aM commodities 778 -392<br />
JB (ch) Physical gold Fund (chF) ch0044781232 4478123 JBgoca sW swiss & global aM commodities 999 -359<br />
ishares gold (ch) ch0104136236 10413623 csgold sW Blackrock commodities 929 -188<br />
lyxor ETF comm. T.reuters/J. crB (FcP) Fr0010318998 2529323 crB sW lyxor / socgen commodities 369 -150<br />
EasyETF s&P gscI capped commodity 35/20 lu0203243844 1967784 gscIusd sW BnP Paribas Inves. Par. commodities 186 -81<br />
rBs Market access rIcI Metals ETF lu0259320728 2617059 MrMI sW rBs Market access commodities 32 -52<br />
ishares gold Eur hedged (ch) ch0104136319 10413631 csgldE sW Blackrock commodities 147 -51<br />
ishares nasdaQ 100 ucITs ETF IE00B53sZB19 10737617 csndx sW Blackrock Equity sectors 180 -51<br />
lyxor ETF sToxx Europe 600 Banks (FcP) Fr0010345371 2632934 lYBnK sW lyxor / socgen Equity sectors 517 -41<br />
amundi ETF nasdaQ-100 ucITs ETF Fr0010912568 11462879 anxusd sW amundi Invest.sol. Equity sectors 17 -32<br />
comstage ETF sToxx Europe 600 Banks nr lu0378435399 4561494 cBBanK sW commerzbank Equity sectors 85 -25<br />
lyxor ETF sToxx Europe 600 oil & gas (FcP) Fr0010344960 2757464 lYoIl sW lyxor / socgen Equity sectors 144 -20<br />
sPdr MscI Europe cons. staples ETF Fr0000001745 1214187 sTss sW state street Equity sectors 40 -11<br />
lyxor ETF sIcaV MscI World health care Tr lu0533033311 11603044 lYhlTW sW lyxor / socgen Equity sectors 11 -10<br />
ETFx Wna global nuclear Energy Fund IE00B3c94706 4592951 nuKE sW ETF securities Equity sectors 10 -8<br />
lyxor ETF sIcaV MscI World Inform. Tech. Tr lu0533033741 11602915 lYTnoW sW lyxor / socgen Equity sectors 4 -7<br />
lyxor ETF new Energy (FcP) Fr0010524777 3466091 lYnrJ sW lyxor / socgen Equity sectors 55 -5<br />
data by<br />
source: etfinfo.com | as of: 28.06.<strong>2013</strong>
Focus<br />
dp Media<br />
Shedding light on product concepts<br />
Being traded on an exchange is a common<br />
denominator of exchange traded financial<br />
products. however, this product group also<br />
comprises variants and some abbreviated<br />
terms. an excursion into the world of exchange<br />
traded instruments.<br />
14 ExchangE TradEd ProducTs & IndExIng guIdE <strong>Switzerland</strong> <strong>2013</strong><br />
dIETEr haas<br />
Only in rare cases do laymen know what the financial market<br />
abbreviations ETF, ETC, ETN, ETV, ETI and ETP mean. Even the<br />
pros often have a hard time always being able to define the<br />
concepts and putting them in their correct product categories.<br />
In the English-speaking world, exchange traded products are<br />
the general term for exchange traded financial products. However,<br />
the Swiss exchange defines this a bit differently. ETPs<br />
are a separate segment there. But let's start at the beginning:<br />
The conceptual world of the "E-" products began over 20 years<br />
ago when exchange traded funds (ETFs) were introduced on<br />
exchanges in North America.<br />
In the beginning was the ETF<br />
ETFs track passive indices and are considerably less expensive<br />
and often more flexible than actively managed investment<br />
funds. For a stock ETF, investors generally pay considerably<br />
less than 1% annually in management fees. Active funds, on the<br />
other hand, generally charge up to 2% per year. In addition, an
Focus<br />
ETF can be traded on a daily basis and covers many investment<br />
segments in an inexpensive manner. That has contributed significantly<br />
to the ETF gaining in popularity. At the beginning<br />
of the year, the assets managed under ETFs broke through<br />
the two trillion dollar mark. In the areas of transparency and<br />
safety, ETFs are also very competitive. <strong>Exchange</strong> listed index<br />
funds are subject to UCITS regulations, the fund components<br />
are published on the internet on a daily basis, and the assets<br />
of an ETF are protected against bankruptcy.<br />
"At the beginning of the year, the assets<br />
managed under ETFs broke through the<br />
two trillion dollar mark."<br />
ETPs in certificate form<br />
More recently, the products that are packaged in certificate<br />
form are exchange traded commodities (ETCs), exchange<br />
traded notes (ETNs) and exchange traded trackers (ETTs). They<br />
are all part of the general category of exchange traded financial<br />
products, also referred to as exchange traded products<br />
(ETPs). ETCs track the performance of raw material commodity<br />
indices and raw materials. Such tracking can be in the form<br />
of physical replication (e.g. warehousing of gold bars) or by<br />
PaSSiVE finanCiaL ProduCtS in SwitzErLand<br />
15 ExchangE TradEd ProducTs & IndExIng guIdE <strong>Switzerland</strong> <strong>2013</strong><br />
tracking raw material futures. With ETCs, securities, precious<br />
metals and cash accounts are used as collateral. They have to<br />
at least cover the outstanding amount and be kept by a third<br />
party who is independent with respect to the issuer. They differ<br />
from the asset-backed certificates (COSIs) by not having<br />
a limit on the term, by using multi-market making and also<br />
in their fixed payout structure. ETNs are a more or less rare<br />
form of securitisation in Europe. Those securities are de facto<br />
unsecured bonds of the issuer and thus can be equated with<br />
structured financial products. ETNs are also, from a conceptual<br />
point of view, widely known in the US; particularly UBS and<br />
Barclays use those financial product variants frequently. The<br />
term ETT was also created by UBS. An ETT generally has the<br />
stock index that is used to calculate the net dividends of the<br />
index members as its underlying asset. ETTs are not mutual<br />
funds, rather they are simply structured products or tracker<br />
certificates that rely on efficient tracking of the index.<br />
The most obvious difference between the ETPs and COSI products<br />
however lies in the way that security is provided, in<br />
particular regarding the supervision, the storage, the kind of<br />
valuation as well as the utilisation of the collateral. Structured<br />
products and tracker certificates with COSI collateral almost<br />
totally shut out any issuer risk. However, viewed numerically,<br />
gEnEraL tyPE StruCturE CoLLatEraLizEd tErM MarKEt MaKing EXChangE Payoff<br />
StruCturE<br />
ETF<br />
(<strong>Exchange</strong><br />
<strong>Traded</strong> Funds)<br />
ETP<br />
(<strong>Exchange</strong><br />
<strong>Traded</strong> <strong>Products</strong>)<br />
certificate<br />
with cosI<br />
Fund under cIsa Yes 1 open-end Multi market making<br />
with obligations<br />
(as a rule short selling<br />
possible)<br />
debt security Yes 2 open-end/<br />
flexibel<br />
Multi market making<br />
with obligations<br />
(as a rule short selling<br />
possible)<br />
debt security Yes 3 Max. 10 years single market making<br />
with obligations<br />
(as a rule by issuer; intraday<br />
short selling possible)<br />
certificate debt security no open-end/<br />
flexibel<br />
single market making<br />
with obligations<br />
(as a rule by issuer; intraday<br />
short selling possible)<br />
symmetrical ETF<br />
naMES on<br />
MarKEt<br />
symmetrical <strong>Exchange</strong> <strong>Traded</strong><br />
notes (ETn) /<br />
<strong>Exchange</strong> <strong>Traded</strong><br />
commodities (ETc)<br />
symmetrical +<br />
asymmetrical<br />
symmetrical +<br />
asymmetrical<br />
collateral secured<br />
Instruments (cosI)<br />
according to<br />
swiss derivative Map<br />
source: scoach, sIx swiss <strong>Exchange</strong><br />
1 segregated pool of assets as defined by law (collective Investment schemes act (cIsa)) – products subject to regulation by FInMa.<br />
2 collateral deposited with a third party.<br />
3 collateral deposited with sIx securities services ltd in the form of securities or book money to minimize issuer risk.<br />
Independent valuation of the certificate by sIx Financial Information ltd, derivative Partners research ltd, European derivatives group ltd, deriva structured <strong>Products</strong> International ltd & swissQuant group.
Focus<br />
the ETPs (based on the Swiss definition, those comprise ETCs<br />
and ETNs) introduced on the SIX Swiss <strong>Exchange</strong> in 2010 have<br />
— up to now — played a very minor role. Only this year was that<br />
drought broken. The segment is significantly smaller compared<br />
with ETFs, ETCs and COSIs, and currently has slightly more<br />
than 60 products. Last but not least, the terms ETI and ETV<br />
come up again and again. They are made up of the somewhat<br />
"The most obvious difference between<br />
ETPs and COSI products lies in the way<br />
that security is provided."<br />
clumsy general terms exchange traded instruments and exchange<br />
traded vehicles. With this, our trip through the thicket<br />
of concepts has come to an end. However, new terms can<br />
always be right around the corner. The creativity of financial<br />
product developers and issuers is great, as we know. <br />
CoLLatEraLization of EtPS and CoSi ProduCtS in SwitzErLand<br />
SuPErViSion<br />
of CoLLatEraL<br />
ProVidEr<br />
CoLLatEraL aMount of<br />
CoLLatEraL<br />
cosI ® FInMa-regulated selected securities<br />
accepted by snB<br />
and EcB, certain<br />
shares and Bank<br />
money<br />
ETP not stipulated securities,<br />
precious metals<br />
or Bank money<br />
(list not complete)<br />
source: scoach, sIx swiss <strong>Exchange</strong><br />
at least 100 % of the<br />
current value of the<br />
certificate (calculated<br />
according to the standardized<br />
rules of the<br />
framework agreement)<br />
at least 100 % of the<br />
outstanding amount<br />
16 ExchangE TradEd ProducTs & IndExIng guIdE <strong>Switzerland</strong> <strong>2013</strong><br />
CuStody tyPE of VaLuation Liquidation of<br />
CoLLatEraL<br />
sIx swiss <strong>Exchange</strong><br />
account at sIx<br />
securities<br />
services<br />
Independent<br />
third party<br />
(depositary and<br />
custodian)<br />
"thE Et faMiLy" -<br />
an oVErViEw of thE abbrEViationS<br />
EtC <strong>Exchange</strong> traded commodities are exchange traded<br />
products (similar to tracker certificates) based on physical<br />
raw materials, raw material indices or raw material<br />
futures. ETcs generally have collateral.<br />
Etf <strong>Exchange</strong> traded funds are exchange traded investment<br />
funds (ucITs/assets of an investment firm), that are<br />
traded on an exchange.<br />
Etn <strong>Exchange</strong> traded notes is a concept imported from<br />
north america, and is used for passive index products.<br />
ETns are unsecured bonds and thereby comparable to<br />
structured products and tracker certificates.<br />
EtP <strong>Exchange</strong> traded products refer to the collective concept<br />
from the English-speaking world for passive, exchange<br />
traded products. In the terminology of the sIx swiss<br />
<strong>Exchange</strong>, these are bonds that have a symmetrical<br />
payout structure and are secured by collateral.<br />
Ett <strong>Exchange</strong> traded tracker also follow a passive investment<br />
strategy or index tracking and are a structured product, not<br />
listed investment funds. The term was coined by uBs.<br />
EtV <strong>Exchange</strong> traded vehicles is a general term that was<br />
coined in north america. In general, the term denotes<br />
ETPs in the English-speaking world.<br />
collaTEral InsTruMEnT<br />
standardized valuation<br />
process using prices<br />
from sIx Financial<br />
Information<br />
at the discretion of<br />
the issuer / collateral<br />
provider<br />
Valuation by<br />
independent<br />
institutions as<br />
well as closing<br />
price on scoach<br />
Immediately after<br />
occurrence of a<br />
liquidation event<br />
at the discretion of depending on<br />
the issuer / collateral issuer, individual<br />
provider<br />
liquidation process;<br />
in accordance with<br />
product terms
adVErTorIal<br />
The investor in the forefront<br />
Investor protection and exchange trading go<br />
hand in hand. That is because transparency<br />
and the equal treatment of all investors are the<br />
foundation of regulated trade on the sIx swiss<br />
<strong>Exchange</strong>.<br />
17 ExchangE TradEd ProducTs & IndExIng guIdE <strong>Switzerland</strong> <strong>2013</strong><br />
www.fotolia.com<br />
urs WIdMEr<br />
In its first Article, the Federal Act on Stock <strong>Exchange</strong>s and Securities<br />
Trading (SESTA), or the Stock <strong>Exchange</strong> Act for short,<br />
states that transparency and equal treatment must be ensured<br />
for all investors. Fulfilling that task is of central importance<br />
for the Swiss <strong>Exchange</strong>. Thanks to its proven system of selfregulation,<br />
it does this efficiently and practically.<br />
Safety through information<br />
SIX Swiss <strong>Exchange</strong> ensures transparency with its information<br />
offering. Investors can review the Swiss <strong>Exchange</strong> website to<br />
obtain a picture of all trading activities in all segments. During<br />
trading times, an electronic order book is shown on the site for<br />
each security and for each fund. This allows purchase and sales<br />
orders that have not yet been carried out to be observed with a<br />
15-minute delay or, if desired, in real time. Additional columns<br />
on the website provide information on what volumes (quantity<br />
or nominal) there are for each price level in the order book.<br />
Historical trading data are also available, of course.
adVErTorIal<br />
Helping investors in their decisions<br />
Particularly in the area of exchange traded investment products,<br />
SIX Swiss <strong>Exchange</strong> makes available the data that was<br />
generated during a trading day, to investors in a manner that<br />
fits their needs. Examples of this are the Quotes Quality Metrics<br />
(QQM) for structured financial products and the Market<br />
Quality Metrics (MQM) for ETFs and ETPs. These free statistics<br />
tools enable a comparison of average spread values of<br />
individual products. In this way, investors obtain additional<br />
helpful information before they make a decision for or against<br />
purchasing a specific product. Detailed information rounds out<br />
the information, and contains information on the individual<br />
financial providers and their products, for example monthly<br />
reports, prospectuses and factsheets.<br />
"Ensuring transparency and equal<br />
treatment for the investor: for the Swiss<br />
<strong>Exchange</strong>, that is of central importance."<br />
A regulated market and clear rules<br />
The equal treatment of all market actors is a key element of<br />
investor protection. SIX Swiss <strong>Exchange</strong> ensures this with<br />
its market oversight, which continually monitors trading and<br />
monitors compliance with the trading guidelines and relevant<br />
laws. If fair and orderly price formation is not present, the<br />
market oversight will interrupt trading and declare trades<br />
to be invalid. In this way, it sees to it that fair, regulated and<br />
efficient trading exists.<br />
No unfair advantages in trading<br />
For ETFs, ETPs and sponsored funds that are traded on the SIX<br />
Swiss <strong>Exchange</strong> in a market-making segment, the market oversight<br />
body makes sure that the market makers are meeting<br />
their duties. The duties of the market maker include: setting<br />
the relevant bid and offer rates for the relevant securities,<br />
making available minimum volumes and not exceeding maximum<br />
bid-offer spreads. This ensures that liquidity is always<br />
present and that orders are calculated at current prices that<br />
reflect the market.<br />
Modern trading technology<br />
The mission formulated in the <strong>Exchange</strong> Act is designed to attain<br />
efficient trading, among other things. SIX Swiss <strong>Exchange</strong><br />
continually invests in the improvement of its trading platform<br />
18 ExchangE TradEd ProducTs & IndExIng guIdE <strong>Switzerland</strong> <strong>2013</strong><br />
and thereby ensures optimal trading conditions. Today, it uses<br />
modern trading technology, which was expanded after the<br />
stock segment was started in April 2012 and now includes<br />
additional segments.<br />
More efficient risk management<br />
Thanks to the high speed available for transmitting market<br />
data and for making transactions, price movements can be<br />
quickly recognized and the relevant investment- and marketmaking<br />
decisions can be efficiently realised. This represents<br />
considerable value-added for the ultimate investor, because he<br />
or she can immediately realise his or her investment decisions,<br />
and can rapidly adjust or reduce the investment risk.<br />
Because SIX Swiss <strong>Exchange</strong> reliably meets its legal mission,<br />
investors can then focus solely on realising their investment<br />
strategies. In addition, the Swiss <strong>Exchange</strong>, with its attractive<br />
trading segments and the multiplicity of products contained in<br />
it offers the greatest possible choice, safety and flexibility.
InTErVIEW<br />
«standardised and<br />
reliable hedging.»<br />
Matthias Müller, head of cosI Product<br />
Management at sIx swiss <strong>Exchange</strong>, on<br />
the multifaceted background of collateralisation<br />
of structured <strong>Products</strong>.<br />
MarTIn raaB<br />
Matthias, in a nutshell, how can COSI and<br />
its history to date be described?<br />
As a result of the financial crisis, investors are looking much<br />
closer at counterparty risks in their investments. There is a<br />
general desire to hedge in the same way as professional market<br />
players. With COSI, we meet the demand for standardised<br />
and reliable hedging in contrast to issuer risk associated with<br />
Structured <strong>Products</strong>. COSI was once a niche Product, but is<br />
now widely accepted as a standard market Product.<br />
What percentage of Structured <strong>Products</strong><br />
are collateral secured?<br />
At present, 20% of all investment products traded on Scoach<br />
Schweiz are collateral secured. In the case of warrants, the<br />
proportion is 0.1%, which is much less. This is because when<br />
compared with market risks, issuer risk for these <strong>Products</strong><br />
does not play a significant role.<br />
Which <strong>Products</strong>, in particular, regularly<br />
include a COSI feature?<br />
19 ExchangE TradEd ProducTs & IndExIng guIdE <strong>Switzerland</strong> <strong>2013</strong><br />
Barrier Reverse Convertibles account for roughly half the COSI<br />
<strong>Products</strong>. Relatively, the largest market portion by far is made<br />
up of investment <strong>Products</strong> with reference issuers. In <strong>Switzerland</strong>,<br />
three quarters of these <strong>Products</strong> have a COSI feature.<br />
Protection has its price. What are the costs<br />
for a COSI feature?<br />
Investors, who wish to have COSI as a hedge against issuer<br />
risk receive on average 40 to 50 basis points less return per<br />
annum. The costs for collateral security vary within this range,<br />
as every issuer has different costs to cover in relation to the<br />
security offered.<br />
Is it possible for all types of securities to<br />
perform as COSIs – which standards apply?<br />
It is possible to implement securities which are accepted by<br />
SNB or EZB, e.g. highly liquid stocks and book money in the<br />
most important currencies. We only accept bonds with an<br />
adequate minimum rating and sufficient liquidity. Based on<br />
strict quality controls, presently only about 5% of all securities<br />
accepted by the ECB are allowed to be used as collateral for<br />
COSI. Individual selection criteria are constantly modified to<br />
suit the current market.<br />
Similar to collaterals for ETFs, are there plans<br />
to allow the COSI securities for the individual<br />
products to be accessible online?<br />
In the case of an enforcement event, different to synthetic<br />
ETFs, COSI investors are contractually entitled to receive their<br />
money back after 30 days. This fast payoff requires the securities<br />
to be immediately liquid. If the exact composition of<br />
the securities were known at the time of enforcement, other<br />
market players could use this information to their advantage.<br />
In turn, this would have a negative effect on the proceeds level;<br />
clearly disadvantageous for the investor. <br />
Many thanks!
Matthias Müller is product manager cosI<br />
at sIx swiss <strong>Exchange</strong> and since 2008<br />
responsible for setup, implementation and<br />
frequent development of the issuer inde-<br />
pendent platform for collateral secured<br />
instruments. The platform is owned and<br />
operated by sIx swiss <strong>Exchange</strong>. after se-<br />
veral positions with uBs and credit suisse<br />
he joined sIx swiss <strong>Exchange</strong> in 2004.<br />
since that time Matthias was in charge of<br />
the listing process of structured products<br />
and bonds. Today he is responsible for<br />
strategic initiatives within the structured<br />
product segment. recently, he headed the<br />
introduction of gold as trading currency.<br />
Advertisement<br />
OUR BABY JUST KEEPS<br />
GETTING BIGGER.<br />
20 ExchangE TradEd ProducTs & IndExIng guIdE <strong>Switzerland</strong> <strong>2013</strong><br />
"The COSI securities are closely examined on<br />
the basis of strict quality selection criteria."<br />
Twenty years ago, we conceived an innovative<br />
product to help investors build diversifi ed<br />
portfolios – the <strong>Exchange</strong> <strong>Traded</strong> Fund (ETF).<br />
And today, our family of SPDR ® ETFs has grown<br />
to over 180 funds worldwide. So, no matter<br />
what your portfolio strategy, there’s sure to be<br />
a SPDR ETF for you.<br />
Take your fi rst steps and learn more at<br />
spdretfsinsights.com<br />
SPDR ETFs is the exchange traded fund (“ETF”) platform of State Street Global Advisors and is comprised of funds that have been authorised by European<br />
regulatory authorities as open-ended UCITS investment companies. ETFs trade like stocks, are subject to investment risk and will fl uctuate in market<br />
value. The value of the investment can go down as well as up and the return upon the investment will therefore be variable. Changes in<br />
exchange rates may have an adverse effect on the value, price or income of an investment. Further, there is no guarantee an ETF will achieve its investment objective. SPDR ETFs may not be available<br />
or suitable for you. This advertisement does not constitute investment advice or an offer or solicitation to purchase shares of SPDR ETFs and has been issued by State Street Global Advisors (“SSgA”). SPDR ETFs<br />
may be offered and sold only in those jurisdictions where authorised, in compliance with applicable regulations. You should obtain and read a prospectus and Key Investor Information Documents (KIIDs) relating<br />
to the SPDR ETFs prior to investing. Further information and the prospectus/KIIDs describing the characteristics, costs and risks of SPDR ETFs are available for residents of countries where SPDR ETFs are authorised<br />
for sale, at www.spdrseurope.com and from your local SSgA offi ce. “SPDR” is a registered trademark of Standard & Poor’s Financial Services LLC (“S&P”) and has been licensed for use by State Street Corporation.<br />
No fi nancial product offered by State Street Corporation or its affi liates is sponsored, endorsed, sold or promoted by S&P or its affi liates, and S&P and its affi liates make no representation, warranty or condition<br />
regarding the advisability of buying, selling or holding units/shares in such products. © <strong>2013</strong> State Street Corporation – All rights reserved. IBGE-0773.<br />
C52618 Baby UK_84x165.indd 1 15/08/<strong>2013</strong> 12:31
Focus<br />
Success factors in trading<br />
ETFs, ETcs and tracker certificates are<br />
characterized by a high degree of flexibility.<br />
however, there are some things to consider<br />
when trading these financial instruments. What<br />
investors should pay attention to, from liquidity<br />
to the competence of the market maker.<br />
21 ExchangE TradEd ProducTs & IndExIng guIdE <strong>Switzerland</strong> <strong>2013</strong><br />
www.fotolia.com<br />
MarTIn raaB<br />
Passive index products such as ETFs, ETCs and index trackers<br />
have undoubtedly revolutionized the investing world. Using<br />
these intelligent products, private investors and asset managers<br />
are able to easily compete with institutional professionals<br />
with regard to how prices develop in entire stock exchanges,<br />
industries and regions, but also in raw materials, pension funds<br />
and currencies. The advantages of passive index products can<br />
be described in three words: simple, inexpensive and transparent.<br />
Because that is true, they are often used for tactical asset<br />
allocation – meaning, for short-term trading and in securing<br />
risk positions. However, particularly with regard to short- to<br />
medium-term trading with these products, there are some important<br />
things to pay attention to. Specifically, the "hidden"<br />
costs are important.<br />
In a nutshell<br />
Over the years, the average time that an ETF remained in the<br />
securities account of investors has shortened. In many cases,
Focus<br />
it has been reduced to merely a few days or even a few hours.<br />
But the shorter the time held, the more important the spread<br />
becomes, in other words, the bid-offer spread (aka buy-sell<br />
spread) as a cost factor. Let's assume, for instance, that an<br />
investor buys an ETF in the morning and holds it until shortly<br />
before the end of trading on an exchange and then sells it at a<br />
profit of 0.50%. A difference in the spread of five basis points<br />
(0.05%) is more important than it would be for a more long-term<br />
oriented investor. For classical tracker certificates, the following<br />
also holds true: The closer the spread, the more attractive it<br />
is to use the instrument for tactical positions. Depending on the<br />
underlying asset, the average spread (five-day) will fluctuate<br />
between 0.15% and 0.50%.<br />
Liquid benchmarks, low spreads<br />
An important influencing factor of the spread is liquidity, and<br />
the following applies: The more liquid the market, the deeper<br />
will be the implicit transaction costs and the closer will be the<br />
spread. Thus, the daily trading volume provides information<br />
on the effective depth of the liquidity. Looking at the SIX (the<br />
Swiss exchange), for example, in the second quarter of <strong>2013</strong>,<br />
the SMI-ETF, which had previously been referred to as the<br />
"Credit Suisse ETF on SMI", which had a trading volume of a<br />
total of CHF 1.6 billion, was the strongest index fund in terms<br />
of sales volume. For that product, the time-weighted average<br />
spread was an extremely low 0.04%. In that case, the high<br />
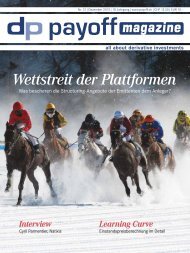
CrEation/rEdEMPtion-ProCESS<br />
shares<br />
ETFunits<br />
source: dp Media<br />
Etf-issuer<br />
authorized Participant<br />
Creation redemption<br />
ETF-units / cash<br />
investor<br />
shares<br />
ETFunits<br />
22 ExchangE TradEd ProducTs & IndExIng guIdE <strong>Switzerland</strong> <strong>2013</strong><br />
order flow – in the benchmark and also in the fund – played<br />
a role. For less liquid products, close spreads of that kind are<br />
hardly possible. Investors should take a look at the SIX ETF<br />
sub-site and then take a look at the "spreads" part. The buy-sell<br />
spreads of the previous 20 trading days are detailed there in a<br />
transparent and very detailed manner.<br />
A fine difference<br />
Another factor has an influence on the level of the spread and<br />
is often overlooked: the commitments made by the market<br />
maker. The market maker is the daily market interface between<br />
the seller and buyer. The market maker makes binding<br />
quotes on sales and purchase prices for ETFs in order to ensure<br />
that trading functions smoothly. The spread is a commercial<br />
incentive to act and thus to create liquidity. "The will and the<br />
ability of the market maker to quote competitive buy and sell<br />
prices is enormously important for an ETF," says Mark Vallon,<br />
"The shorter the holding time of a<br />
product is, the more important is the<br />
spread as a cost factor."<br />
Director and Head of Sales for <strong>Switzerland</strong> at Source, an ETP<br />
issuer. "Along with the high trading volume, the competition<br />
among various market makers also helps to keep the spreads<br />
tight." But market makers do not generally have a comprehensive<br />
contract with the issuers on pricing; rather, they act<br />
as "purchasers and sellers of previously-owned securities."<br />
Actually, that kind of "authorized dealer" is an authorized participant<br />
(AP), as they are referred to. The dealer is authorized to<br />
trade baskets of shares directly with the issuer — as described<br />
below — in the context of a subscription/redemption process.<br />
Competition improves business<br />
To what extent a multi-market strategy can have an affect that<br />
favors the investor is described, for example, in a study by<br />
Vanguard, a US ETF offerer. The study looked at the connection<br />
between the number of market makers and the average<br />
spread. There are eight market makers working at the S&P 500<br />
for Vanguard ETF, whereas on average, all the S&P 500 ETFs<br />
that were looked at had only three service providers each,<br />
quoting prices. The result: For Vanguard's product, the average<br />
spread was nine basis points, but for the overall population, it<br />
was 17 basis points.
Focus<br />
Differing time zones<br />
An important criterion for trading with ETFs and index trackers<br />
is also trading times. The reason is that this often involve<br />
markets whose exchange trading times are outside domestic<br />
trading times. "In trading times in which the market maker<br />
does not have the chance to buy or sell foreign shares on<br />
his own home exchange because it has closed, the bid-offer<br />
spreads are usually a bit wider, because they have an increased<br />
security risk for the market maker," states Source Manager<br />
Mark Vallon. For the investor, this specifically means: Anyone<br />
trading at SIX in Zurich with benchmarks such as the US S&P<br />
500 Index will have to take into account higher spreads in the<br />
calculation. Certainly, the surcharges for important benchmarks<br />
are kept in tight limits. Andreas Bartels of ETF Sales<br />
Trading at Commerzbank explains why: "Reference exchanges<br />
such as futures markets offer sufficient liquidity even for a<br />
closed underlying market, so that the market maker can continuously<br />
quote on the ETF exchange."<br />
Additional factors<br />
Along with the aspect of the differing time zones, there are<br />
other factors that influence hedging costs for the market maker<br />
and lead to the bid-offer spread widening. Thus, for the<br />
market maker, it is more difficult and more expensive to secure<br />
against risk when a passive product involves exotic or<br />
highly-regulated markets such as Indian shares. Sharply rising<br />
volatility can also lead to the bid-offer spread widening. As an<br />
example, after the nuclear catastrophe in Fukushima, Japan,<br />
the bid and offer prices for ETFs on the MSCI Japan exchange<br />
were quite wide. Some market makers even stopped quoting<br />
prices due to the high level of uncertainty.<br />
The creation/redemption process<br />
While secondary market business is being carried out on the<br />
exchange, the primary market operates using a complex creation/redemption<br />
process. For physically replicated ETFs, an<br />
authorized market maker, the AP (authorized participant), puts<br />
together a basket that mirrors what the index contains. For delivering<br />
this basket, he receives as compensation from the ETF<br />
offerer fund shares in the same value as the basket - the "creation"<br />
is thereby carried out. In the context of a "redemption",<br />
the authorized participant gives ETF shares back to the issuer.<br />
He receives shares in compensation. For swap-based ETFs,<br />
cash is exchanged for new share certificates. With the inflow<br />
of funds, the ETF firm receives a basket of securities from a<br />
counterparty, that does not correspond to the index. The offerer<br />
23 ExchangE TradEd ProducTs & IndExIng guIdE <strong>Switzerland</strong> <strong>2013</strong><br />
SuMMary: trading thE right way<br />
in thE SECondary MarKEt<br />
The liquid secondary market is viewed as one of the central<br />
advantages of passive finance products. however, exchange<br />
trading in this segment is not free of traps. For example, for<br />
ETFs with exotic underlying assets, the spread can widen considerably.<br />
The same applies to the most diverse time zones and<br />
unforeseen events. ultimately, it is up to the product offerers<br />
themselves to carry out smooth, liquid and cost-effective trades<br />
by means of comprehensive and professional market making.<br />
uses a swap to exchange the performance resulting from that<br />
for the price development of the index. Independently of the<br />
type of replication, for the issuance/redemption, a fee applies,<br />
which is billed by the ETF firm to the market maker in the<br />
context of the primary market transaction and that the market<br />
maker includes in its calculation in the secondary market – i.e.<br />
ultimately, in the spread.<br />
"The market maker is the market<br />
interface between the seller and buyer."<br />
Due to the creation/redemption process, the price of the ETF<br />
is — for the most part — very close to the net asset value (NAV).<br />
However, it can also occur that a passive fund is traded with a<br />
markup or discount to its net asset value. This discrepancy is<br />
possible, for example, when relative new developments move<br />
the markets, but the underlying stock exchange has already<br />
closed. However, larger deviations only rarely continue for<br />
longer periods of time. Ultimately, that would waken the interest<br />
of arbitrageurs who would attempt to exploit the price<br />
differences, for profit. At the latest, when that "species" of<br />
market participant becomes active, the ETF price again approaches<br />
the NAV. In the end, the following can be said: For<br />
tactical investments with ETFs (including tracker certificates)<br />
investors should primarily pay attention to low spreads and the<br />
bid-offer volumes. This depends, in particular, on the liquidity<br />
of the market and on the competency of the market maker.<br />
However, larger fluctuations in the bid-offer spread can occur.<br />
Therefore, Andreas Bartels of Commerzbank says: "It is a good<br />
idea to work with bid and offer limits, because even with the<br />
most liquid products, due to short-term events, a sub-optimal<br />
execution of the order can occur."
Trade funds like shares –<br />
observe, choose, buy<br />
Enjoy all the benefits of regulated on-exchange trading – also for mutual<br />
funds. In our Sponsored Funds segment, investors are always kept in the<br />
picture: our high levels of transparency, continuous pricing by market makers<br />
and instant order execution in fund trading allow you to react even faster to<br />
market developments and to know immediately which price you achieved.<br />
www.six-swiss-exchange.com/sponsoredfunds
Focus<br />
hard facts about<br />
soft costs<br />
Passive products rank highly amongst investors,<br />
particularly, due to low fees. There are a<br />
number of criteria, on the basis of which actual<br />
costs can be measured and compared. a collection<br />
of facts, which investors and advisors<br />
should bear in mind.<br />
25 ExchangE TradEd ProducTs & IndExIng guIdE <strong>Switzerland</strong> <strong>2013</strong><br />
www.fotolia.com<br />
dIETEr haas and MarTIn raaB<br />
In relation to size alone, the US market traditionally is in a<br />
league of its own. Across the big pond, different dimensions<br />
exist also for <strong>Exchange</strong> <strong>Traded</strong> <strong>Products</strong> (ETPs). For example,<br />
the American ETP market reached a volume of more than<br />
1.4 billion US dollars, according to Deutsche Bank Market<br />
Research figures. This is roughly equivalent to the GDP of<br />
Australia. Despite enormous growth rates in the recent past,<br />
ETPs in Europe managed only approximately a quarter of this<br />
immense sum. Irrespective of this large discrepancy in the<br />
capital stock, which is invested in exchange traded financial<br />
products, the price war in the USA, already unleashed for<br />
some time, has also reached Europe. On both sides of the<br />
Atlantic, two institutions form the main focus: BlackRock<br />
and Vanguard. Vanguard lured more and more US investors<br />
with low fees, forcing the global number one – BlackRock – to<br />
follow suit. BlackRock lowered the fees for some <strong>Exchange</strong><br />
<strong>Traded</strong> Funds (ETFs) of its captive label iShares.
Focus<br />
Low-price strategies are en vogue<br />
As well, attention has turned to the two protagonists within<br />
the Swiss ETP market. At the beginning of the year, Black-<br />
Rock set its mark by taking over the ETF business at Credit<br />
Suisse. Immediately, BlackRock rose to the position of top dog<br />
of SIX Swiss <strong>Exchange</strong>. Only weeks after the deal had been announced,<br />
Vanguard followed suit. For the first time, the world’s<br />
third-largest ETP provider, listed products on the Swiss stock<br />
exchange SIX. Apart from the S&P 500, the funds represent the<br />
FTSE Emerging Markets Index, as well as the FTSE All-World<br />
Index. Vanguard caused a stir, particularly in relation to fees:<br />
the ETF on the US leading index, for example, is available at a<br />
total expense ratio (TER) of 0.09%. This strategy is facilitated<br />
by the co-operative structure of the company organisation.<br />
"We pass on the resulting cost advantages directly to the funds<br />
and our investors " explains Jacques-Etienne Doerr, Managing<br />
"The price war unleashed in the USA<br />
for some time has reached Europe."<br />
Officer of Vanguard Investments <strong>Switzerland</strong>. This concept is a<br />
huge success with investors. "Since the launch of the European<br />
ETFs a year ago, we have issued more than one billion Swiss<br />
francs", the manager is pleased to announce.<br />
Heated debate over TER<br />
TER is a well-known criterion for evaluating ETFs. It includes<br />
costs incurred in complying with legal requirements, as well<br />
as administration and operating costs; for example, licence<br />
fees for an index, which is replicated in the ETF wrapper, or<br />
storage costs for physically-backed precious metal products.<br />
However, it would be too one-sided to consider the costs related<br />
to acquiring a passive investment product only within the<br />
context of TER. "To date, there is no clear definition for this<br />
figure" states Mark Vallon, director at Source - an ETP provider.<br />
Another important component is the costs for replication. If the<br />
issuer uses a synthetic method, he enters swap contracts with<br />
one or more counterparties.<br />
Replication incurs costs<br />
Of course, there are fees involved in these exchange deals. Occasionally,<br />
issuers include these costs in the TER. Physical replication<br />
is a contrasting concept to the swap-based approach.<br />
In this instance, the ETF includes either all or most of the securities<br />
of the underlying index according to their weighting<br />
26 ExchangE TradEd ProducTs & IndExIng guIdE <strong>Switzerland</strong> <strong>2013</strong><br />
CoSt CoMPariSon in PraCtiCE:<br />
ETFs on ThE sMI<br />
VaLor iSSuEr auM (Mio. Chf) tEr tE<br />
3 yEarS<br />
tE<br />
5 yEarS<br />
889976 ishares* 3'462 0,39% 0,02% 0,04%<br />
1714271 uBs 928 0,35% 0,03% 0,07%<br />
ETFs on ThE Euro sToxx 50<br />
VaLor iSSuEr auM (Mio. Eur) tEr<br />
tE<br />
3 yEarS<br />
tE<br />
5 yEarS<br />
1189343 lyxor 4'219 0,25% 0,16% 0,14%<br />
1272980 uBs 604 0,35% 0,31% 0,28%<br />
auM = assets under Management, TEr = Total Expense ratio, TE = Tracking Error<br />
*as of 31.05.<strong>2013</strong> | source: Issuers<br />
in the underlying. Here the following applies: the greater the<br />
number of members included in the benchmark, the higher the<br />
costs for replication. In this context, direct application reaches<br />
its limits, as soon as particularly large indices are involved.<br />
Also, frequent changes in the composition of the underlying<br />
can lead to rising costs. The ETF has to replicate these accordingly<br />
with transactions. With passive investments, investors<br />
should also take into account costs which are not directly linked<br />
to the product. Initial costs are already incurred with the<br />
purchase of ETPs or Structured <strong>Products</strong>. In addition to fees for<br />
a securities account and trading, the spread is also a cost factor.<br />
This term is used for describing the difference between the bid<br />
and the ask prices of a financial product. Here the following<br />
applies: the larger the spread, the less attractive is the product<br />
is for the investor. Nonetheless, increasing competition forces<br />
issuers to offer high-quality trading (refer also to the article on<br />
"Recipes for success in trading").<br />
Free of charge is a relative term<br />
However fiercely the price war may be raging, in particular in<br />
the USA, it has not had a lasting impact on the pecking order<br />
in the ETF business. During the past year, the low cost strategy<br />
has only really paid off for two ETF providers; namely, Vanguard<br />
and Charles Schwab. These two issuers were able to record<br />
noticeable gains in their market shares or increases in the<br />
flow of their products. This is also linked to the fact that only<br />
these two investment houses have significantly reduced their<br />
internal costs. Other issuers only reduced their fees selectively
Focus<br />
or for strategic reasons. "Costs are not the secret ingredient<br />
for success in the ETF business" as stated by Deutsche Bank<br />
ETF-Research analysts. This, however, is a double-edged statement:<br />
For quite some time now, the Deutsche Bank has offered<br />
the db x-trackers EURO STOXX 50 free of charge. Indirectly,<br />
however, the Deutsche Bank, and others, has been practising<br />
cross-subsidising through other ETFs. This is legitimate and<br />
the decision to do so lies with the issuer. Yet, the db x-trackers<br />
EURO STOXX 50 ETF with assets of more than two billion euro<br />
under management do/does not top the European ranking. iShares<br />
and Lyxor hold more than twice as much capital with<br />
their ETFs on the eurozone blue chip index.<br />
Tracking error as an indicator<br />
It seems obvious that, when it comes to fees, investors do not<br />
place all their emphasis on basis points. Rather, the combination<br />
of other factors, such as the range of products on offer,<br />
liquidity in the secondary market and service in general are<br />
critical. In the end, it is important, particularly with passive<br />
products, that they represent the underlying as closely as possible.<br />
In this regard, the Tracking Error is considered as a highly<br />
valued selection criterion. This figure is equivalent to the annualised<br />
standard deviation between the daily performance of<br />
an ETF and its benchmark. The Tracking Error is influenced by<br />
a number of factors, such as administration costs, transaction<br />
costs and tradability of securities held. "The larger the Tracking<br />
Error, the worse the replication of the underlying" explains<br />
"The Total Expense Ratio is a relevant<br />
criterion for evaluating ETFs."<br />
Dominique Boehler, Head of Public Distribution <strong>Switzerland</strong>,<br />
at Comstage. However, investors should not solely rely on this<br />
criterion when deciding on a product. After all, this statistical<br />
figure can be very low, and yet, over the period of one year,<br />
the passive index fund can still lag significantly behind its<br />
benchmark. It is, therefore, advisable to also take the Tracking<br />
Difference into the equation. "It indicates the extent of the<br />
difference in yield between ETF and the underlying index over<br />
a certain period of time" explains Boehler.<br />
For better, for worse …<br />
Dividend payments, in particular, can have an influence on<br />
the Tracking Difference. The timing of these distributions to<br />
the funds is important. "How dividends are taxed also plays<br />
27 ExchangE TradEd ProducTs & IndExIng guIdE <strong>Switzerland</strong> <strong>2013</strong><br />
Short SuMMary:<br />
total Expense ratio (tEr)<br />
The total cost ratio of ETFs includes administration costs and<br />
operating costs, as well as expenses for fulfilling legal requirements.<br />
The issuers fix the TEr on an annual basis, but deduct<br />
it regularly from the fund’s assets.<br />
bid-ask spread (Spread)<br />
The spread represents the difference between the bid and the<br />
ask prices of an ETF. competition increasingly forces market<br />
makers to set margins as narrow as possible. however, in<br />
most cases, this does not apply to Exotic Markets. In general,<br />
the following applies: the spread reflects the quality of the<br />
market making.<br />
tracking Error<br />
This figure states the standard deviation of the daily yield<br />
difference between the ETF and the replicated index. a low<br />
Tracking Error, however, does not necessarily mean that the<br />
passive fund is following its benchmark particularly closely.<br />
Physical replication<br />
When using the full replication approach, the exchange traded<br />
fund (ETF) buys all securities (shares) of the underlying index.<br />
This approach, also known as full replication, works well when<br />
used for blue chip indices with a smaller number of index<br />
constituents. When it comes to small-caps and mid-caps, this<br />
method becomes difficult and costly.<br />
optimised replication<br />
ETFs using an optimised replication method invest in a representative<br />
sample of index constituents. This technique uses<br />
quantitative models (optimised sampling vs. representative<br />
sampling). The tracking error differs here according to the<br />
model’s individual quality.<br />
Synthetic replication<br />
This method is implemented using derivatives. hence, the<br />
ETF invests in a broad, diversified basket of securities that<br />
may vary dramatically with regard to the underlying index.<br />
additionally, the ETF enters into a swap deal with a bank. By<br />
doing this, the ETF exchanges the performance of the fund<br />
(basket) vs. the return from the reference index. While using<br />
synthetic replication, the tracking error of the ETF is (theoretically)<br />
the smallest compared to the other methods.
Focus<br />
an important part" explains the Comstage expert. The type of<br />
replication of an ETF can also make a difference. The issuer<br />
Source focusses on the synthetic approach. "Using derivatives<br />
reduces the deviation difference to the index significantly" as<br />
"Irrespective of individual investment<br />
strategies, considering the Tracking<br />
Efficiency over different periods of time<br />
is advisable."<br />
Mark Vallon explains. By the way, the Tracking Difference<br />
can also be positive. Income stemming from the passive index<br />
fund can lead to an outperformance in relation to the benchmark;<br />
in particular, inflows from securities lending, as well as<br />
Advertisement<br />
Looking for<br />
ETF expertise?<br />
(Look no further)<br />
28 ExchangE TradEd ProducTs & IndExIng guIdE <strong>Switzerland</strong> <strong>2013</strong><br />
charges for swaps and collaterals. Physically reproduced ETFs<br />
pass on positions held by them to a counterparty for a certain<br />
contribution. All in all, it depends on the strategic emphasis of<br />
the individual investor, to which degree a certain cost factor<br />
influences the product selection. "For investors with a longterm<br />
outlook, the TER is important, as it constantly reduces the<br />
performance" states ETF expert Doerr of Vanguard. Investors<br />
with short-term investment goals, however, would place more<br />
emphasis on the spread. Irrespective of individual investment<br />
strategies, considering the Tracking Efficiency over different<br />
periods of time is advisable. There is one thing for sure that<br />
all the different figures cannot take away from investors: it is<br />
down to the investor to decide on the right index in order to<br />
invest the capital profitably. <br />
Vanguard funds and ETFs offer:<br />
• Low ongoing charges for ETFs ranging from 0.09% to 0.45%<br />
• Straightforward physical replication<br />
• Tight tracking strategies<br />
Straightforward. It’s the Vanguard Way. <br />
Institutional investors:<br />
Call us on 044 220 13 00<br />
or visit us at vanguard.ch/etfs<br />
Private investors:<br />
Please contact your<br />
relationship manager.<br />
The material contained in this document is not to be regarded as an offer to buy or sell or the solicitation of any offer to buy or sell securities in any jurisdiction where such an offer or solicitation is against the law, or to anyone to whom it is unlawful to make such an offer or<br />
solicitation, or if the person making the offer or solicitation is not qualified to do so. The information in this document does not constitute legal, tax, or investment advice. You must not, therefore, rely on the content of this document when making any investment decisions.<br />
The value of investments and the income from them may raise or fall and investors may get back less than they invested. Issued by Vanguard Investments <strong>Switzerland</strong> GmbH. © <strong>2013</strong> Vanguard Investments <strong>Switzerland</strong> GmbH. All rights reserved.
InTErVIEW<br />
"Passive investment products<br />
complement one another in<br />
an unrivalled way."<br />
Christian reuss, cEo scoach, Executive Board<br />
Member of sIx swiss <strong>Exchange</strong>, discusses new<br />
liberties, advantages for investors using the<br />
sIx swiss <strong>Exchange</strong> for execution and topics<br />
regarding the segment of "Passive Investment<br />
<strong>Products</strong>".<br />
danIEl MansEr<br />
Christian, to date it has been a ground-breaking year<br />
for Scoach <strong>Switzerland</strong>: The joint venture with the<br />
German Stock <strong>Exchange</strong> is now a thing of the past.<br />
Has this turn of events provided new scope?<br />
Yes, in some ways I would agree. We have gained numerous<br />
new corporate liberties, from which our members have benefitted<br />
in the form of substantial reductions in fees. In future,<br />
we shall continue to strengthen the focus on the needs of our<br />
Swiss unit-holders.<br />
How is the buy-side affected by these changes?<br />
By instigating a more financially attractive sellside, we are of<br />
course hopeful of indirectly achieving a more attractive range<br />
of <strong>Products</strong>. Furthermore, with the implementation of XBTR,<br />
we are able to provide professional services for optimisation<br />
within the complete value-added chain – the initial feedback<br />
has been very positive, particularly from the buyside.<br />
29 ExchangE TradEd ProducTs & IndExIng guIdE <strong>Switzerland</strong> <strong>2013</strong><br />
Delta One Trackers, a major focus in this yearbook,<br />
are responsible for roughly 40% of Scoach’s trading<br />
volume. Alternatively, ETFs in the form of a UCITfund<br />
offer similar exposure. What are the arguments<br />
for and against?<br />
In general, Structured <strong>Products</strong> are flexible forms of investment,<br />
which are quickly and easily implemented. To suit individual<br />
requirements, they can be either secured or unsecured.<br />
Practically, any maturity or payoff structure is possible. ETFs,<br />
on the other hand, are separate assets with low management<br />
fees. In contrast, they often include several market makers.<br />
In principle, both <strong>Products</strong> are part of the world of passive<br />
investment products. They complement each other more than<br />
they compete with each other.<br />
The quick implementation of investment ideas<br />
through Tracker Certificates is a good point. How<br />
long does the approval process take for Delta One<br />
<strong>Products</strong>?<br />
Approval can be achieved in a matter of minutes with Structured<br />
<strong>Products</strong>. In contrast, due to their separate asset status,<br />
approval of ETFs can require several months.<br />
There are non-regulated alternatives to exchange<br />
trading; for example, in the OTC segment. From an<br />
investor’s point of view, what are the main arguments<br />
in favour of trading on Scoach?<br />
… transparency, binding quotes, impartial and proactive market<br />
analysis, certainty in delivery, better search tools …<br />
…but, OTC trading incurs no exchange fees?<br />
(smiling) … and sometimes, however, investors are later confronted<br />
with additional costs. In the absence of the advantages<br />
previously named, investors then ‘learn the hard way’.
christian reuss – has been cEo at<br />
scoach schweiz since July <strong>2013</strong> and is<br />
Executive Board Member of sIx swiss<br />
<strong>Exchange</strong>. christian has more than 10<br />
years experience in Banking & Finance.<br />
he worked for goldman sachs for over<br />
seven years reaching Executive director<br />
in the Private Investor <strong>Products</strong> group<br />
(PIPg), with responsibility for the European<br />
sector. In addition, christian took up the<br />
position of Board Member of the swiss<br />
Futures & options association (sFoa) in<br />
september 2009. after studying Business<br />
administration at the Johann Wolfgang<br />
goethe university in Frankfurt, he obtained<br />
an MBa at the henry B. Tippie school of<br />
Management/university of Iowa. as well,<br />
christian is a cFa charterholder. he is 38,<br />
married, with two daughters.<br />
In the context of tracker certificates, what are<br />
current investment trends and which underlyings<br />
are most popular?<br />
Tracker certificates differ from ETFs in that they offer quickly<br />
implementable and competitively priced investment in (sub)<br />
markets/industries and special themes, which ETFs either cannot<br />
offer, or at least not sensibly. Accordingly, in the recent<br />
past, examples of popular investments have been share/bond<br />
baskets on emerging market countries and trackers on single<br />
or a multitude of commodities.<br />
30 ExchangE TradEd ProducTs & IndExIng guIdE <strong>Switzerland</strong> <strong>2013</strong><br />
"With OTC trading, investors sometimes<br />
have to‚ learn the hard way’."<br />
For the investor, products on offer are not clearly<br />
differentiated. <strong>Products</strong> are purchased on the back<br />
of promised performance. Is it not time to establish a<br />
new comprehesive segment on the SIX for "exchange<br />
traded products", i.e. Scoach, ETFs and ETPs in one?<br />
In principle, I cannot agree more with you. In the past few years,<br />
many issuers have taken this course of action within their company<br />
structures. It would make good sense, as a stock exchange,<br />
to carry this idea through in order to provide added value for all<br />
market players. Many thanks!
Focus<br />
<strong>Indexing</strong>, from an investor's point<br />
of view: knowing what is important<br />
Especially in long-term investing, the choice<br />
of index is decisive. What investors should pay<br />
attention to and what is important in indexing.<br />
31 ExchangE TradEd ProducTs & IndExIng guIdE <strong>Switzerland</strong> <strong>2013</strong><br />
www.fotolia.com<br />
hans Jörg MoraTh and MarTIn raaB<br />
When investing in passive financial products, many investors<br />
put the cart before the horse. For the investor, more important<br />
than the question of the best exchange traded fund (ETF),<br />
filtered for instance according to tracking error, fees and replication<br />
method, should be the question of the best index. The<br />
index should most accurately represent the market that the<br />
investor would like to invest in. Large index providers such<br />
as MSCI Barra, STOXX, the NYSE, Dow Jones and a few others<br />
offer many indices for asset classes such as stocks, bonds, raw<br />
materials, currencies and alternative investments, which, as<br />
is well known, are the basis of traditional ETFs. Among the<br />
multiplicity of indices on offer, there are, however, conceptual<br />
differences that one should definitely know about, as an<br />
investor. Ultimately, that background knowledge also helps<br />
in recognising potential "performance tricks" that the index<br />
providers and issuers might come up with.
Focus<br />
Price return vs. total return<br />
Critical for the performance calculation of stock indices are<br />
dividends issued. In a price return index (or a price index), dividends<br />
of that kind are not taken into account. For performance,<br />
only the price development of the stocks contained in the index<br />
counts. In contrast, in a total return index, dividends paid<br />
out are also calculated, in addition to how the price develops<br />
(usually, at the closing price on the date when the dividend<br />
is paid out). While doing that, a differentiation is made as to<br />
whether a net dividend (after deduction of tax at the source<br />
location) was used or not. If that is the case, then it is a net total<br />
return index. The performance of a total return index will thus<br />
be better than the performance of a price return index. Share<br />
classes of a stock ETF that distributes and reinvests behave<br />
similarly to that: for reinvesting share classes, dividends are<br />
reinvested, whereas distributing share classes pass on the dividends<br />
to share owners.<br />
"There is a lot more out there than just<br />
price indices and total return indices."<br />
Capitalisation-weighted indices<br />
Index weighting using market capitalisation has established<br />
itself as a common method since the S&P500 was founded in<br />
1957 as the first index of its kind. Enterprises with a larger market<br />
capitalisation (i.e. based on the shares in circulation x share<br />
price per stock) receive a higher weight in the index. What is<br />
important in that is the differentiation of whether the calculation<br />
of market capitalisation occurs based on the number of<br />
shares issued or the number of freely tradable shares. Usually,<br />
the second variant is selected, and that is also called a free float<br />
version. Further well-known examples of these index categories<br />
are the SMI, DAX and the EURO STOXX 50.<br />
The curse of size<br />
Proponents of this method like the high degree of representativeness<br />
of the market that it is based on. According to information<br />
provided by the SIX Swiss <strong>Exchange</strong>, the Swiss Market<br />
Index (SMI) for example, with exactly 20 stocks, represents<br />
about 85% of the total capitalisation of the Swiss stock market<br />
(free-float adjusted). For the Swiss Performance Index (SPI),<br />
which is also offered by the SIX Swiss <strong>Exchange</strong>, the total capitalisation<br />
is almost 100%. This index contains stock of almost<br />
all companies located in <strong>Switzerland</strong> and Liechtenstein and<br />
is thus correctly called the Total Market Index for the Swiss<br />
32 ExchangE TradEd ProducTs & IndExIng guIdE <strong>Switzerland</strong> <strong>2013</strong><br />
EXtrEME EXaMPLE: trio doMinatES indEX<br />
SMI-Emphasis<br />
1%<br />
2% 2%<br />
3%<br />
4%<br />
1%<br />
1% 1%<br />
1% 1%<br />
2% 1%<br />
4%<br />
4%<br />
5%<br />
5%<br />
6%<br />
Nestlé<br />
Novartis<br />
Roche Holding<br />
UBS<br />
ABB<br />
Richemont<br />
Credit Suisse Group<br />
Zurich Insurance Group<br />
Syngenta<br />
Swiss Re<br />
source: sIx swiss <strong>Exchange</strong>, etfinfo.com<br />
Transocean<br />
The Swatch Group<br />
Holcim<br />
SGS<br />
Swisscom<br />
Geberit AG<br />
Givaudan<br />
Julius Baer Group<br />
Adecco<br />
Actelion<br />
stock market, by the Swiss exchange. Critics of capitalisationweighted<br />
indices criticize the strong influence of individual<br />
large corporations and corporate groups, which is due to the<br />
large market capitalisation that they represent. For example,<br />
the weighting of the three biggest stocks in the SMI (Nestlé,<br />
Novartis and Roche) on 06.28.<strong>2013</strong> was approximately 58%.<br />
It is thus obvious that price movements of those stocks could<br />
considerably influence the value of the index as a whole.<br />
"For equal weighted indices, it makes<br />
sense to take a particularly close look."<br />
Price-weighted indices<br />
With price-weighted indices, as the name indicates, the weighting<br />
of the index is dependent on the price level. The weighting<br />
of an individual stock corresponds to its relationship to the<br />
overall total of the prices of all other index components. To<br />
illustrate this: Assuming that an index consists of two shares:<br />
Share 1 with a value of 10.- CHF and Share 2 with a value of<br />
90.- CHF. Share 1 thus receives a weighting of 10% (10.- /100.-)<br />
18%<br />
21%<br />
} 58%<br />
19%
Focus<br />
and Share 2 a weighting of 90% (90.- /100.-). Stock splits are<br />
problematic in this weighting method, for example. They lead<br />
to a situation in which the weighting of the affected stocks<br />
sinks in the index, although nothing fundamental has changed<br />
in the condition of the company in question. The probably<br />
most prominent examples of this category are the Dow Jones<br />
Industrial Average and the Nikkei 225.<br />
Equal weighted indices<br />
For equal weighted indices, each stock is represented with<br />
the same weight, i.e. the market capitalisation of the specific<br />
stock does not play a role there. As an illustration: The<br />
S&P500 Equal Weight Index contains the same 500 stocks as<br />
the S&P500, but they go into the index performance with a<br />
weighting of 0.2% (100%/500 stocks). Smaller companies thus<br />
have as much weight in it as the larger corporations. As an<br />
example: Due to their high market capitalisation, ExxonMobil<br />
"Each weighting method has its<br />
strengths and weaknesses." Fundamental weighted indices<br />
and Apple together had a total weight of 5.41% in the S&P500<br />
on 06.28.<strong>2013</strong>, whereas they would have received a weighting<br />
in the S&P500 Equal Weight index of only 0.4%, combined. The<br />
advantage that proponents speak of here is clear: A few individual<br />
stocks by themselves are not able to massively influence<br />
the performance of the overall index. However, that applies<br />
to positive as well as to negative performance. In addition, for<br />
these index categories for representative ETFs, higher costs for<br />
rebalancing result, because this must occur dependent on the<br />
price movement in order to again maintain the same weighting.<br />
This weighting method shifts the balance from large caps<br />
(stocks with a high market capitalisation) to small and mid<br />
caps (stocks with small and medium market capitalisation).<br />
That means that, depending on the market phase, either the<br />
capitalisation weighted indices or the equal weighted indices<br />
will have better performance. If one compares the performance<br />
of an ETF on the S&P500 with the performance of an ETF on<br />
the S&P500 Equal Weight Index from the same ETF issuer,<br />
one can see that the equal weight version performed better<br />
in the prior twelve months than the market-weighted version.<br />
However, if one looks at a different period of time, for example<br />
the year 2012, it becomes clear that there can be market phases<br />
in which the weighting provides better performance based on<br />
market capitalisation.<br />
33 ExchangE TradEd ProducTs & IndExIng guIdE <strong>Switzerland</strong> <strong>2013</strong><br />
PriCE indEX VS. EquaL wEight indEX<br />
db x-trackers S&P<br />
500 uCitS Etf<br />
(lu0490618542)<br />
db x-trackers S&P<br />
500 Equal weight<br />
uCitS Etf<br />
(lu0659579493)<br />
1 Month 3 MonthS 6 MonthS 12 MonthS<br />
-1,40% 2,73% 13,48% 19,88%<br />
-1,14% 3,08% 15,79% 25,50%<br />
development of value (Total return naV) on 06.28.<strong>2013</strong> | source: etfinfo.com<br />
Along with the previously mentioned weighting methods, there<br />
are other approaches in which an attempt is made to remove<br />
the weaknesses of the previously described index types. Included<br />
in those are fundamental weighted indices, for example the<br />
RAFI (Research Affiliates Fundamental Index) series, which is<br />
offered in collaboration between the FTSE and Research Affiliates.<br />
These index series carry out weighting based on fundamental<br />
factors such as the dividends issued, cash-flows and sales in<br />
the prior five business years, as well as current book values.<br />
Background knowledge will help decide<br />
Each weighting method has its strengths and weaknesses, but<br />
there is no common dominant method of stock weighting, in<br />
terms of performance. The philosophy of the individual investor<br />
is also too specific for there to be one. It is particularly<br />
institutional players who use and prefer special approaches<br />
in asset allocation. Back-testing is just one option for testing<br />
the specific use of the indexing method. Every investor should<br />
choose the relevant index or ETF that best represents the market<br />
in which he or she wants to invest. For that, a certain background<br />
knowledge is essential. As good rule of thumb is: Know<br />
the characteristics of the index that is being used as a basis<br />
just as well as the characteristics of the ETF itself. In that way,<br />
the first step for a successful investment in passive financial<br />
products will already have been mastered.
adVErTorIal<br />
The solid bridge<br />
What investors should bear in mind when investing<br />
in today’s market.<br />
rochus aPPErT, hEad oF InTErMEdIarY BusInEss sWITZErland, sTaTE<br />
sTrEET gloBal adVIsors<br />
The Federal Reserve System (Fed) has three key objectives<br />
for its monetary policy: ‘Full’ employment, stable prices, and<br />
moderate long-term interest rates. The policies adopted to meet<br />
these goals will usually have a major bearing on the most<br />
appropriate investment styles in developed markets and they<br />
do have a significant impact on emerging markets. Particularly<br />
the policy shifts announced by the Fed Chairman are critical<br />
for investors as they represent a material macro-economic<br />
change creating new investment themes.<br />
The Fed moves the markets<br />
Examples therefore are Paul Volcker’s taming of inflation that<br />
led to a golden period for government bonds between 1981<br />
and 1986. Also, the famous period from 1987-2006 was underpinned<br />
by the 'Greenspan put', in which then Alan Greenspan<br />
tended to cut interest rates in response to equity market<br />
declines. Recently, the current Fed Chairman Ben Bernanke<br />
implemented a loose and very unorthodox monetary policy<br />
injecting liquidity into the US financial system to avoid a detrimental<br />
stress scenario.<br />
ECB, SNB adopted unorthodox methods<br />
Not only Ben Bernanke but also Mario Draghi needed to deploy<br />
at several incarnations the same instrument for Europe. Even<br />
<strong>Switzerland</strong> was forced to defend its currency to protect the<br />
export oriented industrial base thereby creating on its Swiss<br />
National Bank’s balance sheet an asset of CHF 519 bn of which<br />
CHF 446 bn are foreign currency reserves (March <strong>2013</strong>). This<br />
amount represents approximately 73% of the Swiss gross<br />
domestic product.<br />
Totally new world<br />
The massive provision of liquidity to the economies of the<br />
developed world and the record low interest rates have under-<br />
34 ExchangE TradEd ProducTs & IndExIng guIdE <strong>Switzerland</strong> <strong>2013</strong><br />
pinned gains in equities, despite clear signs of sub-par growth<br />
and economic disappointment, while on the bond side it has<br />
supported the exceptional risk adjusted performance of credit<br />
and carry trades since 2009. The asset management industry<br />
finds itself in a totally new world; equity prices post 2008<br />
mainly reflect the expansion of the monetary base - not significant<br />
top line growth.<br />
Quality i.e. Value and constant Yield<br />
When a river with steady flows becomes a raging torrent it is<br />
obvious that anyone would only use a high quality bridge to<br />
cross it. Bernanke’s necessary flooding the market policy to<br />
buy time to repair balance sheets and turn around economies<br />
had investors and asset managers create the value and yield<br />
investment theme. Companies that represented both good<br />
value for money and solid, constant annual cash flows were<br />
being considered the 'highest quality bridges'. Asset managers<br />
launching investment products (ETFs/ETPs) expressing the<br />
value and yield theme have experienced an enormous inflow<br />
into their products.<br />
Advent of a new investment theme?<br />
As central banks have continued to flood markets with liquidity<br />
during H1 <strong>2013</strong>, investors are finding it harder and<br />
harder to find assets providing yield. Negative real yields on<br />
safer sovereign debt make this asset class unattractive; even<br />
Spanish and Italian yields are back to 2011 levels. In June,<br />
however, financial markets have been buffeted by liquidity<br />
worries: tapering talk from the Fed, a possible credit crunch<br />
in China and constraints on the ECB. Liquidity removal has<br />
become the watch word for financial markets and the Fed is<br />
again at the forefront of a likely change. Should the liquidity<br />
support be removed, it is likely that those assets with the best<br />
fundamentals, i.e. good value and cash flow offer relative safe<br />
harbor. The key question for investors to ask is if the Fed is<br />
announcing a change to its policy will this be the advent of a<br />
new investment theme? Or although the raging river is said to<br />
calm down, do prudent investors change their behavior upon<br />
announcement or upon real time observation of a calming, yet<br />
still raging river?
InTErvIEw<br />
"we’re well on track to ensure that<br />
the success story continues."<br />
Alain Picard, head of Product Management,<br />
sIx swiss <strong>Exchange</strong>, discusses rapid<br />
growth, the investor spectrum, new product<br />
trends and vegetarian butchers.<br />
MarTIn raaB<br />
Alain, SIX Swiss <strong>Exchange</strong> lauched an ETF segment in<br />
September 2000, being one of the first exchanges in<br />
Europe to do so. Can you recall how it all began?<br />
Yes indeed, I remember it well. When I joined the Swiss stock<br />
exchange in the middle of 2001, there were only three ETFs listed.<br />
Despite early laurels from the USA, ETFs were in their infancy<br />
here and it was uncertain just how they would develop.<br />
At a very early stage, we were able to offer an excellent range<br />
of unique selling points, such as, multi-currency capability.<br />
Today, more than 900 ETFs are listed on the SIX<br />
Swiss <strong>Exchange</strong> providing billions in turnover. How<br />
do you see the future for the ETF segment?<br />
We’re well on track to ensure that the success story continues.<br />
With over CHF 50 billion in sales during the first six<br />
months of this year, we are 30% over the corresponding period<br />
of last year. Consolidation may take place in the short<br />
term, but overall, I am optimistic about the future. We predict<br />
strong growth potential for ETFs, for example, in the private<br />
investment sector.<br />
35 ExchangE TradEd ProducTs & IndExIng guIdE <strong>Switzerland</strong> <strong>2013</strong><br />
Presently, there are numerous ETF exchanges in<br />
Europe. What are the arguments in favour of trading<br />
on SIX Swiss <strong>Exchange</strong>?<br />
… in particular, our multi-currency capability. Since as early<br />
as 2004, it has been possible to trade in their base currency,<br />
as well as in CHF. We are the only exchange offering over<br />
300 products. These include special ETFs for precious metals,<br />
which have been popular for many years.<br />
In terms of numbers of investors in ETFs, is there<br />
a clear trend within or a relationship between the<br />
institutional and the private sectors?<br />
At present, the majority of investment in ETFs is made by small<br />
to medium-sized institutional investors, independent asset<br />
managers and private banks. In future, we expect increased<br />
activity from private investors.<br />
From which geographical area are the majority<br />
of the orders placed for ETFs and what role does<br />
the french-speaking part of <strong>Switzerland</strong> play?<br />
Fundamentally, the ETF business has a broad international<br />
base, as market makers are engaged throughout Europe. In the<br />
majority of cases, however, the investors and their assets are<br />
to be found in <strong>Switzerland</strong>. As such, commissions are made by<br />
local major banks and private banks, without any particular<br />
focus on regional bias.<br />
Now let’s turn our attention to the <strong>Products</strong><br />
themselves. In which direction will ETFs develop?<br />
New markets should be tapped or covered more comprehensively;<br />
for example the "frontier markets". There should be a<br />
move to "actively managed ETFs"; particularly, in the fixed<br />
income sector. As well, there is the need for future-oriented<br />
concepts, which address portfolio strategies. Physically-backed<br />
metals and commodities also have potential. Parallel to these
alain Picard joined sIx swiss <strong>Exchange</strong> as<br />
product manager in 2001, following many<br />
years in banking. In recent years, alain has<br />
played a defining role in the development<br />
and marketing of the ETF segment, as well<br />
as maintaining relationships with product<br />
issuers and market makers. Furthermore,<br />
he was responsible for the introduction of<br />
new financial product segments, such as<br />
"ETPs" in 2010 and "sponsored Funds" in<br />
<strong>2013</strong>. since 2011, alain has headed up the<br />
product management of all trading seg-<br />
ments, as well as the vocational training of<br />
traders. he holds a Bachelor of Business<br />
administration, as well as a Masters of<br />
advanced studies (Mas) in Private Ban-<br />
king & Wealth Management; both of which<br />
were obtained from swiss universities of<br />
applied science. alain is co-author of the<br />
ETF guide, which was published in 2010<br />
by sIx swiss <strong>Exchange</strong> and Finanz und<br />
Wirtschaft. In addition, he is a member of<br />
the ETF Expert committee of the swiss<br />
Funds association.<br />
developments, innovations in the so-called "intelligent indices",<br />
also known as smart beta, should continue to evolve.<br />
Is it not true that, in some instances, smart beta<br />
is now being misused as a marketing gimmick?<br />
For professional investors, smart beta is certainly an interesting<br />
concept. Of course, not all asset-weighted indices are,<br />
in reality, "intelligent". I believe that innovative products serve<br />
the market very well in any case. Time will tell whether or<br />
not they are successful in establishing a place in the market.<br />
Are price wars between certain companies offering<br />
ETFs advantageous to investors, or in the end, is<br />
this just cross-subsidisation of flagship products?<br />
Fees are a pivotal decision-making criterion. In this regard,<br />
ETFs have a proven track record. The question can be posed<br />
whether or not, in the long term, a difference in price<br />
of say 5 basis points for management fees will make a difference.<br />
When contemplating ETFs, one should also consider<br />
other attributes of the products, such as accurateness of<br />
the index reproduction and the fees associated with the<br />
buying and selling.<br />
36 ExchangE TradEd ProducTs & IndExIng guIdE <strong>Switzerland</strong> <strong>2013</strong><br />
Which projects are to be undertaken in<br />
the ETF segment of the SIX Swiss <strong>Exchange</strong><br />
in the near future?<br />
We wish to continue to engage additional market makers for<br />
each ETF. This improves the spreads, which is an important<br />
component in the determination of fees; thus, achieving a<br />
positive effect for investors. As well, we wish to increase<br />
general public awareness of ETFs. As such, we support an<br />
independent initiative, which is aimed at private investors;<br />
namely, the ETF ambassadors.<br />
Do you have investments in ETFs in your<br />
personal portfolio?<br />
Of course I do. Otherwise, it would be rather paradox or, to<br />
use an in vogue colloquialism, I would feel like ‘a bit of a<br />
vegetarian butcher’. As a small investor with a need for high<br />
levels of security, ETFs make a lot of sense. I have a large<br />
range of products from which to choose. With little fuss, I am<br />
able to economically create a diversified portfolio, which can<br />
be easily restructured at any time. <br />
Many thanks!<br />
"For professional investors, smart beta<br />
is certainly an interesting concept."
IssuEr<br />
Commerzbank is one of the leading issuers of structured investment<br />
products and leveraged products in Europe. Thanks to its<br />
long standing reputation of excellence and experience in it’s<br />
field, Commerzbank has become a structured products house of<br />
first choice. 2009 Commerzbank decided to ramp up its activities<br />
in the Swiss market by establishing<br />
an on-site specialised team in Zurich.<br />
Hence our clients now benefit from the<br />
geographical proximity, experience and<br />
innovative capacity of a global player<br />
witch focuses on the retail market. In<br />
<strong>Switzerland</strong> our success is mainly built around Faktor Certificates.<br />
Faktor Certificates are volatility neutral leveraged products<br />
with a constant daily leveraged and an open maturity. Due<br />
to their simplicity and transparency Faktor Certificates received<br />
an award by the Swiss Derivatives Awards. Due to the nearly<br />
500 listed Faktor Certificates, Investors in <strong>Switzerland</strong> have the<br />
possibility to efficiently position themselves with a long or short<br />
leveraged position on a vast amount of asset classes. The palette<br />
ranges from Swiss blue chips and mid caps, to European and US<br />
stocks through to a whole range of commodities and interest rate<br />
based underlyings. Niche markets, such as volatility (VIX and<br />
VSTOXX) and foreign exchange are also covered with a selected<br />
few products. Each underlying is equipped with a long and short<br />
version and various fixed leverages. Faktor Certificates are the<br />
most efficient leveraged products for a short term leveraged<br />
engagement in the market. In addition to providing one of the<br />
largest palettes of ETFs in <strong>Switzerland</strong>, Commerzbank acts as the<br />
largest designated sponsor for ETFs on the SIX Swiss <strong>Exchange</strong>.<br />
37 ExchangE TradEd ProducTs & IndExIng guIdE <strong>Switzerland</strong> <strong>2013</strong><br />
"In <strong>Switzerland</strong> our success<br />
is mainly built around<br />
Faktor Certificates."<br />
For nearly every second ETF listed on the Swiss <strong>Exchange</strong> Commerzbank<br />
provides liquidity to investors. Knowledge transfer is<br />
spelt with a capital "K" at Commerzbank. We rate this aspect of<br />
our service as being salient. Thus, in addition to various research<br />
papers, our much appreciated monthly magazine "ideas" enables<br />
us to inform our clients about the latest<br />
capital market developments and raise<br />
their attention to a specific interesting<br />
theme or occurrences which we deem as<br />
relevant information for structured products<br />
and ETF investors. We believe the<br />
deliverance of this free of charge service should be an integral<br />
part of services provided by retail specialists. <br />
addrESS<br />
commerzbank ag<br />
utoquai 55 | 8034 Zürich<br />
LiStEd CErtifiCatES* 514, therefrom 458 Faktor-certificates<br />
LiStEd Etf*<br />
93, each listed in chF and the respective<br />
fund currency<br />
PhonE nuMbEr 0800 11 77 11<br />
wEbSitE<br />
www.zertifikate.commerzbank.com<br />
www.comstage-etf.ch<br />
E-MaiL derivatives.swiss@commerzbank.com<br />
ContaCt PErSonS<br />
Marc Pribram, dominique Böhler and<br />
andreas stocker<br />
*as at 31.12.2012
IssuEr<br />
ETF Securities Committed to commodities.<br />
It is becoming increasingly important for investors to consider<br />
strategies that are different from traditional asset classes and<br />
strategies. For nearly a decade, investors looking for alternative<br />
investment opportunities have relied on the expertise of ETF<br />
Securities. ETF Securities is the world’s largest independent<br />
provider of commodity exchange traded<br />
products (ETPs). The company listed the<br />
world's first physically-backed gold ETP<br />
in 2003 and now offers over 300 different<br />
ETPs covering a wide range of commodity,<br />
currency and equity exposures<br />
listed on major exchanges.<br />
Committed to Commodities<br />
As more investors look to diversify their holdings, asset classes<br />
and strategies that were once the preserve of the most sophisticated<br />
institutional investors are becoming more broadly understood<br />
and more widely used. Commodities often have different<br />
risk and return characteristics to traditional asset classes such<br />
as equities and bonds and can therefore play an important role<br />
in diversification. Since inception, ETF Securities has been<br />
dedicated to making commodities more accessible to investors.<br />
What began with listing the world’s first exchange-traded gold<br />
product on a stock exchange, has led in part to the emergence<br />
of a global <strong>Exchange</strong> <strong>Traded</strong> Commodities market.<br />
Committed to our Investors<br />
Within 10 years, the business has grown organically, from<br />
a promising start-up to one of the leading independent ETP<br />
38 ExchangE TradEd ProducTs & IndExIng guIdE <strong>Switzerland</strong> <strong>2013</strong><br />
"The world’s largest<br />
independent provider of<br />
commodity ETPs ."<br />
providers. ETF Securities currently manages approximately<br />
US$23.2 billion (June <strong>2013</strong>) in global investor assets and employs<br />
over 100 talented individuals across Europe, the Americas<br />
and the Asia Pacific region. Investor education has always<br />
been a key tenet of the company’s guiding philosophy. The<br />
company’s research team is committed<br />
to providing objective, high quality top<br />
down fundamental and quantitative<br />
research across a range of commodity<br />
markets. ETF Securities entered the<br />
Swiss market in September 2012 with<br />
a range of thematic equity ETFs. More recently, the company<br />
launched a range of 28 Swiss Franc Currency-Hedged Commodity<br />
Securities. <br />
PhonE nuMbEr +44 (0)20 7448 4330<br />
wEbSitE www.etfsecurities.com<br />
E-MaiL ETFs-switzerland@etfsecurities.com<br />
ContaCt rima haddad
IssuEr<br />
Lyxor is one of the most experienced exchange traded fund<br />
(ETF) providers. It is the third-largest ETF provider in Europe<br />
and manages assets of approximately USD 40.7bn and also<br />
holds the top position in Europe with regard to the liquidity<br />
of its ETFs. With access to 276 ETFs listed on 12 regulated<br />
exchanges worldwide, Lyxor offers in-<br />
vestors the ability to very flexibly diversifying<br />
their asset allocations over<br />
all asset classes. Stocks, bonds, money<br />
markets and raw materials.<br />
78 ETFs on the Swiss <strong>Exchange</strong><br />
To underscore Lyxor's commitment to being a quality financial<br />
product provider, the company signed on to the ETF Quality<br />
Charter in 2011. Lyxor thus meets the highest requirements in<br />
performance and tracking efficiency for each of its Lyxor ETFs.<br />
At present, 78 ETFs from Lyxor are listed on the SIX Swiss<br />
<strong>Exchange</strong>. Of those, 58 are stock ETFs that invest in developed<br />
markets, emerging markets, economic and business sectors,<br />
real estate, as well as diverse topics, styles and strategies. The<br />
17 Lyxor bond ETFs are made up of state-issued bonds and<br />
corporate bonds. There is also a money market ETF and two<br />
raw material ETFs.<br />
A subsidiary of Société Générale<br />
Lyxor Asset Management ("Lyxor") is a subsidiary of the Société<br />
Générale Group and was founded in 1998 to provide longlasting<br />
and high-caliber financial solutions and to offer a high<br />
degree of transparency, liquidity and flexibility. Lyxor, with<br />
39 ExchangE TradEd ProducTs & IndExIng guIdE <strong>Switzerland</strong> <strong>2013</strong><br />
"Lyxor ETF meets the highest<br />
requirements of performance<br />
and tracking efficiency."<br />
its more than ten years of experience and over USD 99.4bn<br />
of managed assets (as of December 31, 2012), has established<br />
itself as a global market leader in four important and growing<br />
asset segments: alternative investments, ETFs & indexing, and<br />
quantitative and structured assets.<br />
The ETF efficiency indicator<br />
Lyxor is an innovative leader in the<br />
ETF industry. The most recent result<br />
of Lyxor research is the ETF efficiency<br />
indicator, which is based on specialised<br />
expert knowledge. The indicator makes it possible to objectively<br />
compare and judge all ETFs on the same index. <br />
adrESSE<br />
lyxor ETF – société générale Zurich Branch<br />
Talacker 50 | P.o. Box 1928 | 8021 Zurich<br />
LiStEd EtfS 78 in multiple currencies<br />
tELEfon +41 (0)58 272 33 44<br />
wEbSitE www.lyxoretf.ch<br />
E-MaiL info@lyxoretf.ch<br />
ContaCt PErSon<br />
roland Fischer, head of lyxor ETF<br />
switzerland & liechtenstein<br />
(roland.fischer@sgcib.com)
IssuEr<br />
For more than 150 years, UBS has operated as a client-oriented<br />
universal bank that stands for wealth management, asset<br />
management and investment banking services at a global and<br />
regional scale. The UBS Investment Bank offers its clients a<br />
broad solution spectrum from one source. It comprises products,<br />
equities, fixed income securities, foreign exchange and precious<br />
metals, research and advisory ser-<br />
vices. Corporate and institutional clients<br />
as well as financial intermediaries and<br />
specialized wealth managers get access<br />
to the global capital markets and benefit<br />
from the innovation and expertise of one of the most important<br />
globally active companies in the industry.<br />
Our Public Distribution Team can look back on a long track<br />
record of product innovations. As an important actor in the<br />
field of structured products and as a founding member of the<br />
SSPA, we help to further develop the market and to strengthen<br />
the image of these investments. Additionally, the specially developed<br />
UBS Investor platform allows structured products to<br />
be customized. UBS Bloomberg CMCI is the benchmark that<br />
our product specialists have set on the performance among the<br />
commodity indices. Our team is a one-stop shop with global<br />
market access and trading books in all time zones. Our global<br />
presence enables us to provide our clients with competent advice<br />
and offer them first-class solutions. See www.ubs.com/<br />
keyinvest for more information on UBS investment products.<br />
Passive capital investments have been a core competence of<br />
UBS Global Asset Management for over 30 years. Overall, this<br />
40 ExchangE TradEd ProducTs & IndExIng guIdE <strong>Switzerland</strong> <strong>2013</strong><br />
"Innovative products make<br />
us the preferred partner."<br />
business unit, which also includes UBS ETFs, has assets under<br />
management amounting to CHF 152 billion (June <strong>2013</strong>). Assets<br />
under management in UBS ETFs amount to around CHF twelve<br />
billion. Thus, UBS is one of Europe's leading ETF providers and<br />
in terms of assets under management, Europe's second largest<br />
provider of physically replicated ETFs. UBS ETFs offer a broad<br />
spectrum of ETFs for all key markets and<br />
investment classes. UBS ETFs offer investors<br />
exposure to a total of 89 indices<br />
in the fields of equities, bonds, precious<br />
metals, real estate, commodities and alternative<br />
investments. UBS ETFs are listed on all of Europe's<br />
leading stock exchanges. For more information on UBS ETFs:<br />
www.ubs.com/etf. <br />
addrESS<br />
ubS Etfs<br />
ubS StruCturEd<br />
ProduCtS<br />
uBs ag<br />
P.o. Box | 8098 Zurich<br />
Tel: +41 (0)44 234 34 99<br />
ubs-etf@ubs.com<br />
www.ubs.com/etf<br />
Tel: +41 (0)44-239 76 76<br />
keyinvest@ubs.com<br />
www.ubs.com/keyinvest
ProducT TaBlEs<br />
Information about<br />
The following product tables in this guide comprise the best<br />
open-end products traded at SIX Swiss <strong>Exchange</strong> and Scoach.<br />
At the end of June, the investment spectrum included a total<br />
of 2'162 ETFs and ETPs listed on the SIX Swiss <strong>Exchange</strong> and<br />
Open-end Tracker Certificates listed on Scoach <strong>Switzerland</strong>.<br />
The tables were selected using carefully chosen criteria, arranged<br />
in descending order according to their CHF performance<br />
of the past year. Only products, which have been traded for<br />
more than one year, were considered in the selection process.<br />
In view of the high degree of complexity of the database and<br />
the combination of different data providers of all kinds, no<br />
responsibility is accepted for the accuracy of the information;<br />
although, the information provided in this guide is the best<br />
available to the authors at the time.<br />
41 ExchangE TradEd ProducTs & IndExIng guIdE <strong>Switzerland</strong> <strong>2013</strong><br />
the product tables<br />
Product names<br />
The terms used to describe ETFs and ETPs are in accordance<br />
with SIX terminologies. Tracker names are those used by<br />
Scoach <strong>Switzerland</strong>. Due to a shortage of available space, however,<br />
some product names had to be shortened.<br />
Master and price data<br />
Master data is taken from Bloomberg, SIX Swiss <strong>Exchange</strong>,<br />
Exfeed and Derivative Partners. Price data (appointed date:<br />
June 28, <strong>2013</strong>) is supplied by Bloomberg Data Service. The<br />
price on June 28, <strong>2013</strong> is equivalent to the closing value of the<br />
product in the trading currency.<br />
Performance<br />
The performance in CHF over the period of one and three years<br />
is calculated on the basis of bid prices to ensure data is objective.<br />
Should data be missing on the three-year performance,<br />
it means that the product has not yet been on the market for<br />
that length of time.<br />
Spreads<br />
Calculation of the spreads (ask price – bid price : average of<br />
ask and bid price) is made on an specific date at the end of<br />
July <strong>2013</strong>. Determining the management fees for Tracker Certificates<br />
proved to be particularly difficult due to the lack of a<br />
source providing complete data.<br />
Assets under Management<br />
«Assets under Management» are based on data provided by<br />
Bloomberg. Unfortunately, information on ETFs and ETPs is<br />
incomplete and more or less totally non-existent for Tracker<br />
Certificates.<br />
DP-Rating<br />
Rating categories awarded by Derivative Partners Media (1 to 3<br />
stars) are based on the following criteria: spread, management<br />
fee and tradability/liquidity. Amongst the Tracker Certificates,<br />
there are some, which only achieved one star. This is because<br />
they have sold out in the meantime, and regular trade no longer<br />
takes place.
ProducT TaBlEs<br />
EquitiES (aLL StratEgiES)<br />
ProduCt naME tyPE tiCKEr iSSuEr fEE P.a. SPrEad (%) auM<br />
(%)<br />
(in Mn.)<br />
42 ExchangE TradEd ProducTs & IndExIng guIdE <strong>Switzerland</strong> <strong>2013</strong><br />
CCy PriCE<br />
(in tC)<br />
PErforManCE<br />
1y (%)<br />
in Chf<br />
ToPIx Banks Index Tracker TPBnK rBs 3.08 - - chF 15.00 63.9 -<br />
rBs solar Energy Tr Index Tracker solus rBs 1.00 0.99 - usd 16.01 62.8 -56.8<br />
rBs nigeria Pr Index Tracker ngrIa rBs 1.20 4.51 - usd 50.48 62.3 22.5<br />
lyxor ETF daily leveraged sMI ETF lYslE lxr 0.40 0.28 3.64 chF 18.02 61.7 -<br />
MscI united arab Emirates Tr Index Tracker uaETr rBs 0.75 1.24 - usd 9.60 61.3 51.3<br />
rBs solar Energy Tr Index Tracker solEu rBs 1.00 1.00 - Eur 15.97 60.4 -57.0<br />
s&P supercomposite oil & gas Index Tracker sPoIr rBs 0.00 1.03 - usd 87.20 57.1 124.5<br />
db x-trackers lEVdax ® daIlY ETF xldx dB 0.35 0.55 27.68 chF 72.36 52.8 -<br />
lyxor ETF levdax ETF lYlVd lxr 0.40 0.49 207.66 Eur 55.07 52.7 -<br />
nikkei 225 Index Tracker nIKQc gs 0.00 1.10 - chF 13.65 52.5 46.0<br />
soFIx Index Tracker Bulga rBs 0.00 4.20 - Eur 22.15 50.8 13.4<br />
dJ Euro sToxx cyclical good & svs Tracker dJxcY cBK 0.00 3.58 - Eur 13.75 45.0 -<br />
ardour global alternative Energy Tracker PoWEr uBs 0.75 0.83 - chF 30.30 44.3 -<br />
ZKB MeinIndex nachhaltigkeit solar Tracker TrsolI ZKB 0.50 0.42 - chF 47'950.00 43.7 -<br />
db x-trackers s&P 500 2x lev ETF xs2l dB 0.60 0.95 35.64 chF 22.06 42.6 -<br />
ZKB MeinIndex nachhaltigkeit solar Tracker Trsolo ZKB 0.90 0.26 - chF 38.10 42.4 -<br />
Euro sToxx Insurance Pr Index (Eur) Tracker dJxIc cBK 0.00 2.02 - Eur 17.35 42.2 17.5<br />
comstage ETF cac 40 ® leverage ETF cBcacl cBK 0.30 0.58 4.14 chF 10.38 41.2 -<br />
comstage ETF cac 40 ® leverage ETF cBcacl cBK 0.30 0.59 4.14 Eur 8.44 41.1 -<br />
dJ Fin svs Titans 30 Pr Index Tracker dJFIs cBK 0.00 1.20 - usd 29.20 40.7 40.2<br />
comstage ETF sToxx ® Europe 600 auto ETF cBauTo cBK 0.25 0.66 27.68 chF 71.77 39.9 50.2<br />
comstage ETF sToxx ® Europe 600 auto ETF cBauTo cBK 0.25 0.15 27.68 Eur 58.10 39.6 50.8<br />
comstage ETF sToxx ® Europe 600 auto ETF cBIns cBK 0.25 0.75 32.95 chF 41.58 39.4 39.8<br />
comstage ETF sToxx ® Europe 600 auto ETF cBIns cBK 0.25 0.24 32.95 Eur 33.76 39.1 40.5<br />
aMundI ETF lev. MscI usa ETF cl2usd aMdI 0.35 0.24 25.77 usd 559.93 39.1 -<br />
sToxx Europe 600 Insurance nr Tracker ETIns uBs 0.00 0.52 - Eur 334.25 39.0 39.4<br />
sxI Bio & Medtech Tr Index Tracker sxBIo uBs 0.40 0.51 - chF 156.50 39.0 24.5<br />
comstage ETF EurosToxx 50 ® lev. ETF cBsx5l cBK 0.35 0.79 13.35 chF 20.21 38.9 -2.0<br />
comstage ETF EurosToxx 50 ® lev. ETF cBsx5l cBK 0.35 0.37 13.35 Eur 16.39 38.6 -1.6<br />
db x-trackers Euro sToxx 50 ® lev. ETF xEl2 dB 0.35 0.55 8.89 chF 16.50 38.2 -<br />
aMundI ETF lev. Euro sToxx 50 ETF c5l aMdI 0.30 0.21 13.48 Eur 145.78 38.2 -3.1<br />
lyxor ETF Euro sToxx 50 lev. ETF lYlVE lxr 0.40 0.44 149.96 Eur 13.59 37.9 -<br />
lPx Major Market Tr Index (Eur) Tracker lPxch rBs 1.65 0.98 - chF 61.10 37.3 44.1<br />
s&P 500 Tr Index Tracker ETFIn uBs 0.00 0.25 - usd 396.25 37.1 -<br />
lPx Major Market Tr Index (Eur) Tracker lPxus rBs 1.65 0.88 - usd 78.90 37.0 44.6<br />
ZKB MeinIndex nachhaltigkeit Wind Tracker TrWInI ZKB 0.50 0.26 - chF 58'590.00 36.1 -<br />
VT us sector rotation Tracker VZous VT 1.60 0.98 - usd 163.40 35.9 31.4<br />
comstage ETF sToxx ® Europe 600 Travel ETF cBTraV cBK 0.25 0.98 21.44 chF 34.59 35.8 44.2<br />
sxI Bio & Medtech Pr Index Tracker sBIon uBs 0.90 0.57 - chF 139.60 35.6 17.5<br />
sxI Bio & Medtech Pr Index Tracker VZsxB VT 0.40 0.57 - chF 140.00 35.6 17.3<br />
3y (%)<br />
in Chf<br />
dP-<br />
rating<br />
source: Bloomberg | sIx swiss <strong>Exchange</strong> | derivative Partners
ProducT TaBlEs<br />
EquitiES SwitzErLand<br />
ProduCt naME tyPE tiCKEr iSSuEr fEE P.a.<br />
(%)<br />
43 ExchangE TradEd ProducTs & IndExIng guIdE <strong>Switzerland</strong> <strong>2013</strong><br />
SPrEad<br />
(%)<br />
auM<br />
(in Mn.)<br />
CCy PriCE<br />
(in tC)<br />
PErforManCE<br />
1y (%)<br />
in Chf<br />
lyxor ETF daily leveraged sMI ETF lYslE lxr 0.40 0.28 3.64 chF 18.02 61.7 -<br />
sxI Bio & Medtech Tr Index Tracker sxBIo uBs 0.40 0.51 - chF 156.50 39.0 24.5<br />
sxI Bio & Medtech Pr Index Tracker sBIon uBs 0.90 0.57 - chF 139.60 35.6 17.5<br />
sxI Bio & Medtech Pr Index Tracker VZsxB VT 0.40 0.57 - chF 140.00 35.6 17.3<br />
sxI life sciences Tr Index Tracker sxlFE uBs 0.40 0.49 - chF 163.00 35.4 23.4<br />
cE corporate Quality schweiz 20 Index Tracker rZcEQ VT 0.30 0.98 - chF 122.40 33.0 34.0<br />
slI Tr Index Tracker ETslI uBs 0.00 0.71 - chF 1555.00 32.3 36.0<br />
sxI life sciences Pr Index Tracker lIFEs uBs 1.60 0.57 - chF 139.50 32.2 15.8<br />
slI Tr Index Tracker VZslI VT 1.50 0.53 - chF 151.20 31.9 34.3<br />
slI Tr Index Tracker BKBlI BKB 0.40 0.53 - chF 151.30 31.7 34.6<br />
slI Tr Index Tracker slITr uBs 0.40 0.73 - chF 151.40 31.7 34.8<br />
sMIc Index Tracker ETsMI uBs 0.00 0.52 - chF 1341.00 31.2 39.1<br />
sMIc Index Tracker BKBsM BKB 0.35 0.54 - chF 130.00 30.5 37.5<br />
sMIc Index Tracker sMIlE uBs 0.40 0.47 - chF 127.30 30.4 37.6<br />
VT swiss sector rotation Basket Tracker VZosM VT 1.60 0.97 - chF 153.90 30.3 40.3<br />
sMI Index Tracker VZoch VT 0.00 1.22 - chF 82.20 30.3 30.5<br />
ishares slI ® (ch) ETF csslI Ish 0.35 0.23 592.91 chF 121.88 29.7 29.4<br />
MscI switzerland local daily net Tr Index Tracker Mscch uBs 0.85 0.51 - chF 196.30 29.6 -<br />
BKB schweizer Blue chips strategie Bskt Tracker BsaaF BKB 0.45 0.54 - chF 110.90 29.5 16.7<br />
Powershares FTsE raFI switzerland ETF PdII Ps 0.55 0.36 3.40 chF 11.05 29.4 22.4<br />
aMundI ETF MscI sWITZErland ETF csWchF aMdI 0.25 0.49 205.65 chF 223.60 28.8 -<br />
sMI Mid Tr Index Tracker VZsMM VT 0.50 0.48 - chF 165.50 28.7 20.2<br />
slI Pr Index Tracker slIPr uBs 0.00 0.69 - chF 115.70 28.6 24.9<br />
sPI Tr Index Tracker BKsPI BKB 0.45 0.56 - chF 70.80 28.4 32.2<br />
comstage ETF sMI ® ETF cBssMI cBK 0.25 0.74 71.53 chF 85.92 28.4 33.3<br />
slI Pr Index Tracker slIcE sara 0.00 0.42 - chF 118.30 28.2 24.7<br />
uBs-ETF slI ® ETF slIcha uBs 0.35 0.13 178.14 chF 118.57 27.8 25.8<br />
db x-trackers slI ® ucITs ETF 1d ETF xslI dB 0.35 0.46 24.60 chF 118.63 27.3 25.6<br />
comstage ETF sPI ® Tr ETF cBsPI cBK 0.40 0.20 19.21 chF 70.91 27.3 -<br />
ishares sMI (dE) ETF sMIEx Ish 0.50 0.14 196.54 chF 77.09 27.3 26.2<br />
ishares sMI ® (ch) ETF cssMI Ish 0.35 0.09 3'456.74 chF 78.90 27.1 29.0<br />
sMI Index Tracker sMIdB dB 0.00 0.13 - chF 76.65 27.0 25.5<br />
sMI Index Tracker sMInI uBs 0.00 0.46 - chF 76.85 26.9 26.5<br />
uBs discount Index on the sMI Tracker sMIrB uBs 0.75 0.46 - chF 76.85 26.9 26.5<br />
sMI Index Tracker sMIIT ZKB 0.00 0.39 - chF 77.15 26.7 25.1<br />
sMI Index Tracker sMIxE sara 0.00 0.38 - chF 78.60 26.5 25.6<br />
uBs-ETF sMI ® ETF sMIcha uBs 0.35 0.12 927.65 chF 77.81 26.1 26.5<br />
db x-trackers sMI ® ucITs ETF 1d ETF xsMI dB 0.30 0.11 438.50 chF 78.53 25.8 25.7<br />
sara daxglobal substainability switzerland Tracker dachs sara 0.00 0.51 - chF 177.50 25.4 15.1<br />
VT Best of swiss Funds Index Tracker VZBos VT 0.75 1.48 - chF 101.10 25.0 26.4<br />
3y (%)<br />
in Chf<br />
dP-<br />
rating<br />
source: Bloomberg | sIx swiss <strong>Exchange</strong> | derivative Partners
ProducT TaBlEs<br />
EquitiES gErMany<br />
ProduCt naME tyPE tiCKEr iSSuEr fEE P.a.<br />
(%)<br />
44 ExchangE TradEd ProducTs & IndExIng guIdE <strong>Switzerland</strong> <strong>2013</strong><br />
SPrEad<br />
(%)<br />
auM<br />
(in Mn.)<br />
CCy PriCE<br />
(in tC)<br />
PErforManCE<br />
1y (%)<br />
in Chf<br />
db x-trackers lEVdax ® daIlY ETF xldx dB 0.35 0.55 27.68 chF 72.36 52.8 -<br />
lyxor ETF levdax ETF lYlVd lxr 0.40 0.49 207.66 Eur 55.07 52.7 -<br />
ishares Mdax (dE) ETF MdaxEx Ish 0.50 0.99 1'151.48 chF 153.43 34.3 -<br />
Tecdax Tr Index Tracker BcaBx Barc 0.00 1.27 - chF 11.85 30.9 20.4<br />
dax ® Tracker VZodx VT 0.00 2.65 - Eur 75.60 28.3 24.7<br />
dax ® Tracker BcaBJ Barc 0.00 1.11 - chF 9.87 28.2 24.6<br />
dax ® Tracker daxTr ZKB 0.00 0.31 - Eur 79.75 28.2 24.8<br />
dax ® Tracker daxdr cBK 0.00 0.25 - Eur 79.95 28.0 24.9<br />
dax ® Tracker BcaBI Barc 0.00 0.25 - Eur 8.01 27.9 24.9<br />
dax ® Tracker xETdB dB 0.00 0.00 - Eur 79.71 27.1 24.4<br />
lyxor ETF dax ETF lYdax lxr 0.15 0.08 594.03 Eur 77.57 27.0 23.4<br />
comstage ETF dax ® Tr ETF cBdax cBK 0.12 0.74 660.42 chF 97.56 26.9 23.6<br />
comstage ETF dax ® Tr ETF cBdax cBK 0.12 0.49 660.42 Eur 79.21 26.8 23.8<br />
dax ® Tracker gdaxI rBs n.a. 0.25 - Eur 7.94 26.7 25.4<br />
db x-trackers dax ® ucITs ETF 1c ETF xdax dB 0.15 0.44 7'201.58 chF 96.58 26.6 23.9<br />
dax ® Tracker ETdax uBs 0.00 0.19 - Eur 794.00 26.6 -<br />
daxglobal sarasin sustainability germany Tracker dadEs sara 0.00 1.01 - Eur 138.10 26.3 13.6<br />
comstage ETF sdax ® Tr ETF cBsdax cBK 0.70 1.40 77.33 Eur 69.81 26.1 -<br />
ishares dax (dE) ETF daxEx Ish 0.15 0.16 14'653.57 chF 87.75 26.0 -<br />
comstage ETF divdax ® Tr ETF cBddax cBK 0.25 0.25 22.45 Eur 19.74 25.1 -<br />
comstage ETF divdax ® Tr ETF cBddax cBK 0.25 1.28 22.45 chF 24.21 25.0 -<br />
daxplus Family 30-Kursindex Tracker VZdFd VT 1.20 0.52 - Eur 231.10 23.7 11.6<br />
comstage ETF Fr dax ® ETF cBFdax cBK 0.15 0.73 52.18 chF 53.40 22.5 -<br />
comstage ETF Fr dax ® ETF cBFdax cBK 0.15 0.48 52.18 Eur 43.39 22.5 -<br />
comstage ETF sdax ® Tr ETF cBsdax cBK 0.70 0.49 77.33 chF 57.17 20.6 -<br />
uBs rada net Tr Index (Eur) on dax Tracker radad uBs 1.25 0.45 - Eur 156.00 20.2 -<br />
dJ germany select div. 20 distr. Index Tracker dEdIV uBs 0.75 0.95 - Eur 31.45 19.8 -<br />
rBs alpha Index germany Tracker alFgr rBs 1.00 - - Eur 121.30 12.9 0.3<br />
Ml Market Indicator germany Index Tracker Mldax Boa 1.00 - - Eur 94.40 2.7 -6.4<br />
comstage ETF shortdax ® Tr ETF cBdaxs cBK 0.30 0.99 20.13 chF 53.48 -20.2 -<br />
comstage ETF shortdax ® Tr ETF cBdaxs cBK 0.30 0.30 20.13 Eur 43.31 -20.2 -<br />
db x-trackers shorTdax ® daIlY ETF xsdx dB 0.40 0.45 363.83 chF 50.71 -20.3 -39.9<br />
shorTdax ® Tracker daxsh rBs 0.25 0.46 - Eur 4.33 -20.6 -39.0<br />
lyxor ETF daily shortdax x2 ETF lYdsd lxr 0.60 0.18 64.10 Eur 16.75 -39.2 -<br />
db x-trackers shorTdax ® x2 daIlY ETF xsd2 dB 0.60 0.60 59.61 chF 20.17 -39.7 -<br />
3y (%)<br />
in Chf<br />
dP-<br />
rating<br />
source: Bloomberg | sIx swiss <strong>Exchange</strong> | derivative Partners
ProducT TaBlEs<br />
EquitiES wEStErn EuroPE<br />
ProduCt naME tyPE tiCKEr iSSuEr fEE P.a.<br />
(%)<br />
45 ExchangE TradEd ProducTs & IndExIng guIdE <strong>Switzerland</strong> <strong>2013</strong><br />
SPrEad<br />
(%)<br />
auM<br />
(in Mn.)<br />
CCy PriCE<br />
(in tC)<br />
PErforManCE<br />
1y (%)<br />
in Chf<br />
dJ Euro sToxx good and services Index Tracker dJxcY cBK 0.00 3.50 - Eur 13.75 45.0 -<br />
Euro sToxx Insurance Pr Index Tracker dJxIc cBK 0.00 1.87 - Eur 17.35 42.2 17.5<br />
comstage ETF cac 40 ® leverage ETF cBcacl cBK 0.30 0.60 4.11 chF 10.38 41.2 -<br />
comstage ETF cac 40 ® leverage ETF cBcacl cBK 0.30 0.64 4.11 Eur 8.44 41.1 -<br />
comstage ETF sToxx ® Europe 600 auto ETF cBauTo cBK 0.25 0.66 27.29 chF 71.77 39.9 50.2<br />
comstage ETF sToxx ® Europe 600 auto ETF cBauTo cBK 0.25 0.15 27.29 Eur 58.10 39.6 50.8<br />
comstage ETF sToxx ® Europe 600 Insur. ETF cBIns cBK 0.25 0.74 33.00 chF 41.58 39.4 39.8<br />
comstage ETF sToxx ® Europe 600 Insur. ETF cBIns cBK 0.25 0.25 33.00 Eur 33.76 39.1 40.5<br />
sToxx Europe 600 Insurance net return Tracker ETIns uBs 0.00 0.56 - Eur 334.25 39.0 39.4<br />
comstage ETF Euro sToxx 50 ® lev. ETF cBsx5l cBK 0.35 0.76 13.21 chF 20.21 38.9 -2.0<br />
comstage ETF Euro sToxx 50 ® lev. ETF cBsx5l cBK 0.35 0.44 13.21 Eur 16.39 38.6 -1.6<br />
db x-trackers Euro sToxx 50 ® lEVEragEd ETF xEl2 dB 0.35 0.76 8.78 chF 16.50 38.2 -<br />
aMundI ETF lEVEragEd Euro sToxx 50 ETF c5l aMdI 0.30 0.21 13.31 Eur 145.78 38.2 -3.1<br />
lyxor ETF Euro sToxx 50 daily leverage ETF lYlVE lxr 0.40 0.40 148.08 Eur 13.59 37.9 -<br />
comstage ETF sToxx ® Europe 600 Travel ETF cBTraV cBK 0.25 1.01 21.39 chF 34.59 35.8 44.2<br />
comstage ETF sToxx ® Europe 600 Travel ETF cBTraV cBK 0.25 0.51 21.39 Eur 28.14 35.5 44.8<br />
Euro sToxx automobiles & Parts Pr Index Tracker dJxMo cBK 0.00 0.89 - Eur 35.45 35.1 36.9<br />
solactive European good Banks Tr Index Tracker VZgBc VT 1.20 1.01 - chF 74.95 35.0 -10.6<br />
solactive European good Banks Tr Index Tracker VZgBE VT 1.20 0.98 - Eur 87.35 35.0 -10.5<br />
Euro sToxx Technology Pr Index (Eur) Tracker dJxTE cBK 0.00 1.30 - Eur 26.10 34.2 16.4<br />
sPdr ® MscI Europe Information Tech ETF sTKs sTT 0.30 0.50 9.01 chF 42.59 34.2 -<br />
aMundI ETF lEVEragEd MscI EuroPE ETF clE aMdI 0.35 0.28 6.62 Eur 493.44 34.2 33.0<br />
comstage ETF sToxx ® Europe 600 Tech ETF cBTEch cBK 0.25 0.75 33.96 chF 42.02 33.7 22.4<br />
sToxx Europe 600 Technology Tr Index Tracker ETTEc uBs 0.00 0.57 - Eur 339.50 33.4 -<br />
comstage ETF sToxx ® Europe 600 Tech ETF cBTEch cBK 0.25 0.23 33.96 Eur 34.07 33.4 23.1<br />
comstage ETF sToxx ® Europe 600 Fin svs ETF cBFIn cBK 0.25 0.89 24.48 chF 66.61 33.2 27.9<br />
ishares Euro sToxx 50 ucITs ETF ETF IEua Ish 0.35 0.15 83.00 Eur 26.30 33.1 2.0<br />
comstage ETF sToxx ® Europe 600 Fin svs ETF cBFIn cBK 0.25 0.75 24.48 Eur 54.10 32.9 28.3<br />
comstage ETF sToxx ® Europe 600 Media ETF cBTV cBK 0.25 0.90 20.14 chF 43.45 31.7 31.5<br />
comstage ETF sToxx ® Europe 600 Media ETF cBTV cBK 0.25 0.40 20.14 Eur 35.38 31.4 32.0<br />
Euro sToxx Media Pr Index Tracker dJxMa cBK 0.00 1.43 - Eur 16.45 31.1 8.3<br />
sPdr ® MscI Europe Financials ETF ETF sTZs sTT 0.30 0.49 45.54 chF 46.74 30.9 -<br />
sPdr ® MscI Europe cons. disc. ETF sTrs sTT 0.30 0.59 9.80 chF 89.60 30.5 -<br />
dJ Euro sToxx retail Index Tracker dJxaa cBK 0.00 1.12 - Eur 33.45 30.1 8.0<br />
uBs M&a Europe Investable Tr Tracker MandY uBs 1.00 1.00 - Eur 10'970.00 29.6 -<br />
uBs M&a Europe Investable Tr Tracker Manda uBs 1.25 0.96 - Eur 108.90 29.3 -<br />
comstage ETF sToxx ® Europe 600 Banks ETF cBBanK cBK 0.25 0.81 42.36 chF 40.37 28.3 -15.9<br />
comstage ETF sToxx ® Europe 600 Banks ETF cBBanK cBK 0.25 0.30 42.36 Eur 32.73 28.0 -15.5<br />
sPdr ® MscI Europe health care ETF ETF sTWs sTT 0.30 0.35 111.87 chF 107.48 28.0 -<br />
3y (%)<br />
in Chf<br />
dJ Euro sToxx non-cycl. goods Index Tracker dJxnc cBK 0.00 0.80 - Eur 48.60 28.0 30.9<br />
dP-<br />
rating<br />
source: Bloomberg | sIx swiss <strong>Exchange</strong> | derivative Partners
tiMing thE EaSy way with thE ubS rada StratEgy<br />
On the stock exchange, the crucial point is to do the right<br />
thing at the right time. The recent crises and the associated<br />
severe volatility on the financial markets have clearly shown<br />
the importance of successful timing. Every trading day, the<br />
smart UBS Risk Adjusted Dynamic Alpha (RADA) strategy<br />
does the work for the investor and decides whether to enter a<br />
iSSuEr uBs ag<br />
rada indiCES<br />
SyMboLS<br />
trading CurrEnCy Eur / usd<br />
uBs rada on Euro stoxx 50 ®<br />
uBs rada on dax ®<br />
uBs rada on s&P 500 ®<br />
uBs gEM rada strategy Index<br />
radaE (Euro stoxx 50 ® ), radad (dax ® ),<br />
radsP (s&P 500 ® ), radEM (gEM rada<br />
strategy)<br />
bEnChMarK respective reference index<br />
ManagEMEnt fEE P.a. 1.00%<br />
inforMation www.ubs.com/rada-ch<br />
LyXor Etf Euro StoXX 50<br />
Lyxor UCITS ETF Euro Stoxx 50 is an open-end UCITS compliant<br />
fund. The Fund's investment objective is to track the<br />
performance of the EURO STOXX 50 ® Net Return Index as<br />
close as possible. The index is an equity index calculated and<br />
published by Stoxx Ltd. and consists of the 50 largest European<br />
publicly-traded companies (blue-chips), which are based in<br />
fondSManagEr lyxor asset Management<br />
StruCturE synthetic replication (distributing)<br />
VaLor / SyMboL 1189343 / MsE<br />
auM 4,286 mn. Eur (as of July, 31 <strong>2013</strong>)<br />
trading CurrEnCy Eur<br />
bEnChMarK Euro sToxx 50 ® nr<br />
ManagEMEnt-fEE P.a. 0.20%<br />
inVEStor SErViCE info@lyxoretf.ch<br />
PErforManCE (1 yrS., Eur) 23.23% (as of July, 31 <strong>2013</strong>)<br />
PErforManCE (3 yrS., Eur) 13.44% p.a. (as of July, 31 <strong>2013</strong>)<br />
46 ExchangE TradEd ProducTs & IndExIng guIdE <strong>Switzerland</strong> <strong>2013</strong><br />
position on the equity market or to adopt a neutral position. In<br />
this context, the timing approach strictly adheres to the fixed<br />
rules issued by UBS Investment Bank Research. UBS PERLES<br />
Plus enables the investor to follow the respective indices and<br />
the associated strategies on a 1:1 basis. More information can<br />
be found at: www.ubs.com/rada-ch.<br />
hiStoriCaL PErfor. ubS rada daX ® indEX VS. daX ®<br />
%<br />
200<br />
180<br />
160<br />
140<br />
120<br />
100<br />
80<br />
60<br />
40<br />
20<br />
Sep. Sep. Sep. Sep. Sep. Sep. Sep.<br />
2007 2008 2009 2010 2011 2012 <strong>2013</strong><br />
DAX Index UBS RADA Net TR on DAX<br />
source: Bloomberg, uBs ag | Period: 9 oct. 2007, to 15 august <strong>2013</strong><br />
Past performance is not indicative of future performance.<br />
the Euro-zone and has become one of Europe's leading stock<br />
market indicator. The calculation method of the EURO STOXX<br />
50 ® Net Return Index is based on free float market capitalization.<br />
More details about the EURO STOXX 50 ® Net Return<br />
Index are available on the website of Stoxx Ltd.<br />
LyXor Etf Euro StoXX 50<br />
%<br />
110<br />
105<br />
100<br />
95<br />
90<br />
85<br />
80<br />
75<br />
70<br />
Jan. Jul. Jan. Jul. Jan. Jul. Jan. Jul.<br />
2010 2011 2012<br />
<strong>2013</strong><br />
Performance MSE FP Equity<br />
source: lyxor aM
ProducT TaBlEs<br />
EquitiES EaStErn EuroPE<br />
ProduCt naME tyPE tiCKEr iSSuEr fEE P.a.<br />
(%)<br />
47 ExchangE TradEd ProducTs & IndExIng guIdE <strong>Switzerland</strong> <strong>2013</strong><br />
SPrEad<br />
(%)<br />
auM<br />
(in Mn.)<br />
CCy PriCE<br />
(in tC)<br />
PErforManCE<br />
1y (%)<br />
in Chf<br />
soFIx Index Tracker Bulga rBs 0.00 1.93 - Eur 22.15 50.8 13.4<br />
rBs Market access south-East Europe ETF MsEI rBs 0.60 1.31 4.71 Eur 10.32 22.4 -14.7<br />
ljubjiana stock <strong>Exchange</strong> Tracker sloEu rBs 0.00 0.95 - Eur 6.09 17.7 -33.7<br />
oMx Baltic 10 Index Tracker oMxBa rBs 0.00 5.14 - Eur 15.85 12.8 9.4<br />
VT Best of Eastern European Funds Index Tracker VZBEE VT 0.75 1.55 - Eur 76.55 9.9 -7.0<br />
crobex Index Tracker croBx rBs 0.00 0.89 - Eur 24.08 9.1 -9.2<br />
Belex 15 Index Tracker srBIa rBs 0.00 7.78 - Eur 4.03 8.1 -35.6<br />
Bux Index Tracker BuxEu rBs 0.00 0.80 - Eur 6.30 7.6 -19.1<br />
hTl hungarian <strong>Traded</strong> Index Tracker huIdr cBK 0.00 0.28 - Eur 17.95 3.0 -23.5<br />
PTx - Polish <strong>Traded</strong> Index Tracker PlIdr cBK 0.00 0.28 - Eur 17.95 3.0 -23.5<br />
sPdr ® MscI EM Europe ucITs ETF ETF EMEo sTT 0.65 0.96 14.12 chF 17.97 2.9 -<br />
lyxor ETF Eastern Europe ETF lYcEc lxr 0.50 0.46 304.43 Eur 16.23 2.3 -14.8<br />
aMundI ETF MscI World Ex EuroPE ETF cE8usd aMdI 0.45 0.47 52.73 usd 294.09 1.8 -<br />
aMundI ETF MscI EasT. EuroPE Ex rus. ETF cE9usd aMdI 0.45 0.47 52.73 usd 294.09 1.8 -<br />
rdx russian dep. receipt Index Tracker ETrus uBs 0.00 0.43 - usd 1'738.00 1.8 -<br />
db x-trackers MscI EM EasTErn EuroPE ETF xMEE dB 0.65 0.85 3.81 chF 6.68 1.7 -<br />
uBs hungarian <strong>Traded</strong> Index Tracker hTxus uBs 0.00 4.16 - usd 35.40 0.5 -26.3<br />
rBs Market access daxglobal ® russia ETF MdrI rBs 0.65 0.55 18.76 usd 50.25 -0.5 -10.8<br />
cEcE Extended Index (Eur) Tracker cEcEY rBs 0.00 0.79 - chF 11.85 -0.8 -16.5<br />
comstage ETF MscI EM Eastern Europe Trn ETF cBMEE cBK 0.60 0.96 19.39 chF 37.26 -1.0 -8.8<br />
WIg 20 Index Tracker WIgEu rBs 0.00 0.73 - Eur 5.14 -1.4 -10.0<br />
comstage ETF MscI EM Eastern Europe Trn ETF cBMEE cBK 0.60 0.61 19.39 usd 39.45 -1.5 -8.7<br />
rdx russian dep. receipt Index Tracker rdxus rBs 0.00 0.63 - usd 1.48 -1.7 -9.8<br />
comstage ETF MscI russia 30% capped Trn ETF cBrus cBK 0.60 0.96 19.46 chF 139.89 -1.9 -8.5<br />
comstage ETF MscI russia 30% capped Trn ETF cBrus cBK 0.60 0.95 19.46 usd 147.81 -2.1 -8.7<br />
cEcE composite Index Tracker EEIdr cBK 0.00 0.31 - Eur 15.40 -2.3 -17.3<br />
ishares MscI russia adr/gdr ucITs ETF ETF csru Ish 0.52 0.44 386.26 usd 99.12 -2.5 -<br />
ishares MscI Eastern Europe capped ETF IEEr Ish 0.00 0.40 150.78 usd 25.64 -2.6 -12.3<br />
cEcE composite Index (Eur) Tracker cEEur rBs 0.00 0.92 - Eur 15.35 -2.9 -15.9<br />
uBs Polish <strong>Traded</strong> Index Tracker PTxus uBs 0.00 2.16 - usd 14.85 -3.4 -11.9<br />
lyxor ETF russia ETF lYrus lxr 0.65 0.47 609.83 usd 36.42 -3.4 -7.2<br />
cEcE composite Index Tracker cEcus uBs 0.00 2.33 - usd 19.95 -4.5 -19.4<br />
hsBc MscI russIa caPPEd ETF ETF hruB hsBc 0.60 0.71 11.14 usd 12.04 -5.5 -<br />
russian Trading system Index Tracker russl rBs 0.00 0.81 - usd 12.57 -6.3 -16.1<br />
cTl czech <strong>Traded</strong> Index Tracker cZIdr cBK 0.00 0.44 - Eur 44.80 -8.1 -33.4<br />
rTx russian <strong>Traded</strong> Index Tracker crTxI uBs 0.00 2.04 - usd 178.00 -8.8 -16.1<br />
uBs czech <strong>Traded</strong> Index Tracker cTxus uBs 0.00 2.42 - usd 15.80 -9.1 -34.6<br />
rBs ukraine Index Tracker uKraI rBs 1.00 - - chF 11.48 -20.9 -58.2<br />
dJ cyprus Titans 10 Tracker ZYPrn rBs 1.00 - - Eur 3.01 -44.3 -86.4<br />
3y (%)<br />
in Chf<br />
dP-<br />
rating<br />
source: Bloomberg | sIx swiss <strong>Exchange</strong> | derivative Partners
ProducT TaBlEs<br />
EquitiES north aMEriCa<br />
ProduCt naME tyPE tiCKEr iSSuEr fEE P.a.<br />
(%)<br />
48 ExchangE TradEd ProducTs & IndExIng guIdE <strong>Switzerland</strong> <strong>2013</strong><br />
SPrEad<br />
(%)<br />
auM<br />
(in Mn.)<br />
CCy PriCE<br />
(in tC)<br />
PErforManCE<br />
1y (%)<br />
in Chf<br />
db x-trackers s&P 500 2x lEVEragEd ETF xs2l dB 0.60 1.34 35.73 chF 22.06 42.6 -<br />
aMundI ETF lEVEragEd MscI usa ETF cl2usd aMdI 0.35 0.24 25.86 usd 559.93 39.1 -<br />
s&P 500 Tr Index Tracker ETFIn uBs 0.00 0.00 - usd 396.25 37.1 -<br />
VT us sector rotation Tracker VZous VT 1.60 0.99 - usd 163.40 35.9 31.4<br />
nYsE arca Biotechnology Pr Index Tracker aMxoE rBs 2.22 - - chF 171.30 35.5 95.0<br />
nYsE arca Biotechnology Pr Index Tracker BTKEY uBs 0.60 0.25 - usd 184.90 34.2 64.3<br />
Berkshire hathaway Inc. (a) Tracker BErKc rBs 0.00 2.01 - chF 158.60 34.2 22.9<br />
Berkshire hathaway Inc. (a) Tracker BErKu rBs 0.00 1.94 - usd 167.80 34.1 23.2<br />
nYsE arca Biotechnology Pr Index Tracker BTKoE rBs 0.00 2.01 - usd 194.95 32.9 67.5<br />
comstage ETF MscI usa Mid cap Trn ETF cBusaM cBK 0.35 0.59 41.34 chF 113.73 26.6 46.1<br />
s&P 400 Midcap Tr Index Tracker ETsPM uBs 0.00 0.38 - usd 161.20 26.4 -<br />
s&P 500/citigroup Value Tr Index Tracker ETVal uBs 0.00 0.21 - usd 3'226.00 26.2 -<br />
comstage ETF MscI usa small cap Trn ETF cBusas cBK 0.35 0.58 59.03 chF 26.41 26.2 45.9<br />
s&P homebuilder Index Tracker sPhoM rBs 0.00 1.99 - usd 45.45 25.8 77.3<br />
comstage ETF MscI usa Mid cap Trn ETF cBusaM cBK 0.35 0.50 41.34 usd 121.38 25.8 46.1<br />
db x-trackers russEll MIdcaP ETF xMKr dB 0.35 0.83 73.67 chF 12.70 25.2 -<br />
ishares listed Private Equity ETF IPrV Ish 0.75 0.50 225.39 usd 15.88 25.2 23.9<br />
nYsE arca defense Index Tracker dFIoP gs 0.00 0.76 - chF 183.90 25.2 16.6<br />
comstage ETF MscI usa small cap Trn ETF cBusas cBK 0.35 0.54 59.03 usd 27.92 25.2 46.0<br />
ishares MscI usa small cap ETF csuss Ish 0.30 0.39 195.01 usd 187.98 24.9 47.1<br />
Barclays capital us chips Tr Index Tracker BcBPQ Barc 1.00 1.25 - Eur 19.20 24.9 -<br />
s&P 500 Industrials Tr Index Tracker ETcYc uBs 0.00 0.26 - usd 536.00 24.6 -<br />
db x-trackers russEll 2000 ETF xrud dB 0.45 0.29 580.07 usd 128.28 24.1 41.9<br />
nikkei 225 Index Tracker nIKKY uBs 0.00 1.10 - chF 12.95 21.6 15.1<br />
s&P 500 Tr Index Tracker ETsPx uBs 0.00 0.33 - usd 286.00 21.5 44.9<br />
comstage ETF MscI usa Trn ETF cBusa cBK 0.25 1.00 301.87 chF 37.42 21.0 41.7<br />
uBs MscI daily Tr net usa Index Tracker Mscus uBs 0.00 0.24 - usd 397.00 20.9 -<br />
db x-trackers s&P 500 ETF xsPx dB 0.20 0.15 1'373.68 chF 25.00 20.9 -<br />
s&P-500 Tr Index Tracker sPWIn uBs 0.80 0.37 - usd 260.75 20.7 41.7<br />
comstage ETF MscI usa Trn ETF cBusa cBK 0.25 0.27 301.87 usd 39.69 20.6 42.2<br />
aMundI ETF s&P 500 ucITs ETF ETF 500usd aMdI 0.15 0.15 609.02 usd 26.38 20.6 -<br />
ishares s&P 500 - B (acc) ETF cssPx Ish 0.09 0.09 943.77 usd 143.44 20.5 42.2<br />
aMundI ETF MscI usa ETF cu2usd aMdI 0.28 0.17 574.62 usd 180.13 20.5 -<br />
db x-trackers MscI usa IndEx ETF xMus dB 0.30 0.12 2'329.10 usd 39.82 20.5 42.3<br />
ishares MscI usa - B ETF csus Ish 0.22 0.09 357.04 usd 142.44 20.5 42.1<br />
comstage ETF s&P 500 ETF cBsP50 cBK 0.18 1.50 85.02 chF 158.43 20.4 -<br />
ishares s&P 500 (acc) ETF sacc Ish 0.40 0.14 238.45 gBp 2'664.50 20.3 41.0<br />
comstage ETF s&P 500 ETF cBsP50 cBK 0.18 0.25 85.02 usd 168.42 20.1 -<br />
s&P-500 Index Tracker VZosP VT 0.00 1.75 - usd 162.60 20.1 38.2<br />
dow Jones Industrial average Tr Index Tracker ETdoW uBs 0.00 0.17 - usd 290.50 20.0 -<br />
3y (%)<br />
in Chf<br />
dP-<br />
rating<br />
source: Bloomberg | sIx swiss <strong>Exchange</strong> | derivative Partners
diVidEnd inVESting with SPdr ® EtfS<br />
In the search for yield, dividend ETFs are an attractive option.<br />
They can be a potential solution for income in the current low<br />
yield environment and help to diversify a portfolio by using an<br />
alternative to more traditional market capitalisation weightings.<br />
The SPDR S&P Dividend Aristocrats ETFs go beyond traditional<br />
dividend investing to offer exposure to high-quality companies<br />
naME<br />
SPdr S&P uS diVidEnd<br />
ariStoCratS uCitS Etf<br />
49 ExchangE TradEd ProducTs & IndExIng guIdE <strong>Switzerland</strong> <strong>2013</strong><br />
that have a proven track record of paying dividends over many<br />
years. The indices seek a balance between high dividend yields<br />
and dividend sustainability. And with a range of regional options<br />
available, investors can precisely match their portfolio needs.<br />
SPdr S&P uK diVidEnd<br />
ariStoCratS uCitS Etf<br />
tiCKEr on SiX SwiSS usdV uKdV EudV<br />
tEr 0.35% 0.30% 0.30%<br />
baSE CurrEnCy usd gBP Eur<br />
trading CurrEnCy chF chF chF<br />
LaunCh datE 14.10.2011 29.02.2012 29.02.2012<br />
auM (MiLLionS)* $ 1'382.18 £ 46.71 € 117.64<br />
SPdr S&P Euro diVidEnd<br />
ariStoCratS uCitS Etf<br />
rEPLiCation MEthod Physically backed Physically backed Physically backed<br />
diStribution SChEduLE Quarterly semi-annual semi-annual<br />
inVESCo – PowErSharES Eqqq fund<br />
EQQQ aims to fully replicate the NASDAQ-100 Index which<br />
represents the largest non-financial securities listed on the<br />
NASDAQ stock exchange. EQQQ is PowerShares’ most frequently<br />
traded ETF in Europe – just like its US equivalent<br />
is one of the most frequently traded securities in the United<br />
States. Due to its size and the high trading volume of its un-<br />
fund ManagEr Invesco global asset Management ltd.<br />
StruCturE Physical replication, distributing<br />
SyMboL / VaLor EQQQ / 1’527’010<br />
auM $966 Mio. (per 31.05.<strong>2013</strong>)<br />
trading CurrEnCy usd<br />
bEnChMarK nasdaQ-100 Index<br />
on-going ChargES 0.30% p.a.<br />
CLiEnt SErViCE info@zur.invesco.com<br />
PErforManCE (1 yEar, uSd) 12.29% p.a. 2<br />
PErforManCE (3 yEar, uSd) 19.52% p.a. annualised 2<br />
* as at 31.07.<strong>2013</strong>.<br />
derlying securities, EQQQ is very liquid. The ETF is exposed<br />
to over 60% to information technology while the S&P 500’s<br />
allocation to information technology is less than 20%. EQQQ<br />
has zero exposure to financial securities and less than 20% of<br />
the constituents are included in the S&P 500 Index 1 .<br />
PowErSharES Eqqq fund VS. S&P 500 indEX<br />
%<br />
240<br />
220<br />
200<br />
180<br />
160<br />
140<br />
120<br />
100<br />
80<br />
60<br />
40<br />
Oct. Oct. Oct. Oct. Oct. Oct. Oct. Oct. Oct.<br />
2004 2005 2006 2007 2009 2010 2011 2012<br />
PowerShares EQQQ Fund S&P 500 Index<br />
1 source: Invesco | 31.03.<strong>2013</strong><br />
2008<br />
2 source: Invesco | per 30.06.<strong>2013</strong>
ProducT TaBlEs<br />
EquitiES Latin aMEriCa<br />
ProduCt naME tyPE tiCKEr iSSuEr fEE P.a.<br />
(%)<br />
comstage ETF sToxx ® Europe 600 autom. & Parts ETF cBauTo cBK 0.25 0.66 27.29 chF 71.77 39.9 50.2<br />
comstage ETF sToxx ® Europe 600 autom. & Parts ETF cBauTo cBK 0.25 0.15 27.29 Eur 58.10 39.6 50.8<br />
Euro sToxx automobiles & Parts Pr Index (Eur) Tracker dJxMo cBK 0.00 0.89 - Eur 182.22 35.1 36.9<br />
dJ automobiles & Parts Titans 30 Pr Index (Eur) Tracker dJauT cBK 0.00 1.27 - usd 89.60 30.7 39.3<br />
solactive china automobile Tr Index Tracker VZcac VT 1.20 0.98 - chF 80.10 26.7 -<br />
solactive china automobile Tr Index Tracker VZcaE VT 1.20 1.00 - Eur 88.20 26.3 -<br />
comstage ETF sToxx ® Europe 600 Pers. & hhld. goods ETF cBPErs cBK 0.25 0.35 31.30 Eur 95.15 23.8 50.2<br />
sToxx Europe 600 Personal & hhld. goods Tracker ETgoo uBs 0.00 0.56 - Eur 952.00 23.6<br />
comstage ETF sToxx ® Europe 600 Pers. & hhld. goods ETF cBPErs cBK 0.25 0.84 31.30 chF 117.36 23.5 49.6<br />
comstage ETF sToxx ® Europe 600 Food & Beverage ETF cBFood cBK 0.25 0.49 49.98 chF 98.72 17.2 40.8<br />
dJ Food & Beverage Titans 30 Pr Index (Eur) Tracker dJFoB cBK 0.00 0.89 - usd 43.55 17.2 38.4<br />
sToxx Europe 600 Food & Beverage Tr Index (Eur) Tracker ETFoo uBs 0.00 0.55 - Eur 801.50 17.0 -<br />
sPdr ® MscI Europe consumer staples ETF ETF sTss sTT 0.30 0.64 32.97 chF 144.22 17.0 -<br />
lyxor ETF MscI World consumer staples ETF lYcosW lxr 0.40 0.80 32.44 usd 230.11 16.9 -<br />
Euro sToxx Food & Beverage Pr Index (Eur) Tracker dJxox cBK 0.00 0.90 - Eur 43.85 16.8 33.9<br />
comstage ETF sToxx ® Europe 600 Food & Beverage ETF cBFood cBK 0.25 0.50 49.98 Eur 80.13 16.8 41.1<br />
dJ Personal & household goods Titans 30 Tracker dJcnc cBK 0.00 0.77 - usd 50.65 15.5 27.7<br />
lyxor ETF MscI World Materials Tr ETF lYMaTW lxr 0.40 0.60 25.83 usd 266.63 -0.3 -<br />
50 ExchangE TradEd ProducTs & IndExIng guIdE <strong>Switzerland</strong> <strong>2013</strong><br />
SPrEad<br />
(%)<br />
auM<br />
(in Mn.)<br />
CCy PriCE<br />
(in tC)<br />
PErforManCE<br />
1y (%)<br />
in Chf<br />
db x-trackers MscI MExIco IndEx 1c ETF xMEx dB 0.65 0.72 124.25 chF 5.27 4.1 -<br />
ishares MscI Mexico capped ETF csMxcP Ish 0.52 1.10 41.72 usd 135.97 4.1 -<br />
hsBc MscI MExIco caPPEd ETF hMEx hsBc 0.60 0.57 12.24 usd 45.92 3.8 -<br />
Mexican Bolsa Tracker MxxoP gs 0.00 0.66 - chF 28.85 2.1 8.7<br />
MscI Emerging Markets argentina Tracker ETEEM uBs 0.00 1.02 - usd 379.75 1.9 -<br />
MscI Brazil Index Fund Tracker MscIBr lEon 0.60 0.31 - usd 469.00 -5.7 -<br />
sPdr ® MscI EM latin america ETF EMla sTT 0.65 0.81 5.93 chF 18.22 -7.9 -<br />
rBs chile Tr Index Tracker chIlV rBs 1.00 1.52 - usd 181.50 -8.4 -2.1<br />
aMundI ETF MscI EM laTIn aMErIca ETF alaT aMdI 0.45 0.63 47.53 Eur 11.86 -8.5 -<br />
rBs chile Tr Index Tracker chIlc rBs 1.00 1.52 - chF 136.00 -8.5 -2.3<br />
aMundI ETF MscI EM laTIn aMErIca ETF alau aMdI 0.45 0.63 62.82 usd 15.43 -8.6 -<br />
ishares MscI EM latin america (acc) ETF csEMla Ish 0.47 0.87 18.29 usd 85.66 -9.0 -<br />
lyxor ETF MscI EM latin america ETF lYlTM lxr 0.65 0.70 255.51 usd 32.06 -9.2 -25.2<br />
db x-trackers MscI EM laTaM IndEx ETF xMla cBK 0.65 0.49 297.84 usd 48.27 -9.5 -21.1<br />
MscI colombia Index Tracker KoluM rBs 1.00 1.56 - usd 82.20 -10.3 -<br />
ishares MscI chile ucITs ETF ETF cscl Ish 0.39 1.09 36.20 usd 88.39 -10.7 -<br />
hsBc MscI EM laTIn aMErIca ETF ETF hMla hsBc 0.60 0.66 19.31 usd 31.55 -11.4 -<br />
uBs MscI Brazil daily net Tr Index Tracker ETBrZ uBs 0.00 0.53 - usd 465.75 -11.5 -<br />
ishares MscI EM latin america ETF lTaM Ish 0.74 0.36 149.72 gBp 1'365.00 -11.6 -23.6<br />
ishares MscI EM asia ucITs ETF ETF csBr Ish 0.52 0.78 21.90 usd 72.62 -11.8 -<br />
db x-trackers MscI BraZIl IndEx ETF xMBr dB 0.65 0.63 217.36 usd 44.42 -13.4 -33.4<br />
EquitiES ConSuMEr goodS<br />
3y (%)<br />
in Chf<br />
dP-<br />
rating<br />
source: Bloomberg | sIx swiss <strong>Exchange</strong> | derivative Partners
ProducT TaBlEs<br />
EquitiES China<br />
ProduCt naME tyPE tiCKEr iSSuEr fEE P.a.<br />
(%)<br />
51 ExchangE TradEd ProducTs & IndExIng guIdE <strong>Switzerland</strong> <strong>2013</strong><br />
SPrEad<br />
(%)<br />
auM<br />
(in Mn.)<br />
CCy PriCE<br />
(in tC)<br />
PErforManCE<br />
1y (%)<br />
in Chf<br />
shenzen B-shs. Index Tracker shEnZ rBs 0.00 - - usd 97.09 30.3 27.0<br />
solactive china automobile Tr Index Tracker VZcac VT 1.20 0.98 - chF 80.10 26.7 -<br />
solactive china automobile Tr Index Tracker VZcaE VT 1.20 1.00 - Eur 88.20 26.3 -<br />
rBs Jim rogers china Eqty growth Tracker rIchc rBs 1.25 - - chF 75.70 14.1 -<br />
rBs Jim rogers china Eqty growth Tracker rIchu rBs 1.25 - - usd 83.08 14.0 -<br />
rBs Jim rogers china Eqty growth Tracker rIchE rBs 1.25 - - Eur 96.98 13.6 -<br />
Barclays capital china chips Tr Tracker BcBPP Barc 1.00 1.43 - Eur 13.35 13.1 -<br />
daxglobal china urbanization Tracker VZcuE VT 1.20 1.01 - Eur 134.50 13.0 31.7<br />
daxglobal china urbanization Tracker VZcuc VT 1.20 1.01 - chF 115.60 12.7 31.2<br />
comstage ETF hsI ETF cBhsI cBK 0.55 0.93 165.43 chF 26.71 8.4 -<br />
rBs china Fundamental Tracker FVchI rBs 1.00 - - usd 87.26 8.1 -<br />
comstage ETF hsI ETF cBhsI cBK 0.55 0.40 165.43 usd 28.24 7.7 -<br />
Barclays capital china chips Tracker BcBPo Barc 1.00 1.14 - Eur 21.20 6.2 -<br />
MscI china daily net Tr Index Tracker ETchI uBs 0.00 1.14 - usd 330.50 4.0 -<br />
lyxor ETF hong Kong (hsI) ETF lYhsI lxr 0.65 0.22 172.89 usd 26.63 3.9 -9.6<br />
shanghai B shares Index Tracker shang rBs 0.00 - - usd 219.75 3.6 0.4<br />
greater china Basket Tracker VZgcs VT 1.20 1.00 - Eur 150.40 3.6 -13.8<br />
hang seng Index Tracker hsIoE rBs 0.00 1.06 - usd 2.64 3.6 -9.1<br />
db x-trackers MscI chIna ETF xMch dB 0.65 0.51 128.97 chF 10.23 3.1 -<br />
TsE china 25 net Tr Index Tracker ETxIn uBs 0.00 1.37 - hKd 2'088.00 2.3 -<br />
aMundI ETF MscI chIna ETF cc1usd aMdI 0.55 0.36 92.22 usd 227.77 1.7 -<br />
hsBc MscI chIna ETF ETF hMch hsBc 0.60 0.35 44.46 usd 5.53 0.4 -<br />
db x-trackers FTsE chIna 25 ETF xxxI dB 0.60 0.33 211.94 usd 25.23 0.0 -22.3<br />
rBs alpha Index hongkong Tracker alFhK rBs 1.00 - - usd 189.90 0.0 -3.9<br />
comstage ETF hscEI ETF cBhscE cBK 0.55 0.80 139.42 chF 11.93 -1.0 -<br />
lyxor ETF china Enterprise (hscEI) ETF lYasI lxr 0.65 0.56 1019.18 usd 123.88 -1.3 -26.1<br />
comstage ETF hscEI ETF cBhscE cBK 0.55 0.53 139.42 usd 12.61 -1.8 -<br />
hang seng china h-Financial Index Tracker hFIna rBs 0.00 - - usd 164.30 -2.1 -30.4<br />
ishares china large cap ETF Fxc Ish 0.74 0.21 571.69 usd 95.72 -2.3 -26.3<br />
FTsE/xinhua china 25 Tracker xInoE gs 0.00 2.18 - chF 17.25 -3.1 -29.6<br />
hang seng china Enterprise Index Tracker hscus gs 0.00 1.59 - usd 11.95 -3.6 -28.1<br />
hang seng china Enterprise Index Tracker hsccF gs 0.00 1.69 - chF 11.30 -3.8 -28.3<br />
hang seng china Enterprise Index Tracker hscoE rBs 0.00 1.44 - usd 11.74 -5.7 -28.3<br />
ishares csI 300 ucITs ETF ETF cscsI3 Ish 0.32 0.39 139.85 usd 85.85 -6.9 -<br />
3y (%)<br />
in Chf<br />
FTsE xinhua china a 50 Index Tracker axInh uBs 0.00 1.86 - usd 121.20 -9.5 -17.7<br />
dP-<br />
rating<br />
source: Bloomberg | sIx swiss <strong>Exchange</strong> | derivative Partners
ProducT TaBlEs<br />
EquitiES JaPan<br />
ProduCt naME tyPE tiCKEr iSSuEr fEE P.a.<br />
(%)<br />
52 ExchangE TradEd ProducTs & IndExIng guIdE <strong>Switzerland</strong> <strong>2013</strong><br />
SPrEad<br />
(%)<br />
auM<br />
(in Mn.)<br />
CCy PriCE<br />
(in tC)<br />
PErforManCE<br />
1y (%)<br />
in Chf<br />
ToPIx Banks Index Tracker TPBnK rBs 3.08 - - chF 15.00 63.9 -<br />
nikkei 225 Index Tracker nIKQc gs 0.00 1.04 - chF 13.65 52.5 46.0<br />
comstage ETF nikkei 225 ® ETF cBnKY cBK 0.45 0.56 7'891.42 chF 13.60 23.6 18.3<br />
ishares nikkei 225 ucITs ETF ETF csnKY Ish 0.38 0.18 9'387.47 JPY 1'2019.00 23.0 20.6<br />
comstage ETF MscI Japan Trn ETF cBMJ cBK 0.45 0.58 29.09 chF 41.90 22.6 12.7<br />
comstage ETF nikkei 225 ® ETF cBnKY cBK 0.45 0.59 7'891.42 JPY 1'432.00 22.2 18.3<br />
VT nippon Index Tracker VZonI VT 0.00 3.17 - chF 119.80 22.2 14.0<br />
nikkei 225 Index Tracker BcacM Barc 0.00 1.46 - chF 13.05 22.0 15.0<br />
nikkei 225 Index Tracker nIKEo gs 0.00 0.37 - chF 13.05 22.0 15.0<br />
comstage ETF MscI Japan Trn ETF cBMJ cBK 0.45 0.50 29.09 usd 44.31 21.8 12.7<br />
ishares MscI Japan ETF sJPa Ish 0.59 0.20 101.72 gBp 1'946.50 21.7 12.3<br />
ishares MscI Japan - B ETF csJP Ish 0.36 0.27 128'850.41 JPY 10'897.00 21.6 13.0<br />
nikkei 225 Index Tracker nKYcs cs 0.00 0.88 - chF 131.30 21.6 15.1<br />
ishares MscI Japan large cap ETF csJPl Ish 0.36 0.33 4'486.12 JPY 11'220.00 21.6 12.0<br />
db x-trackers MscI JaPan ETF xMJP dB 0.50 0.26 1'179.07 JPY 4'333.00 21.5 15.5<br />
nikkei 225 Index Tracker nKYFB cs 0.50 0.68 - JPY 13'795.00 21.5 15.5<br />
aMundI ETF MscI JaPan ETF cJ1JPY aMdI 0.45 0.39 183.57 JPY 15'917.00 21.4 -<br />
nikkei 225 Index Tracker nIKdB dB 0.00 0.09 - Eur 10.65 21.2 15.1<br />
uBs ETFs plc - MscI Japan ETF JPJYIs uBs 0.00 0.60 5'828.57 JPY 1'227'475.00 21.1 -<br />
uBs ETFs plc - MscI Japan ETF JPJYas uBs 0.00 0.60 5'828.57 JPY 12'064.00 20.9 -<br />
comstage ETF ToPIx ® ETF cBTPx cBK 0.45 0.68 3'197.14 chF 11.34 20.4 10.2<br />
ishares MscI Japan ETF IJPn Ish 0.59 0.17 1'697.45 JPY 1'129.00 20.4 7.9<br />
nikkei 225 Index Tracker nIKcT rBs 0.00 0.14 - JPY 13'700.00 20.3 -<br />
uBs-ETF MscI Japan a ETF JPnJPa uBs 0.55 0.14 134'430.41 chF 33.80 20.0 7.4<br />
uBs-ETF MscI Japan a ETF JPnJPa uBs 0.55 0.17 134'430.41 gBP 23.49 19.7 7.2<br />
hsBc MscI JaPan ETF ETF hMJP hsBc 0.40 0.48 80.43 usd 25.91 19.5 -<br />
uBs-ETF MscI Japan a ETF JPnJPa uBs 0.55 0.24 134'430.41 JPY 3'558.00 19.5 7.3<br />
uBs-ETF MscI Japan I ETF JPnJPI uBs 0.35 0.32 134'430.41 JPY 3'518'824.00 19.3 7.2<br />
hsBc MscI JaPan ETF ETF hMJP hsBc 0.40 0.45 80.43 JPY 2'570.00 19.2 -<br />
comstage ETF ToPIx ® ETF cBTPx cBK 0.45 0.72 3'197.14 JPY 1'189.00 19.1 10.3<br />
ToPIx 100 Index Tracker ToPoE gs 0.00 0.45 - chF 10.90 18.5 6.3<br />
ToPIx 100 Index Tracker TcxdB dB 0.00 0.11 - Eur 8.81 17.7 6.9<br />
lyxor ETF Japan (ToPIx) ETF lYJPn lxr 0.45 0.17 69'299.88 JPY 11'336.00 17.6 6.6<br />
VT Japan sector rotator Tracker VZoJP VT 2.00 2.02 - JPY 7'565.00 16.5 0.4<br />
VT Best of Japan Funds Tracker VZBoJ VT 0.75 1.53 - JPY 5'845.00 16.1 3.7<br />
ishares MscI Japan small cap ETF csJPs Ish 0.42 0.73 3'963.44 JPY 11'353.00 15.3 14.1<br />
ishares MscI Japan smallcap ETF IsJP Ish 0.00 0.45 112.11 gBp 1'739.50 14.3 9.0<br />
rBs alpha Index Japan Tracker alFJP rBs 1.00 - - JPY 14'340.00 2.9 -<br />
3y (%)<br />
in Chf<br />
dP-<br />
rating<br />
source: Bloomberg | sIx swiss <strong>Exchange</strong> | derivative Partners
ProducT TaBlEs<br />
EquitiES aSia-oCEania (EX JaPan)<br />
ProduCt naME tyPE tiCKEr iSSuEr fEE P.a.<br />
(%)<br />
53 ExchangE TradEd ProducTs & IndExIng guIdE <strong>Switzerland</strong> <strong>2013</strong><br />
SPrEad<br />
(%)<br />
auM<br />
(in Mn.)<br />
CCy PriCE<br />
(in tC)<br />
PErforManCE<br />
1y (%)<br />
in Chf<br />
MscI united arab Emirates Tr Index Tracker uaETr rBs 0.75 0.94 - usd 9.60 61.3 51.3<br />
MscI sri lanka Index Tracker srIla rBs 0.00 3.01 - usd 84.60 30.0 -<br />
rBs Middle East Tr Index Tracker araBc rBs 1.25 1.11 - chF 76.20 24.3 21.0<br />
rBs Middle East Tr Index Tracker araBu rBs 1.25 1.13 - usd 99.00 24.3 21.4<br />
rBs Middle East Tr Index Tracker araBE rBs 1.25 1.06 - Eur 98.60 24.2 21.0<br />
Tel aviv 25 Index Tracker IsraE rBs n.a. - usd 3.25 20.8 4.5<br />
sET 50 Index Tracker sEToE rBs 0.00 1.54 - usd 3.14 19.4 -<br />
comstage ETF MscI Pacific ETF cBMP cBK 0.45 1.50 45.07 chF 42.27 18.2 14.7<br />
comstage ETF MscI Pacific ETF cBMP cBK 0.45 0.45 45.07 usd 45.10 17.9 15.2<br />
db x-trackers MscI ThaIland ETF xMTh dB 0.50 0.91 41.08 chF 19.38 15.8 -<br />
lyxor ETF Turkey ETF lYTur lxr 0.65 0.52 222.97 Eur 50.56 15.6 -3.0<br />
rBs Market access dJ Turkey Titans 20 ETF MdJT rBs 0.60 0.70 8.62 usd 217.29 15.5 0.1<br />
MscI Qatar Tr Index Tracker QaTar rBs 0.75 0.94 - usd 31.11 15.0 33.2<br />
lyxor ETF EPra/narEIT asia ex-Japan ETF lYahJ lxr 0.65 0.82 13.90 usd 9.64 14.5 3.5<br />
ishares MscI Turkey ucITs ETF ETF ITKY Ish 0.74 0.55 199.77 usd 37.90 14.0 -2.4<br />
MscI Taiwan daily net Tr Index Tracker ETTaI uBs 0.00 1.27 - usd 192.80 13.8 -<br />
dJ Turkey Titans 20 Index Tracker TurKE rBs n.a. 0.96 - usd 6.54 13.7 -2.2<br />
hsBc MscI TurKEY ETF ETF hTrY hsBc 0.60 0.74 10.42 usd 5.68 13.2 -<br />
ZKB MeinIndex nachhaltigkeit Pazifik Tracker TrPaZI ZKB 0.60 0.42 - chF 115'185.00 13.1 -<br />
ishares MscI ac Far East ex-Japan s.cap ETF IsFE Ish 0.00 0.86 45.04 gBp 1813.00 13.0 2.6<br />
MscI ac south East asia net Tr Index Tracker EasIa rBs 0.65 1.25 - usd 116.90 12.9 -<br />
ZKB MeinIndex nachhaltigkeit Pazifik Tracker TrPaZo ZKB 1.00 0.59 - chF 114.40 12.2 -<br />
db x-trackers MscI MalaYsIa IndEx ETF xMal dB 0.50 0.49 34.04 chF 14.12 11.7 -<br />
comstage ETF MscI Pacific ex. Japan ETF cBMPJ cBK 0.45 0.60 27.68 chF 43.55 11.2 19.6<br />
ishares MscI Pacific ex Japan ETF csPxJ Ish 0.35 0.52 65.95 usd 108.75 11.2 18.7<br />
comstage ETF MscI Taiwan Trn ETF cBTaI cBK 0.60 0.72 40.89 chF 17.46 11.1 10.8<br />
comstage ETF MscI Pacific ex. Japan ETF cBMPJ cBK 0.45 0.50 27.68 usd 46.05 11.0 19.6<br />
db x-trackers MscI PacIFIc Ex JaPan ETF xPxd dB 0.45 0.29 413.23 usd 45.90 10.7 19.1<br />
ishares MscI Taiwan ucITs ETF ETF csTW Ish 0.52 0.72 16.89 usd 116.02 10.7 -<br />
aMundI ETF MscI PacIFIc Ex JaPan ETF cP9usd aMdI 0.45 0.35 84.21 usd 457.40 10.5 -<br />
comstage ETF MscI Taiwan Trn ETF cBTaI cBK 0.60 0.73 40.89 usd 18.57 10.4 10.7<br />
lyxor ETF MscI Taiwan ETF lYTWn lxr 0.65 0.65 50.48 usd 9.69 10.4 5.5<br />
db x-trackers MscI TaIWan IndEx ETF xMTW dB 0.65 0.40 86.92 usd 18.28 10.2 10.5<br />
KlsE composite Index Tracker MalaY rBs 0.00 0.53 - usd 5.60 10.1 -<br />
ishares MscI australia - B ETF csau Ish 0.34 0.33 25.52 usd 130.29 9.7 -<br />
ishares MscI australia ETF saus Ish 0.59 0.26 61.82 gBp 1'860.00 9.5 19.7<br />
VT Best of asia Funds Index Tracker VZBoa VT 0.75 1.54 - usd 122.50 9.4 12.9<br />
MscI oman Tr Index Tracker oManI rBs 0.75 3.01 - usd 24.80 8.8 -12.3<br />
hsBc MscI IndonEsIa ETF ETF hIdr hsBc 0.60 0.99 9.97 usd 92.37 8.8 -<br />
3y (%)<br />
in Chf<br />
ishares asia Pacific dividend ETF IaPd Ish 0.59 0.49 321.10 usd 32.10 7.8 17.2<br />
dP-<br />
rating<br />
source: Bloomberg | sIx swiss <strong>Exchange</strong> | derivative Partners
ProducT TaBlEs<br />
EquitiES afriCa<br />
ProduCt naME tyPE tiCKEr iSSuEr fEE P.a.<br />
(%)<br />
coBa Faktor 1x short VsToxxF Index Tracker cBsVsT cBK 0.75 1.89 - Eur 10.65 130.7 -<br />
coBa Faktor 1x short VIxF Index Tracker cBsVIx cBK 0.75 3.99 chF 11.75 116.4 -<br />
db x-trackers dB EQuITY sTraTEgIEs hgd. Fnd. Ind. ETF xhFh dB 0.90 0.50 9.02 chF 9.74 7.0 -<br />
db x-trackers dB hEdgE Fund IndEx ETF xhFI dB 0.90 0.46 462.52 Eur 10.72 6.8 -<br />
uBs ETFs plc - hFrx global hedge Fund Index ETF hFEuas uBs 0.00 1.00 84.02 Eur 95.43 5.8 -<br />
db x-trackers dB hEdgE Fund IndEx ETF xhFd dB 0.70 0.59 462.52 usd 10.91 4.1 -<br />
credit suisse/Tremont allhedge Index Tracker allhg cs 1.00 0.47 - usd 105.80 3.9 -9.2<br />
db x-trackers dB hEdgE Fund IndEx ETF xhFc dB 0.90 0.66 462.52 chF 10.59 3.8 0.0<br />
uBs ETFs plc - hFrx global hdg. Fund Ind. ETF hFusas uBs 0.00 1.00 84.02 usd 95.67 3.4 -<br />
uBs ETFs plc - hFrx global hdg. Fund Ind. ETF hFchas uBs 0.00 0.97 84.02 chF 92.56 3.1 -<br />
uBs ETFs plc - hFrx global hdg. Fund Ind. ETF hFgBas uBs 0.00 1.00 84.02 gBP 95.12 0.1 -<br />
raiffeisen Zertifikat alternative anlagen II Tracker rZaaI VT 0.30 1.97 - chF 86.10 -5.7 1.9<br />
s&P 500 VIx Futures Term structure Er Index Tracker VIxls uBs 0.85 0.51 - usd 215.00 -21.4 -<br />
uBs Forward 1Y Europe Volatility Er Index Tracker VolEu uBs 0.75 2.05 - Eur 62.50 -25.4 -<br />
s&P 500 VIx Mid-Term Futures Er Index Tracker VIxMT uBs 0.55 0.00 - usd 475.25 -49.8 -<br />
s&P 500 VIx short-Term Futures Er Index Tracker VIxsT uBs 0.55 2.77 - usd 188.20 -67.4 -<br />
coBa Faktor 1x long VsToxxF Index Tracker cBlVsT cBK 0.75 2.00 - Eur 3.18 -69.9 -<br />
coBa Faktor 1x long VIxF Index Tracker cBlVIx cBK 0.75 3.41 - chF 1.94 -71.8 -<br />
54 ExchangE TradEd ProducTs & IndExIng guIdE <strong>Switzerland</strong> <strong>2013</strong><br />
SPrEad<br />
(%)<br />
auM<br />
(in Mn.)<br />
CCy PriCE<br />
(in tC)<br />
PErforManCE<br />
1y (%)<br />
in Chf<br />
rBs nigeria Pr Index Tracker ngrIa rBs 1.20 4.51 - usd 50.48 62.3 22.5<br />
rBs Market access FTsE/JsE africa Top 40 ETF MFaI rBs 0.65 0.81 9.75 usd 39.16 -0.5 7.9<br />
lyxor ETF south africa (FTsE JsE ToP 40) ETF lYaFs lxr 0.65 0.18 56.90 Eur 27.34 -1.1 2.8<br />
FTsE/JsE Top 40 Index . Tracker Tracker JToPI rBs 0.00 0.85 - usd 3.50 -3.7 3.5<br />
ishares MscI south africa - B ETF csZa Ish 0.52 0.75 14.37 usd 105.90 -6.2 -<br />
hsBc MscI souTh aFrIca ETF ETF hZar hsBc 0.60 0.74 4.93 usd 48.26 -9.2 -<br />
Egx 30 Index Tracker caIro rBs 0.00 3.81 - usd 6.45 -17.6 -44.2<br />
Ml africa lions Index Tracker MlaIu Boa 1.00 3.35 - usd 61.20 -24.6 -29.6<br />
Ml africa lions Index Tracker MlaIc Boa 1.00 32.49 - chF 63.10 -25.4 -32.7<br />
FTsE/JsE africa Top 40 Index Tracker ETJsE uBs 0.00 0.87 - Zar 432.75 -90.0 -<br />
aLtErnatiVE StratEgiES<br />
3y (%)<br />
in Chf<br />
dP-<br />
rating<br />
source: Bloomberg | sIx swiss <strong>Exchange</strong> | derivative Partners
ProducT TaBlEs<br />
EquitiES EMErging MarKEtS<br />
ProduCt naME tyPE tiCKEr iSSuEr fEE P.a.<br />
(%)<br />
55 ExchangE TradEd ProducTs & IndExIng guIdE <strong>Switzerland</strong> <strong>2013</strong><br />
SPrEad<br />
(%)<br />
auM<br />
(in Mn.)<br />
CCy PriCE<br />
(in tC)<br />
PErforManCE<br />
1y (%)<br />
in Chf<br />
MscI Frontier Markets daily net Tr Index Tracker FronT rBs n.a. 0.98 - usd 98.95 23.1 -<br />
db x-trackers s&P sElEcT FronTIEr ETF xsFr dB 0.95 1.20 81.09 chF 9.64 18.4 -5.6<br />
uBs Frontier and Emerging Markets Index Tr Tracker PEFEM uBs 0.75 2.04 - chF 104.50 12.5 -<br />
BrIcs nifty 50 developed Markets Tr Index Tracker ndMaa gs 1.00 0.00 - usd 14.25 11.1 -<br />
ossIaM EMErgIng MarKETs MIn.Var. ETF EMMV ossI 0.75 0.63 90.21 Eur 87.33 8.9 -<br />
Ml EM small cap Basket Tracker MlEMu Boa 0.50 0.00 - usd 93.75 8.8 -0.3<br />
ossIaM EMErgIng MarKETs MIn. Var. ETF dEMV ossI 0.75 0.61 90.21 usd 113.53 8.7 -<br />
ishares MscI Emerging Markets smallcap ETF IEMs Ish 0.74 1.22 238.67 usd 63.62 7.8 -5.7<br />
sPdr ® MscI Emerging Markets small cap ETF EMsc sTT 0.65 1.00 13.51 chF 61.29 7.0 -<br />
rBs Young Emerging Market Indices Basket Tracker YEMMa rBs 1.50 1.31 - chF 39.56 4.7 -15.2<br />
sPdr ® MscI EM asia ETF ETF EMas sTT 0.65 0.86 170.90 chF 42.05 3.7 -<br />
rBs EM srI Tr Index Tracker rEsPo rBs 1.00 1.50 - usd 110.90 3.4 3.7<br />
hsBc MscI EM Far EasT ETF ETF hMFE hsBc 0.60 0.96 27.59 usd 35.35 2.0 -<br />
ishares Emerging Market Infrastructure ETF IEMI Ish 0.74 0.75 80.11 usd 21.84 2.0 -<br />
rBs BrIc 11 Basket Tracker ElFus rBs 1.25 0.91 - usd 107.00 1.4 -11.0<br />
rBs BrIc 11 Basket Tracker ElFEu rBs 1.25 0.90 - Eur 109.60 1.2 -11.3<br />
rBs BrIc 11 Basket Tracker ElFch rBs 1.25 0.96 - chF 81.80 1.2 -11.5<br />
VT Best of BrIc Fund Tracker VZBoB VT 0.75 1.05 - usd 116.30 1.0 -21.8<br />
aMundI ETF MscI EMErgIng MarKETs ETF auEM aMdI 0.45 0.47 207.39 usd 3.66 0.9 -<br />
sPdr ® MscI Emerging Markets ETF EMrg sTT 0.65 0.63 26.56 chF 40.18 0.1 -<br />
uBs ETFs plc - MscI Emerging Markets ETF EgusIs uBs 0.00 0.96 956.45 usd 7'353.91 0.1 -<br />
db x-trackers MscI EMErgIng MarKETs ETF xMEM dB 0.65 0.13 2975.13 usd 36.12 0.1 -7.6<br />
ishares MscI Emerging Markets (acc) ETF sEMa Ish 0.75 0.44 199.02 gBp 1'762.50 -0.2 -7.0<br />
uBs ETFs plc - MscI Emerging Markets ETF Egusas uBs 0.00 0.29 956.45 usd 36.91 -0.2 -<br />
uBs-ETF MscI Emerging Markets a ETF EMMusa uBs 0.70 0.47 293.93 chF 87.92 -0.9 -<br />
uBs-ETF MscI Emerging Markets a ETF EMMusa uBs 0.70 0.42 293.93 usd 92.91 -1.0 -<br />
uBs-ETF MscI Emerging Markets I ETF EMMusI uBs 0.45 0.49 293.93 usd 93'210.66 -1.3 -<br />
MscI new Emerging Markets Tracker EMMas rBs 0.65 2.90 - usd 82.40 -1.3 -<br />
db x-trackers MscI BrIc IndEx ETF xBrI dB 0.65 0.82 8.17 chF 36.57 -2.4 -<br />
ishares MscI EM EMEa ETF csEMEM Ish 0.52 0.71 11.97 usd 102.94 -2.5 -<br />
ishares MscI Emerging Markets ETF IEEM Ish 0.00 0.19 3'394.23 usd 36.33 -2.6 -11.8<br />
BrIcs nifty 50 Emerging Markets Tracker nEMaa gs 1.20 0.00 - usd 11.35 -2.7 -<br />
db x-trackers MscI EM EMEa ETF xMEa dB 0.65 0.54 86.90 usd 30.29 -3.1 -4.3<br />
rBs Market access daxglobal ® BrIc ETF MaBI rBs 0.65 1.33 29.32 usd 50.10 -3.7 -21.6<br />
uBs BrIc country rotator Tracker BrIcr uBs 1.00 1.51 - chF 102.00 -4.0 -27.2<br />
ishares BrIc 50 ucITs ETF ETF BrIc Ish 0.74 0.43 416.04 usd 23.48 -5.0 -23.7<br />
db x-trackers MscI EM shorT daIlY ETF xEMd dB 0.95 0.73 11.78 chF 19.17 -5.0 -<br />
hsBc s&P BrIc 40 ETF ETF hsBr hsBc 0.60 0.93 12.65 usd 21.18 -5.0 -<br />
Powershares FTsE raFI Em.Ma. ETF PEhh Ps 0.85 0.51 10.44 usd 7.85 -5.5 -18.0<br />
3y (%)<br />
in Chf<br />
dax global BrIc Pr Index Tracker BrIcK rBs 0.00 0.41 - usd 48.55 -6.0 -25.0<br />
dP-<br />
rating<br />
source: Bloomberg | sIx swiss <strong>Exchange</strong> | derivative Partners
EMErging MarKEtS Liquid Eurobond<br />
The emerging markets are registering solid debt to equity ratios<br />
compared with the industrial nations. To benefit from this, investors<br />
can use the db X-trackers ETFs offering on the emerging<br />
markets liquid eurobond strategy. The strategy invests in hard<br />
iSSuEr db x-trackers<br />
yiELd tyPE does not pay dividends<br />
bLooMbErg tiCKEr xEMB gY<br />
iSin lu0321462953<br />
auM 302.43<br />
tradE CurrEnCy Eur<br />
bEnChMarK dB EM liquid Eurobond hedged<br />
adMiniStratiVE fEE P.a. 0.55%<br />
inVEStor SErViCE +41 (44) 224 5836<br />
EMaiL philip.knueppel@db.com<br />
56 ExchangE TradEd ProducTs & IndExIng guIdE <strong>Switzerland</strong> <strong>2013</strong><br />
currency bonds, therefore offering a higher level of liquidity than<br />
local currencies. In addition, the foreign exchange risk is limited<br />
to EUR and USD.<br />
EMErging MarKEt hard CurrEnCy bondS<br />
%<br />
160<br />
140<br />
120<br />
100<br />
80<br />
60<br />
40<br />
20<br />
0<br />
Sep. Sep. Sep. Sep. Sep. Sep.<br />
2008 2009 2010 2011 2012 <strong>2013</strong><br />
EM Liquid Eurobond ETF<br />
source: Bloomberg<br />
The following document is intended purely as marketing material. The full prospectus constitutes the only binding basis for the purchase of the sub-Funds. The registered office of db x-trackers (rcs no. B-119-899), a company registered in luxembourg, is 49, avenue J.F. Kennedy, l-1855<br />
luxembourg. db x-trackers ® is a registered trademark of deutsche Bank ag.The representative in switzerland is deutsche asset Management schweiz ag, Prime Tower, hardstrasse 201, 8005 Zurich. The Paying agent in switzerland is deutsche Bank (suisse) s.a., place des Bergues<br />
3, 1201 geneva. The prospectus, key investor information, articles of association, annual and semi-annual reports are all available in german language from the representative free of charge or in electronic form from the website www.etf.db.com.<br />
MSCi JaPan Eur & uSd hEdgEd<br />
The Bank of Japan has this year put in place an extremely expansive<br />
monetary and fiscal policy framework, with the result that<br />
the Japanese stock market has rallied. But this has also led to<br />
a devaluation of the yen against other major currencies, which<br />
has had the effect of diluting the upside performance for many<br />
iSSuEr db x-trackers<br />
yiELd tyPE does not pay dividends<br />
bLooMbErg tiCKEr xMK9 gY / xMuJ ln<br />
iSin lu065980079 / lu0927735406<br />
auM 752.86<br />
tradE CurrEnCy Eur / usd<br />
bEnChMarK<br />
MscI Japan (Eur hedged) /<br />
MscI Japan (usd hedged)<br />
adMiniStratiVE fEE P.a. 0.6%<br />
inVEStor SErViCE +41 (44) 224 5836<br />
EMaiL philip.knueppel@db.com<br />
international investors. Enter the db X-trackers MSCI Japan (EUR<br />
hedged) and MSCI Japan (USD hedged) <strong>Exchange</strong> <strong>Traded</strong> Funds<br />
(ETFs), which provide exposure to Japan’s stock market without<br />
the currency risk, for euro or US dollar denominated investors.<br />
abEnoMiCS and CurrEnCy hEdging<br />
%<br />
200<br />
150<br />
100<br />
50<br />
0<br />
Sep. Oct. Nov. Dec. Jan. Feb. Mar. Apr. Mai Jun. Jul. Aug.<br />
2012 <strong>2013</strong><br />
MSCI Japan EUR Hedged ETF<br />
source: Bloomberg<br />
The following document is intended purely as marketing material. The full prospectus constitutes the only binding basis for the purchase of the sub-Funds. The registered office of db x-trackers (rcs no. B-119-899), a company registered in luxembourg, is 49, avenue J.F. Kennedy, l-1855<br />
luxembourg. db x-trackers ® is a registered trademark of deutsche Bank ag.The representative in switzerland is deutsche asset Management schweiz ag, Prime Tower, hardstrasse 201, 8005 Zurich. The Paying agent in switzerland is deutsche Bank (suisse) s.a., place des Bergues<br />
3, 1201 geneva. The prospectus, key investor information, articles of association, annual and semi-annual reports are all available in german language from the representative free of charge or in electronic form from the website www.etf.db.com.
ProducT TaBlEs<br />
EquitiES gLobaL StratEgiES<br />
ProduCt naME tyPE tiCKEr iSSuEr fEE P.a.<br />
(%)<br />
57 ExchangE TradEd ProducTs & IndExIng guIdE <strong>Switzerland</strong> <strong>2013</strong><br />
SPrEad<br />
(%)<br />
auM<br />
(in Mn.)<br />
CCy PriCE<br />
(in tC)<br />
PErforManCE<br />
1y (%)<br />
in Chf<br />
rBs solar Energy Tr Index Tracker solus rBs 1.00 0.96 - usd 16.01 62.8 -56.8<br />
rBs solar Energy Tr Index Tracker solEu rBs 1.00 1.03 - Eur 15.97 60.4 -57.0<br />
s&P supercomposite oil & gas Index Tracker sPoIr rBs 0.00 1.60 - usd 87.20 57.1 124.5<br />
ardour glbl. alternat. Energy Extra liquid Tracker PoWEr uBs 1.20 0.75 - chF 30.30 44.3 -<br />
ZKB MeinIndex nachhaltigkeit solar Tracker TrsolI ZKB 0.50 0.37 - chF 47'950.00 43.7 -<br />
ZKB MeinIndex nachhaltigkeit solar Tracker Trsolo ZKB 0.90 0.23 - chF 38.10 42.4 -<br />
dJ Financial services Titans 30 Tracker dJFIs cBK 0.00 1.13 - usd 29.20 40.7 40.2<br />
lPx Major Market Tr Index (Eur) Tracker lPxch rBs 1.65 1.08 - chF 61.10 37.3 44.1<br />
lPx Major Market Tr Index (Eur) Tracker lPxus rBs 1.65 0.95 - usd 78.90 37.0 44.6<br />
ZKB MeinIndex nachhaltigkeit Wind Tracker TrWInI ZKB 0.50 0.23 - chF 58'590.00 36.1 -<br />
ZKB MeinIndex nachhaltigkeit Wind Tracker TrWIno ZKB 0.90 0.34 - chF 39.80 34.7 -<br />
dJ Media Titans 30 Pr Index (Eur) Tracker dJMEd cBK 0.00 0.96 - usd 39.05 32.8 58.3<br />
VT Klimaschutz Index Tracker KlIMa VT 1.60 1.02 - chF 30.35 32.5 -39.6<br />
lyxor ETF PrIVEx ETF lYPVx lxr 0.70 0.49 27.60 Eur 4.84 32.5 27.3<br />
dJ Insurance Titans 30 Pr Index (Eur) Tracker dJIns cBK 0.00 0.24 - usd 20.10 32.2 20.9<br />
lyxor ETF MscI World cons. discr. ETF lYcodW lxr 0.40 1.21 70.05 usd 182.22 31.0 -<br />
dJ automobiles & Parts Titans 30 Tracker dJauT cBK 0.00 1.27 - usd 43.55 30.7 39.3<br />
ishares MscI EMu small cap ETF csEMus Ish 0.42 0.98 173.83 Eur 98.45 29.9 17.9<br />
Barclays capital grey chips Tracker BcBPu Barc 1.00 1.23 - Eur 11.45 29.6 -<br />
lyxor ETF MscI World Financials ETF lYFInW lxr 0.40 1.21 31.97 usd 122.05 29.0 -<br />
aMundI ETF MscI World FInancIals ETF cWFusd aMdI 0.35 0.37 57.61 usd 122.51 28.7 -<br />
VT oil-strategy Index Tracker VZoIE VT 1.20 1.00 - Eur 169.00 26.8 41.3<br />
dJ Banks Titans 30 Pr Index (Eur) Tracker dJBaK cBK 0.00 2.05 - usd 7.19 26.8 0.6<br />
lyxor ETF MscI World health care ETF lYhlTW lxr 0.40 0.90 142.99 usd 183.47 26.6 -<br />
VT oil-strategy Index Tracker VZoIc VT 1.20 1.03 - chF 136.90 26.5 40.7<br />
VT oil-strategy Index Tracker VZoIu VT 1.20 1.02 - usd 163.70 26.4 41.0<br />
dJ health care Titans 30 Tracker dJhEc cBK 0.00 0.92 - usd 41.40 25.9 40.5<br />
lyxor ETF MscI EMu small cap ETF MMs lxr 0.40 1.00 89.50 Eur 162.97 25.8 9.4<br />
solactive smart grid Tr Index Tracker VZsgu VT 1.50 1.00 - usd 78.60 23.8 -21.4<br />
solactive smart grid Tr Index Tracker VZsgE VT 1.50 1.01 - Eur 89.00 23.7 -21.4<br />
solactive smart grid Tr Index Tracker VZsgc VT 1.50 0.97 - chF 72.35 23.7 -21.5<br />
s&P global Timber & Forestry Tracker TIMBr gs 1.00 0.00 - Eur 153.80 23.5 9.1<br />
ideas TV c Index Tracker cBIca cBK 0.00 0.19 - Eur 150.40 23.4 15.2<br />
ideas TV c Index Tracker cBIcB cBK 0.00 0.21 - chF 185.10 23.3 15.0<br />
VT natural-gas-strategy Index Tracker VZgIE VT 1.20 0.98 - Eur 170.90 23.3 40.8<br />
s&P global Timber & Forestry Tracker TIMus gs 1.00 0.00 - usd 165.90 23.2 9.2<br />
s&P global Timber & Forestry Tracker TIMch gs 1.00 0.28 - chF 170.60 23.2 8.3<br />
MscI Frontier Markets Tracker FronT rBs n.a. 0.98 - usd 98.95 23.1 -<br />
dJ retail Titans 30 Tracker dJrET cBK 0.00 0.85 - usd 38.90 23.1 45.9<br />
uBs MscI EMu net Tr Index Tracker MscEu uBs 1.00 0.35 - Eur 220.30 22.9 -<br />
3y (%)<br />
in Chf<br />
dP-<br />
rating<br />
source: Bloomberg | sIx swiss <strong>Exchange</strong> | derivative Partners
ProducT TaBlEs<br />
EquitiES oiL & gaS, EnErgy<br />
ProduCt naME tyPE tiCKEr iSSuEr fEE P.a.<br />
(%)<br />
58 ExchangE TradEd ProducTs & IndExIng guIdE <strong>Switzerland</strong> <strong>2013</strong><br />
SPrEad<br />
(%)<br />
auM<br />
(in Mn.)<br />
CCy PriCE<br />
(in tC)<br />
PErforManCE<br />
1y (%)<br />
in Chf<br />
rBs solar Energy Tr Index Tracker solus rBs 1.00 0.96 - usd 16.01 62.8 -56.8<br />
rBs solar Energy Tr Index Tracker solEu rBs 1.00 1.03 - Eur 15.97 60.4 -57.0<br />
s&P supercomposite oil & gas Index Tracker sPoIr rBs 0.00 1.60 - usd 87.20 57.1 124.5<br />
ardour glbl. alternat. Energy Extra liquid Tracker PoWEr uBs 1.20 0.75 - chF 30.30 44.3 -<br />
ZKB MeinIndex nachhaltigkeit solar Tracker TrsolI ZKB 0.50 0.37 - chF 47'950.00 43.7 -<br />
ZKB MeinIndex nachhaltigkeit solar Tracker Trsolo ZKB 0.90 0.23 - chF 38.10 42.4 -<br />
ZKB MeinIndex nachhaltigkeit Wind Tracker TrWInI ZKB 0.50 0.23 - chF 58'590.00 36.1 -<br />
ZKB MeinIndex nachhaltigkeit Wind Tracker TrWIno ZKB 0.90 0.34 - chF 39.80 34.7 -<br />
VT oil-strategy Index Tracker VZoIE VT 1.20 1.00 - Eur 169.00 26.8 41.3<br />
VT oil-strategy Index Tracker VZoIc VT 1.20 1.03 - chF 136.90 26.5 40.7<br />
VT oil-strategy Index Tracker VZoIu VT 1.20 1.02 - usd 163.70 26.4 41.0<br />
VT natural-gas-strategy Index Tracker VZgIE VT 1.20 0.98 - Eur 170.90 23.3 40.8<br />
ZKB MeinIndex nachhaltigkeit Energie Tracker TrErZI ZKB 0.50 0.43 - chF 91'710.00 21.4 -<br />
ZKB MeinIndex nachhaltigkeit Energie Tracker TrErZo ZKB 0.90 0.40 - chF 74.25 20.1 -<br />
ishares global clean Energy ucITs ETF ETF Inrg Ish 0.65 0.55 77.29 usd 5.10 19.2 -47.6<br />
s&P supercomp. oil & gas drilling Index Tracker sPoIl rBs 0.00 2.04 - usd 79.10 17.8 16.5<br />
nYsE arca oil Pr Index Tracker xoIoQ gs 0.00 0.71 - usd 133.80 15.5 31.2<br />
nYsE arca natural gas Pr Index Tracker xngoE rBs 0.00 1.99 - usd 71.90 14.7 31.0<br />
rBs oil & gas Equipment & services Tracker oIlag rBs 1.00 0.98 - usd 102.70 9.7 21.0<br />
lyxor ETF MscI World Energy ETF lYnrgW lxr 0.40 0.60 34.09 usd 322.06 9.4 -<br />
ishares global alternative Energy ETF csaE Ish 0.57 0.98 19.96 usd 43.47 8.8 -<br />
daxglobal alternative Energy Tracker daEPI uBs 1.00 0.65 - usd 114.70 8.7 -31.5<br />
lyxor ETF new Energy ETF lYnrJ lxr 0.60 0.75 44.24 Eur 14.01 7.3 -28.9<br />
dJ oil & gas Titans 30 Tracker dJEnE cBK 0.00 0.87 - usd 43.10 4.2 9.7<br />
s&P global nat. res. Energy Tracker uBnEn uBs 1.20 0.82 - Eur 29.00 3.9 8.7<br />
Euro sToxx oil & gas Tracker dJxgY cBK 0.00 1.30 - Eur 28.60 3.5 -4.7<br />
comstage ETF sToxx ® Europe 600 oil & gas ETF cBoIl cBK 0.25 0.70 38.14 chF 77.59 1.5 15.4<br />
comstage ETF sToxx ® Europe 600 oil & gas ETF cBoIl cBK 0.25 0.20 38.14 Eur 62.91 1.2 16.1<br />
sPdr ® MscI Europe Energy ETF ETF sTns sTT 0.30 0.64 18.02 chF 120.00 0.8 -<br />
sToxx Europe 600 oil & gas Tracker EToIl uBs 0.00 0.61 - Eur 624.00 0.7 -<br />
lyxor ETF sToxx 600 oil & gas ETF lYoIl lxr 0.30 1.22 123.78 Eur 32.65 0.3 7.1<br />
VT raiffeisen alternative anlagen I Basket Tracker rZaaa VT 0.30 2.00 - chF 66.35 -7.3 -8.4<br />
rBs clean renewable Energy Tr Index Tracker rEusd rBs 1.00 1.22 - usd 29.90 -10.0 -61.0<br />
rBs clean renewable Energy Tr Index Tracker rEEur rBs 1.00 1.01 - Eur 27.80 -10.2 -60.8<br />
rBs clean renewable Energy Tr Index Tracker rEnch rBs 1.00 1.32 - chF 20.90 -10.3 -62.5<br />
solactive Fossil Energy Mix Tr Index Tracker VZEME VT 1.20 1.00 - Eur 71.00 -13.6 -<br />
solactive Fossil Energy Mix Tr Index Tracker VZEMc VT 1.20 1.02 - chF 69.40 -13.6 -<br />
rBs sustainable oil sands sector Tracker oIlsn rBs 1.00 1.14 - chF 157.75 -18.6 -32.2<br />
3y (%)<br />
in Chf<br />
dP-<br />
rating<br />
source: Bloomberg | sIx swiss <strong>Exchange</strong> | derivative Partners
ProducT TaBlEs<br />
EquitiES baSiC MatEriaLS<br />
ProduCt naME tyPE tiCKEr iSSuEr fEE P.a.<br />
(%)<br />
59 ExchangE TradEd ProducTs & IndExIng guIdE <strong>Switzerland</strong> <strong>2013</strong><br />
SPrEad<br />
(%)<br />
auM<br />
(in Mn.)<br />
CCy PriCE<br />
(in tC)<br />
PErforManCE<br />
1y (%)<br />
in Chf<br />
Euro sToxx chemicals Pr Index (Eur) Tracker dJxca cBK 0.00 0.87 - Eur 79.95 27.8 42.1<br />
comstage ETF sToxx ® Europe 600 chemi. ETF cBchEM cBK 0.25 0.30 37.99 Eur 122.07 26.0 48.5<br />
comstage ETF sToxx ® Europe 600 chemi. ETF cBchEM cBK 0.25 1.30 37.99 chF 149.66 26.0 47.4<br />
sToxx Europe 600 chemicals Tracker ETchM uBs 0.00 0.57 - Eur 1'209.00 25.6 -<br />
s&P global Timber & Forestry Tracker TIMBr gs 1.00 0.00 - Eur 153.80 23.5 9.1<br />
s&P global Timber & Forestry Tracker TIMus gs 1.00 0.00 - usd 165.90 23.2 9.2<br />
s&P global Timber & Forestry Tracker TIMch gs 1.00 0.28 - chF 170.60 23.2 8.3<br />
ZKB MeinIndex nachhaltigkeit ress. Tracker TrrEsI ZKB 0.50 0.49 - chF 116'745.00 19.3 -<br />
ZKB MeinIndex nachhaltigkeit ress. Tracker TrrEso ZKB 0.90 0.45 - chF 128.50 18.7 -<br />
dow Jones chemicals Titans 30 Index Tracker dJcEM cBK 0.00 0.69 - usd 42.45 14.8 32.9<br />
VT global agricultural stocks Tr Index Tracker VZags VT 1.00 1.00 - Eur 117.00 13.7 39.0<br />
s&P global natural resources agriculture Tracker uBnag uBs 1.20 0.70 - Eur 28.35 8.4 21.4<br />
rBs global Farmers Tr Index Tracker FarMa rBs 1.00 1.02 - usd 134.30 7.6 32.9<br />
rBs global Farmers Tr Index Tracker FarMI rBs 1.00 0.98 - Eur 143.20 7.5 32.7<br />
rBs global Farmers Tr Index Tracker FarMr rBs 1.00 1.11 - chF 106.80 7.4 32.8<br />
s&P global nuclear Energy Tracker nucEn gs 1.00 0.00 - Eur 249.20 7.3 -5.9<br />
s&P global nuclear Energy Tracker nucch gs 1.00 0.09 - chF 277.75 7.2 -6.2<br />
s&P global nuclear Energy Tracker nucus gs 1.00 0.00 - usd 251.00 7.1 -6.5<br />
VT commodity related stocks rotation Index Tracker VZcrs VT 1.20 0.99 - usd 106.20 5.5 4.6<br />
sPdr ® MscI Europe Materials ETF ETF sTPs sTT 0.30 0.49 12.95 chF 151.03 3.2 -<br />
Powershares global agricu. nasdaQ oMx ETF Psuu Ps 0.75 0.68 14.36 usd 11.77 2.5 19.5<br />
uBs agri chemical Index Tracker agrar uBs 1.00 1.04 - chF 223.80 0.2 -<br />
s&P global natural resources Tracker uBnaT uBs 1.20 0.84 - Eur 22.55 -4.1 -8.5<br />
VT global steel Tr Index Tracker VZgsT VT 1.20 0.99 - chF 119.90 -4.7 -37.4<br />
s&P supercomposite steel Index Tracker sPsTE rBs 0.00 - - usd 12.55 -4.9 -22.1<br />
Euro sToxx Basic resources Tracker dJxrE cBK 0.00 2.42 - Eur 15.20 -5.4 -39.6<br />
rBs Full Metal Basket Tracker METal rBs 0.00 1.03 - usd 194.30 -12.5 -16.9<br />
sToxx Europe 600 Basic resources Tracker ETBas uBs 0.00 0.59 - Eur 620.50 -14.2 -<br />
comstage ETF sToxx ® Europe 600 Basic res. ETF cBBasI cBK 0.25 0.74 34.60 Eur 61.83 -14.4 -27.2<br />
lyxor ETF sToxx 600 Basic resources ETF lYBrE lxr 0.30 0.52 171.53 Eur 35.20 -14.5 -29.7<br />
comstage ETF sToxx ® Europe 600 Basic res. ETF cBBasI cBK 0.25 1.01 34.60 chF 76.17 -14.7 -27.3<br />
solactive copper Mining Tr Index Tracker VZcMc VT 1.20 1.02 - chF 46.35 -16.1 -<br />
uBs Metals & Minings Index (chF) Tracker MInEn uBs 0.80 1.55 - chF 63.45 -17.2 -29.6<br />
dJ Basic resources Titans 30 Pr Index (Eur) Tracker dJBar cBK 0.00 1.97 - usd 18.55 -20.7 -36.4<br />
Ml uranium sector Basket Tracker Mluru Boa 1.00 0.00 - usd 51.70 -21.9 -55.8<br />
Ml uranium sector Basket Tracker Mlurc Boa 1.00 34.60 - chF 31.15 -22.1 -56.2<br />
s&P global natural resour. Metals & Mining Tracker uBnMM uBs 1.20 1.15 - Eur 16.05 -22.4 -40.6<br />
VT copper strategy Pr Index Tracker VZcIc VT 1.20 0.98 - chF 67.90 -23.5 -<br />
VT copper strategy Pr Index Tracker VZcIE VT 1.20 1.01 - Eur 66.25 -23.5 -<br />
rBs Platinum and Palladium Mining Tr Index Tracker PlPac rBs 1.00 1.26 - chF 20.70 -26.6 -67.7<br />
3y (%)<br />
in Chf<br />
dP-<br />
rating<br />
source: Bloomberg | sIx swiss <strong>Exchange</strong> | derivative Partners
ProducT TaBlEs<br />
EquitiES induStriaLS<br />
ProduCt naME tyPE tiCKEr iSSuEr fEE P.a.<br />
(%)<br />
db x-trackers MscI EM shorT ETF xEMd dB 0.95 0.77 11.71 chF 19.17 -5.0 -<br />
db x-trackers FTsE 100 shorT ETF xuKs dB 0.50 0.52 48.75 chF 9.17 -17.6 -41.7<br />
aMundI ETF shorT Euro sToxx 50 ETF c5s aMdI 0.30 0.26 12.53 Eur 28.36 -17.9 -30.8<br />
comstage ETF Euro sToxx 50 ® ETF cBsx5s cBK 0.35 0.77 14.45 chF 34.09 -18.1 -31.7<br />
db x-trackers Euro sToxx 50 ® shorT ETF xssx dB 0.40 0.41 117.83 chF 33.12 -18.4 -31.9<br />
comstage ETF Euro sToxx 50 ® short ETF cBsx5s cBK 0.35 1.49 14.45 Eur 27.77 -18.7 -31.9<br />
Euro sToxx 50 daily short Index Tracker VZssx VT 0.40 0.56 - Eur 28.20 -18.8 -31.4<br />
comstage ETF cac 40 ® short gr ETF cBcacs cBK 0.35 0.98 2.44 Eur 44.32 -19.4 -<br />
comstage ETF cac 40 ® short gr ETF cBcacs cBK 0.35 1.24 2.44 chF 54.68 -19.4 -<br />
db x-trackers cac 40 ® shorT ETF xc4s dB 0.20 0.41 10.97 chF 53.45 -19.5 -23.6<br />
comstage ETF shortdax ® Tr ETF cBdaxs cBK 0.30 1.00 20.06 chF 53.48 -20.2 -<br />
comstage ETF shortdax ® Tr ETF cBdaxs cBK 0.30 0.31 20.06 Eur 43.31 -20.2 -<br />
db x-trackers shorTdax ® ETF xsdx dB 0.40 0.37 363.23 chF 50.71 -20.3 -39.9<br />
shorTdax ® Tracker daxsh rBs 0.25 0.48 - Eur 4.33 -20.6 -39.0<br />
db x-trackers sMI ® shorT ETF xsVs dB 0.50 0.59 8.66 chF 5.25 -25.6 -<br />
lyxor ETF daily shortdax x2 ETF lYdsd lxr 0.60 0.16 61.76 Eur 16.75 -39.2 -<br />
db x-trackers shorTdax ® x2 ETF xsd2 dB 0.60 0.65 59.42 chF 20.17 -39.7 -<br />
60 ExchangE TradEd ProducTs & IndExIng guIdE <strong>Switzerland</strong> <strong>2013</strong><br />
SPrEad<br />
(%)<br />
auM<br />
(in Mn.)<br />
CCy PriCE<br />
(in tC)<br />
PErforManCE<br />
1y (%)<br />
in Chf<br />
Euro sToxx Industrial goods & services Tracker dJxsT cBK 0.00 0.76 - Eur 49.50 26.4 16.6<br />
comstage ETF sToxx ® Europe 600 Ind. goods & svcs ETF cBgood cBK 0.25 0.80 20.20 chF 71.11 26.4 28.7<br />
comstage ETF sToxx ® Europe 600 Ind. goods & svcs ETF cBgood cBK 0.25 0.31 20.20 Eur 57.66 26.1 29.3<br />
sToxx Europe 600 Industrial goods & services Tracker ETInd uBs 0.00 0.57 - Eur 574.50 26.0 -<br />
s&P homebuilder Index Tracker sPhoM rBs 0.00 1.99 - usd 45.45 25.8 77.3<br />
nYsE arca defense Index Tracker dFIoP gs 0.00 0.76 - chF 183.90 25.2 16.6<br />
sPdr ® MscI Europe Industrials ETF ETF sTQs sTT 0.30 0.49 13.55 chF 124.70 24.6 -<br />
lyxor ETF MscI World Industrials ETF lYIndW lxr 0.40 0.61 66.36 usd 210.32 20.7 -<br />
comstage ETF sToxx ® Europe 600 constr. & Mat. ETF cBcons cBK 0.25 0.77 20.70 chF 58.69 20.2 9.3<br />
sToxx Europe 600 constr. & Materials Tracker ETMaT uBs 0.00 0.59 - Eur 471.25 20.1 -<br />
comstage ETF sToxx ® Europe 600 const. & Mat. ETF cBcons cBK 0.25 0.24 20.70 Eur 47.59 20.0 9.9<br />
rBs global railroads Tr Index Tracker rraIl rBs 1.00 0.00 - usd 169.80 19.6 29.6<br />
dJ Industrial goods and services Titans 30 Tracker dJInd cBK 0.00 1.13 - usd 29.45 16.8 24.9<br />
ZKB MeinIndex nachhaltigkeit Energieeffizienz Tracker TrEFFI ZKB 0.50 0.54 - chF 89'145.00 16.8 -<br />
dJ construction & Materials Titans 30 Tracker dJcon cBK 0.00 2.28 - usd 14.40 16.7 3.2<br />
ZKB MeinIndex nachhaltigkeit Energieeffizienz Tracker TrEFFo ZKB 0.90 0.47 - chF 100.70 16.3 -<br />
Euro sToxx construction & Materials Tracker dJxch cBK 0.00 1.52 - Eur 24.70 15.6 -3.7<br />
lyxor ETF MscI World Materials Tr ETF lYMaTW lxr 0.40 0.60 25.83 usd 266.63 -0.3 -<br />
EquitiES Short<br />
3y (%)<br />
in Chf<br />
dP-<br />
rating<br />
source: Bloomberg | sIx swiss <strong>Exchange</strong> | derivative Partners
ProducT TaBlEs<br />
EquitiES hEaLth CarE<br />
ProduCt naME tyPE tiCKEr iSSuEr fEE P.a. SPrEad (%) auM<br />
(%)<br />
(in Mn.)<br />
comstage ETF sToxx ® Europe 600 Tvl & leisure ETF cBTraV cBK 0.25 1.01 21.39 chF 34.59 35.8 44.2<br />
comstage ETF sToxx ® Europe 600 Tvl & leisure ETF cBTraV cBK 0.25 0.51 21.39 Eur 28.14 35.5 44.8<br />
dJ Media Titans 30 Pr Index (Eur) Tracker dJMEd cBK 0.00 0.96 - usd 39.05 32.8 58.3<br />
comstage ETF sToxx ® Europe 600 Media ETF cBTV cBK 0.25 0.90 20.14 chF 43.45 31.7 31.5<br />
comstage ETF sToxx ® Europe 600 Media ETF cBTV cBK 0.25 0.40 20.14 Eur 35.38 31.4 32.0<br />
Euro sToxx Media Pr Index (Eur) Tracker dJxMa cBK 0.00 1.43 - Eur 16.45 31.1 8.3<br />
lyxor ETF MscI World consumer discretionary ETF lYcodW lxr 0.40 1.21 70.05 usd 182.22 31.0 -<br />
sPdr ® MscI Europe consumer discretionary ETF sTrs sTT 0.30 0.59 9.80 chF 89.60 30.5 -<br />
dJ Euro sToxx retail Index Tracker dJxaa cBK 0.00 1.12 - Eur 33.45 30.1 8.0<br />
dJ retail Titans 30 Pr Index (Eur) Tracker dJrET cBK 0.00 0.85 - usd 38.90 23.1 45.9<br />
dJ Travel & leisure Titans 30 Pr Index (Eur) Tracker dJcoc cBK 0.00 0.90 - usd 32.20 21.5 45.3<br />
comstage ETF sToxx ® Europe 600 retail ETF cBrETa cBK 0.25 0.75 15.18 chF 61.69 18.6 12.2<br />
sToxx Europe 600 retail Tr Index (Eur) Tracker ETrET uBs 0.00 0.55 - Eur 500.00 18.4 -<br />
comstage ETF sToxx ® Europe 600 retail ETF cBrETa cBK 0.25 0.26 15.18 Eur 50.02 18.4 12.7<br />
61 ExchangE TradEd ProducTs & IndExIng guIdE <strong>Switzerland</strong> <strong>2013</strong><br />
CCy PriCE<br />
(in tC)<br />
PErforManCE<br />
1y (%)<br />
in Chf<br />
sxI Bio & Medtech Tr Index Tracker sxBIo uBs 0.40 0.49 - chF 156.50 39.0 24.5<br />
sxI Bio & Medtech Pr Index Tracker sBIon uBs 0.00 0.55 - chF 139.60 35.6 17.5<br />
sxI Bio & Medtech Pr Index Tracker VZsxB VT 0.00 0.55 - chF 140.00 35.6 17.3<br />
nYsE arca Biotechnology Pr Index Tracker aMxoE rBs 2.22 - - chF 171.30 35.5 95.0<br />
sxI life sciences Tr Index Tracker sxlFE uBs 0.40 0.47 - chF 163.00 35.4 23.4<br />
nYsE arca Biotechnology Pr Index Tracker BTKEY uBs 0.60 0.25 - usd 184.90 34.2 64.3<br />
nYsE arca Biotechnology Pr Index Tracker BTKoE rBs 0.00 2.01 - usd 194.95 32.9 67.5<br />
sxI life sciences Pr Index Tracker lIFEs uBs 0.00 0.55 - chF 139.50 32.2 15.8<br />
sPdr ® MscI Europe health care ETF ETF sTWs sTT 0.30 0.35 111.87 chF 107.48 28.0 -<br />
Euro sToxx health care Pr Index (Eur) Tracker dJxTh cBK 0.00 0.62 - Eur 64.45 27.2 49.9<br />
lyxor ETF MscI World health care ETF lYhlTW lxr 0.40 0.90 142.99 usd 183.47 26.6 -<br />
comstage ETF sToxx ® Europe 600 hcare ETF cBhEca cBK 0.25 0.74 65.75 chF 105.29 26.3 46.8<br />
comstage ETF sToxx ® Europe 600 hcare ETF cBhEca cBK 0.25 0.35 65.75 Eur 85.41 26.0 47.4<br />
sToxx Europe 600 health care Tracker EThEa uBs 0.00 0.58 - Eur 850.00 26.0 -<br />
dJ health care Titans 30 Pr Index (Eur) Tracker dJhEc cBK 0.00 0.92 - usd 41.40 25.9 40.5<br />
lyxor ETF sToxx 600 health care ETF lYhlT lxr 0.30 1.23 158.79 Eur 57.58 25.4 38.5<br />
nYsE arca Pharmaceutical Pr Index Tracker drgoE rBs 0.00 1.50 - usd 41.30 18.4 31.6<br />
EquitiES ConSuMEr SErViCES<br />
3y (%)<br />
in Chf<br />
dP-<br />
rating<br />
Quellen: Bloomberg | sIx swiss <strong>Exchange</strong> | derivative Partners
ProducT TaBlEs<br />
EquitiES utiLitiES<br />
ProduCt naME tyPE tiCKEr iSSuEr fEE P.a. SPrEad (%) auM<br />
(%)<br />
(in Mn.)<br />
Euro sToxx Technology Pr Index (Eur) Tracker dJxTE cBK 0.00 1.30 - Eur 26.10 34.2 16.4<br />
sPdr ® MscI Europe Information Technology ETF sTKs sTT 0.30 0.50 9.01 chF 42.59 34.2 -<br />
comstage ETF sToxx ® Europe 600 Technology ETF cBTEch cBK 0.25 0.75 33.96 chF 42.02 33.7 22.4<br />
sToxx Europe 600 Technology Tr Index (Eur) Tracker ETTEc uBs 0.00 0.57 - Eur 339.50 33.4 -<br />
comstage ETF sToxx ® Europe 600 Technol. ETF cBTEch cBK 0.25 0.23 33.96 Eur 34.07 33.4 23.1<br />
solactive lEd Tr Index Tracker lEdusd EFg 1.20 0.30 - usd 127.10 17.4 -<br />
solactive lEd Tr Index Tracker lEdEur EFg 1.20 0.70 - Eur 97.25 17.3 -<br />
rBs smartphone & Tablet Tr Basket (TaBlT) Tracker TaBlT rBs 1.00 0.00 - chF 115.50 12.9 -<br />
dJ Technology Titans 30 Pr Index (Eur) Tracker dJTEh cBK 0.00 0.59 - usd 66.35 10.9 23.7<br />
s&P 500 semiconductors & semicon. Eqpmt. Tracker ETsEM uBs 0.00 0.33 - usd 448.50 10.6 -<br />
s&P 500 Information Technology Tr Index Tracker ETTEs uBs 0.00 0.26 - usd 552.50 9.4 -<br />
lyxor ETF MscI World Information Technology ETF lYTnoW lxr 0.40 0.89 12.13 usd 111.12 8.3 -<br />
EFg solactive online security Perform. Index Tracker WWWEur lEon 1.20 0.35 - Eur 131.10 8.2 -<br />
EFg solactive online security Perform. Index Tracker WWWchF lEon 1.20 0.33 - chF 161.20 8.2 -<br />
62 ExchangE TradEd ProducTs & IndExIng guIdE <strong>Switzerland</strong> <strong>2013</strong><br />
CCy PriCE<br />
(in tC)<br />
PErforManCE<br />
1y (%)<br />
in Chf<br />
rBs Water Tr Index Tracker WaTus rBs 1.00 1.00 - usd 183.00 18.3 35.9<br />
rBs Water Tr Index Tracker WaToE rBs 1.00 0.95 - Eur 174.80 18.2 35.6<br />
rBs Water Tr Index Tracker WaTch rBs 1.00 1.05 - chF 138.70 18.1 35.8<br />
s&P global Water Tr Index (usd) Tracker aQuEu gs 1.00 0.00 - Eur 24.60 16.5 29.1<br />
s&P global Water Tr Index (usd) Tracker aQuus gs 1.00 0.00 - usd 35.00 16.3 29.0<br />
ZKB MeinIndex nachhaltigkeit Wasser Tracker TrWasI ZKB 0.50 0.48 - chF 119'110.00 14.8 -<br />
ZKB MeinIndex nachhaltigkeit Wasser Tracker TrWaso ZKB 0.90 0.45 - chF 128.20 14.5 -<br />
rBs Water stocks Tr Index (usd) Tracker Wasch rBs 1.00 1.00 - chF 145.29 14.3 31.8<br />
rBs Water stocks Tr Index (usd) Tracker WasEu rBs 1.00 1.01 - Eur 182.70 14.3 31.5<br />
ishares global Water ucITs ETF ETF Ih2o Ish 0.65 0.52 153.70 usd 27.64 13.5 23.2<br />
lyxor ETF World Water ETF lYWaT lxr 0.60 0.71 70.57 Eur 20.64 12.4 21.9<br />
lyxor ETF MscI World utilities ETF lYuTlW lxr 0.40 1.51 15.61 usd 162.37 4.9 -<br />
sPdr ® MscI Europe utilities ETF ETF sTus sTT 0.30 0.49 12.61 chF 85.76 4.8 -<br />
comstage ETF sToxx ® Europe 600 utilities ETF cBuTIl cBK 0.25 0.75 37.55 chF 71.64 4.5 -5.8<br />
comstage ETF sToxx ® Europe 600 utilities ETF cBuTIl cBK 0.25 0.26 37.55 Eur 58.37 4.1 -5.4<br />
sToxx Europe 600 utilities Tr Index (Eur) Tracker ETuTI uBs 0.00 0.51 - Eur 574.00 3.4 -<br />
dJ utilities Titans 30 Pr Index (Eur) Tracker dJuTI cBK 0.00 2.41 - usd 9.97 -1.6 -15.8<br />
Euro sToxx utilities Pr Index (Eur) Tracker dJxTY cBK 0.00 1.83 - Eur 21.45 -4.7 -34.6<br />
EquitiES tEChnoLogy<br />
3y (%)<br />
in Chf<br />
dP-<br />
rating<br />
source: Bloomberg | sIx swiss <strong>Exchange</strong> | derivative Partners
ProducT TaBlEs<br />
EquitiES finanCiaLS<br />
ProduCt naME tyPE tiCKEr iSSuEr fEE P.a. SPrEad (%) auM<br />
(%)<br />
(in Mn.)<br />
63 ExchangE TradEd ProducTs & IndExIng guIdE <strong>Switzerland</strong> <strong>2013</strong><br />
CCy PriCE<br />
(in tC)<br />
PErforManCE<br />
1y (%)<br />
in Chf<br />
ToPIx Banks Index Tracker TPBnK rBs 3.08 - - chF 15.00 63.9 -<br />
Euro sToxx Insurance Pr Index Tracker dJxIc cBK 0.00 1.87 - Eur 17.35 42.2 17.5<br />
dJ Financial services Titans 30 Pr Index Tracker dJFIs cBK 0.00 1.13 - usd 29.20 40.7 40.2<br />
comstage ETF sToxx ® Europe 600 Insurance ETF cBIns cBK 0.25 0.74 33.00 chF 41.58 39.4 39.8<br />
comstage ETF sToxx ® Europe 600 Insurance ETF cBIns cBK 0.25 0.25 33.00 Eur 33.76 39.1 40.5<br />
sToxx Europe 600 Insura. net return Index Tracker ETIns uBs 0.00 0.56 - Eur 334.25 39.0 39.4<br />
solactive European good Banks Tr Index Tracker VZgBc VT 1.20 1.01 - chF 74.95 35.0 -10.6<br />
solactive European good Banks Tr Index Tracker VZgBE VT 1.20 0.98 - Eur 87.35 35.0 -10.5<br />
comstage ETF sToxx ® Europe 600 Fin svs ETF cBFIn cBK 0.25 0.89 24.48 chF 66.61 33.2 27.9<br />
comstage ETF sToxx ® Europe 600 Fin svs ETF cBFIn cBK 0.25 0.75 24.48 Eur 54.10 32.9 28.3<br />
dJ Insurance Titans 30 Pr Index (Eur) Tracker dJIns cBK 0.00 0.24 - usd 20.10 32.2 20.9<br />
sPdr ® MscI Europe Financials ETF ETF sTZs sTT 0.30 0.49 45.54 chF 46.74 30.9 -<br />
lyxor ETF MscI World Financials Tr ETF lYFInW lxr 0.40 1.21 31.97 usd 122.05 29.0 -<br />
aMundI ETF MscI World FInancIals ETF cWFusd aMdI 0.35 0.37 57.61 usd 122.51 28.7 -<br />
comstage ETF sToxx ® Europe 600 Banks ETF cBBanK cBK 0.25 0.81 42.36 chF 40.37 28.3 -15.9<br />
comstage ETF sToxx ® Europe 600 Banks ETF cBBanK cBK 0.25 0.30 42.36 Eur 32.73 28.0 -15.5<br />
lyxor ETF sToxx 600 Banks ETF lYBnK lxr 0.30 0.64 449.58 Eur 17.12 27.9 -19.6<br />
sToxx Europe 600 Banks net return Index Tracker ETBan uBs 0.00 0.55 - Eur 327.00 27.9 -<br />
dJ Banks Titans 30 Pr Index (Eur) Tracker dJBaK cBK 0.00 2.05 - usd 7.19 26.8 0.6<br />
Euro sToxx Financial services Pr Index Tracker dJxII cBK 0.00 1.58 - Eur 23.35 22.4 4.8<br />
Euro sToxx Banks Pr Index (Eur) Tracker dJxBa cBK 0.00 3.56 - Eur 10.30 17.6 -43.8<br />
comstage ETF sToxx ® Europe 600 r. Estate ETF cBhous cBK 0.25 0.81 13.98 chF 23.43 17.3 34.7<br />
comstage ETF sToxx ® Europe 600 r. Estate ETF cBhous cBK 0.25 0.30 13.98 Eur 19.09 17.2 35.2<br />
solactive Top Invest. grade Perform. Index Tracker VZTIE VT 1.20 0.98 - Eur 131.10 16.8 -<br />
solactive Top Invest. grade Perform. Index Tracker VZTIc VT 1.20 0.97 - chF 132.10 16.7 -<br />
lyxor ETF FTsE EPra/narEIT dvlpd. Europe ETF lYMEh lxr 0.40 0.82 8.89 Eur 29.65 11.8 17.7<br />
lyxor ETF FTsE EPra/narEIT glbl dvlpd. ETF lYMWo lxr 0.45 1.23 38.07 usd 17.87 11.1 24.5<br />
ishares European Property Yield ETF IPrP Ish 0.00 0.30 624.28 chF 31.94 10.1 10.1<br />
lyxor ETF FTsE EPra/narEIT us ETF lYMua lxr 0.40 0.71 42.49 usd 18.06 6.7 33.0<br />
uBs-Index solutions - sxI real Estate ETF srFcha uBs 0.36 0.80 7.78 chF 25.26 -5.1 -<br />
uBs-Index solutions - sxI real Estate ETF srFchI uBs 0.20 0.79 7.78 chF 12'340.00 -5.5 -<br />
uBs-Index solutions - sxI real Estate Fnd ETF srEchI uBs 0.20 0.79 269.52 chF 49'310.00 -7.0 3.3<br />
uBs-Index solutions - sxI real Estate Fnd ETF srEcha uBs 0.36 0.70 269.52 chF 48.82 -7.3 1.6<br />
3y (%)<br />
in Chf<br />
dP-<br />
rating<br />
source: Bloomberg | sIx swiss <strong>Exchange</strong> | derivative Partners
ProducT TaBlEs<br />
EquitiES rEaL EStatE<br />
ProduCt naME tyPE tiCKEr iSSuEr fEE P.a.<br />
(%)<br />
lyxor ETF MscI World Teleco. svs ETF lYTElW lxr 0.40 0.60 22.59 usd 93.33 11.0 -<br />
dJ Telecommu. Titans 30 Pr Index (Eur) Tracker dJTEM cBK 0.00 1.17 - usd 24.80 6.3 11.1<br />
comstage ETF sToxx ® Europe 600 Teleco. ETF cBTElE cBK 0.25 0.80 30.19 chF 61.78 5.5 7.2<br />
comstage ETF sToxx ® Europe 600 Teleco. ETF cBTElE cBK 0.25 0.99 30.19 Eur 50.09 4.9 7.3<br />
sPdr ® MscI Europe Telecommu. services ETF sTTs sTT 0.30 0.65 5.79 chF 54.45 4.8 -<br />
lyxor ETF sToxx 600 Telecommunications ETF lYTEl lxr 0.30 1.24 71.92 Eur 26.17 4.7 -4.1<br />
sToxx Europe 600 Telecommunications Tracker ETTEl uBs 0.00 0.58 - Eur 496.00 4.7 -<br />
Euro sToxx Telecommu. Pr Index (Eur) Tracker dJxcM cBK 0.00 0.63 - Eur 22.85 -10.9 -38.9<br />
64 ExchangE TradEd ProducTs & IndExIng guIdE <strong>Switzerland</strong> <strong>2013</strong><br />
SPrEad<br />
(%)<br />
auM<br />
(in Mn.)<br />
CCy PriCE<br />
(in tC)<br />
PErforManCE<br />
1y (%)<br />
in Chf<br />
rBs Emirates real Estate Tr Index Tracker EMIra rBs 0.75 - - chF 40.20 45.2 30.6<br />
gPr/rBs asiaPacific Top Property Tr Index Tracker gPraP rBs 1.00 2.18 - usd 28.65 29.2 -<br />
comstage ETF sToxx ® Europe 600 real Estate ETF cBhous cBK 0.25 0.81 13.98 chF 23.43 17.3 34.7<br />
comstage ETF sToxx ® Europe 600 real Estate ETF cBhous cBK 0.25 0.30 13.98 Eur 19.09 17.2 35.2<br />
db x-trackers FTsE EPra/narEIT dev. Europe r.Estate ETF xdEr dB 0.40 0.41 164.53 chF 18.40 16.5 -<br />
ishares uK Property ucITs ETF ETF IuKP Ish 0.40 0.28 466.88 chF 6.64 16.3 26.0<br />
lyxor ETF FTsE EPra/narEIT dev. Europe ETF lYMEh lxr 0.40 0.82 8.89 Eur 29.65 11.8 17.7<br />
lyxor ETF FTsE EPra/narEIT glbl devlpd. ETF lYMWo lxr 0.45 1.23 38.07 usd 17.87 11.1 24.5<br />
VT rEITs low Volatility Performance Index Tracker VrEIT VT 1.20 0.98 - Eur 152.60 10.4 25.0<br />
ishares asia Property Yield ucITs ETF ETF IasP Ish 0.59 0.40 174.70 usd 24.78 10.2 8.7<br />
ishares European Property Yield ucITs ETF ETF IPrP Ish 0.00 0.30 624.28 chF 31.94 10.1 10.1<br />
Vontobel Best of real Estate Funds Index Tracker VZBoI VT 0.75 1.61 - Eur 50.10 8.6 9.3<br />
gPr/rBs china Prop. Tracker gPrch rBs 1.00 2.04 - usd 107.70 8.2 -<br />
ishares developed Markets Property Yield ETF IWdP Ish 0.59 0.31 1629.21 usd 21.99 6.9 20.7<br />
lyxor ETF FTsE EPra/narEIT united states ETF lYMua lxr 0.40 0.71 42.49 usd 18.06 6.7 33.0<br />
gPr/rBs us Top 30 rEIT Prop. Tracker gPrus rBs 1.00 - - usd 41.35 5.8 47.0<br />
ishares us Property Yield ucITs ETF ETF IusP Ish 0.40 0.16 479.35 usd 23.79 5.6 30.1<br />
sara Immo select II Basket Tracker IMosEl sara 1.00 0.70 - chF 98.25 -3.7 -<br />
ZKB Immobilien Fonds Tracker IMFon ZKB 0.60 0.59 - chF 148.80 -4.1 13.8<br />
sWx Immofondsindex Tr Tracker IMMIT ZKB 0.30 0.27 - chF 266.75 -4.4 12.1<br />
uBs-Index solutions - sxI real Estate ETF a ETF srFcha uBs 0.36 0.80 7.78 chF 25.26 -5.1 -<br />
uBs-Index solutions - sxI real Estate ETF I ETF srFchI uBs 0.20 0.79 7.78 chF 12'340.00 -5.5 -<br />
VT swiss Immo shares Tracker rZIMo VT 0.90 1.49 - chF 149.90 -5.8 12.8<br />
uBs-Index solutions - sxI real Estate Fnd. ETF srEchI uBs 0.20 0.79 269.52 chF 49'310.00 -7.0 3.3<br />
uBs-Index solutions - sxI real Estate Fnd. ETF srEcha uBs 0.36 0.70 269.52 chF 48.82 -7.3 1.6<br />
EquitiES tELECoMMuniCationS<br />
3y (%)<br />
in Chf<br />
dP-<br />
rating<br />
source: Bloomberg | sIx swiss <strong>Exchange</strong> | derivative Partners
ProducT TaBlEs<br />
EquitiES SuStainabiLity<br />
ProduCt naME tyPE tiCKEr iSSuEr fEE P.a.<br />
(%)<br />
65 ExchangE TradEd ProducTs & IndExIng guIdE <strong>Switzerland</strong> <strong>2013</strong><br />
SPrEad<br />
(%)<br />
auM<br />
(in Mn.)<br />
CCy PriCE<br />
(in tC)<br />
PErforManCE<br />
1y (%)<br />
in Chf<br />
ardour glbl. alternat. Energy Extra liquid Tracker PoWEr uBs 1.20 0.75 - chF 30.30 44.3 -<br />
ZKB MeinIndex nachhaltigkeit solar Tracker TrsolI ZKB 0.50 0.37 - chF 47'950.00 43.7 -<br />
ZKB MeinIndex nachhaltigkeit solar Tracker Trsolo ZKB 0.90 0.23 - chF 38.10 42.4 -<br />
ZKB MeinIndex nachhaltigkeit Wind Tracker TrWInI ZKB 0.50 0.23 - chF 58590.00 36.1 -<br />
ZKB MeinIndex nachhaltigkeit Wind Tracker TrWIno ZKB 0.90 0.34 - chF 39.80 34.7 -<br />
VT Klimaschutz Index Tracker KlIMa VT 1.60 1.02 - chF 30.35 32.5 -39.6<br />
daxglobal sarasin sustainability germany Tracker dadEs sara 0.00 0.97 - Eur 138.10 26.3 13.6<br />
sara daxglobal substainability switzerland Tracker dachs sara 0.00 0.49 - chF 177.50 25.4 15.1<br />
Euro sToxx sustainability 40 Pr Index Tracker BssuBE sara 0.00 0.74 - Eur 1'044.00 23.9 -<br />
ZKB MeinIndex nachhaltigkeit Energieerz. Tracker TrErZI ZKB 0.50 0.43 - chF 91'710.00 21.4 -<br />
ZKB MeinIndex nachhaltigkeit Energieerz. Tracker TrErZo ZKB 0.90 0.40 - chF 74.25 20.1 -<br />
ZKB MeinIndex nachhaltigkeit Mobilität Tracker TrMoBI ZKB 0.50 0.55 - chF 104'385.00 19.4 -<br />
ZKB MeinIndex nachhaltigkeit ressourcen Tracker TrrEsI ZKB 0.50 0.49 - chF 116'745.00 19.3 -<br />
ishares global clean Energy ucITs ETF ETF Inrg Ish 0.65 0.55 77.29 usd 5.10 19.2 -47.6<br />
ZKB MeinIndex nachhaltigkeit Mobilität Tracker TrMoBo ZKB 0.90 0.49 - chF 116.30 18.9 -<br />
ZKB MeinIndex nachhaltigkeit Mobilität Tracker TrMoBr ZKB 0.90 0.57 - chF 116.10 18.8 -<br />
ZKB MeinIndex nachhaltigkeit ressourcen Tracker TrrEso ZKB 0.90 0.45 - chF 128.50 18.7 -<br />
rBs Water Tr Index Tracker WaTus rBs 1.00 1.00 - usd 183.00 18.3 35.9<br />
rBs Water Tr Index Tracker WaToE rBs 1.00 0.95 - Eur 174.80 18.2 35.6<br />
rBs Water Tr Index Tracker WaTch rBs 1.00 1.05 - chF 138.70 18.1 35.8<br />
s&P global Eco Tr Index (usd) Tracker grEus gs 1.00 0.00 - usd 19.10 17.0 5.7<br />
s&P global Eco Tr Index (Eur) Tracker grEEu gs 1.00 0.00 - Eur 17.20 17.0 6.4<br />
ZKB MeinIndex nachhaltigkeit Energieeff. Tracker TrEFFI ZKB 0.50 0.54 - chF 89'145.00 16.8 -<br />
s&P global Eco Tr Index (Eur) Tracker grEch gs 1.00 0.23 - chF 20.75 16.6 6.1<br />
s&P global Water Tr Index (usd) Tracker aQuEu gs 1.00 0.00 - Eur 24.60 16.5 29.1<br />
s&P global Water Tr Index (usd) Tracker aQuus gs 1.00 0.00 - usd 35.00 16.3 29.0<br />
ZKB MeinIndex nachhaltigkeit Energieeff. Tracker TrEFFo ZKB 0.90 0.47 - chF 100.70 16.3 -<br />
ZKB sustainability Basket Tracker roThs ZKB 1.60 0.52 - Eur 55'185.00 16.2 9.0<br />
sToxx Europe sustainability 40 Tracker BssuBP sara 0.00 0.68 - Eur 989.00 16.0 -<br />
ZKB MeinIndex nachhaltigkeit Wasser Tracker TrWasI ZKB 0.50 0.48 - chF 119'110.00 14.8 -<br />
ZKB MeinIndex nachhaltigkeit Wasser Tracker TrWaso ZKB 0.90 0.45 - chF 128.20 14.5 -<br />
rBs Water stocks Tr Index (usd) Tracker Wasch rBs 1.00 1.00 - chF 145.29 14.3 31.8<br />
rBs Water stocks Tr Index (usd) Tracker WasEu rBs 1.00 1.01 - Eur 182.70 14.3 31.5<br />
Barclays capital green chips Tracker BcBPs Barc 1.00 1.09 - Eur 8.02 13.8 -<br />
ZKB MeinIndex nachhaltigkeit Pazifik Tracker TrPaZI ZKB 0.50 0.42 - chF 115'185.00 13.1 -<br />
ZKB MeinIndex nachhaltigkeit Pazifik Tracker TrPaZo ZKB 0.90 0.59 - chF 114.40 12.2 -<br />
rBs Eco Tr Index Tracker EcoIn rBs 1.00 1.03 - chF 91.80 9.9 -<br />
ZKB MeinIndex nachhaltigkeit EmMa Tracker TrEMMI ZKB 0.50 0.61 - chF 112'385.00 9.7 -<br />
ZKB MeinIndex nachhaltigkeit EmMa Tracker TrEMMo ZKB 0.90 0.61 - chF 111.60 9.3 -<br />
ishares global alternative Energy ETF csaE Ish 0.57 0.98 19.96 usd 43.47 8.8 -<br />
3y (%)<br />
in Chf<br />
dP-<br />
rating<br />
source: Bloomberg | sIx swiss <strong>Exchange</strong> | derivative Partners
ProducT TaBlEs<br />
EquitiES diVidEnd StratEgiES<br />
ProduCt naME tyPE tiCKEr iSSuEr fEE P.a.<br />
(%)<br />
66 ExchangE TradEd ProducTs & IndExIng guIdE <strong>Switzerland</strong> <strong>2013</strong><br />
SPrEad<br />
(%)<br />
auM<br />
(in Mn.)<br />
CCy PriCE<br />
(in tC)<br />
PErforManCE<br />
1y (%)<br />
in Chf<br />
comstage ETF divdax ® Tr ETF cBddax cBK 0.25 0.24 22.50 Eur 19.74 25.1 -<br />
comstage ETF divdax ® Tr ETF cBddax cBK 0.25 1.27 22.50 chF 24.21 25.0 -<br />
dJ switzerland select dividend Tr 15 Index Tracker sWdIV uBs 0.40 0.58 - chF 115.50 23.4 -<br />
dJ sWx select dividend 20 Index Tracker sMInd sara 0.00 0.94 - chF 163.40 22.8 17.7<br />
uBs global Quality dividend Payers Tr Index Tracker dIVQd uBs 1.00 0.77 - usd 185.10 20.4 -<br />
uBs global Quality dividend Payers Tr Index Tracker dIVQc uBs 1.00 0.74 - chF 143.10 20.3 -<br />
uBs global Quality dividend Payers Tr Index Tracker dIVQE uBs 1.00 0.78 - Eur 185.30 19.9 -<br />
sPdr ® s&P us dividend aristocrats ucITs ETF ETF usdV sTT 0.35 0.22 1'355.78 chF 31.24 19.9 -<br />
dJ germany select dividend 20 distributing Index Tracker dEdIV uBs 0.75 0.92 - Eur 31.45 19.8 -<br />
ishares uK dividend ucITs ETF ETF IuKd Ish 0.00 1.43 642.90 chF 11.86 15.0 8.3<br />
comstage ETF Euro sToxx ® select dividend 30 ETF cBsdIV cBK 0.25 0.75 84.40 chF 31.56 10.8 -3.3<br />
comstage ETF Euro sToxx ® select dividend 30 ETF cBsdIV cBK 0.25 0.26 84.40 Eur 25.67 10.6 -2.8<br />
Euro sToxx select dividend 30 Tr Index (Eur) Tracker VZEsd VT 0.30 0.97 - Eur 24.50 10.1 -4.9<br />
dJ global select dividend Tr Index Tracker glodIV uBs 1.00 0.98 - usd 43.80 9.7 -<br />
dJ stoxx Eu Enlarged select dividend 15 Tr Index Tracker dJEnl rBs 0.75 - - Eur 26.55 9.4 -11.4<br />
lyxor ETF Euro sToxx 50 dividends ETF dIV lxr 0.70 1.01 14.57 Eur 102.12 9.3 -<br />
db x-trackers sToxx ® glbl. sel. div. 100 ETF xgsd dB 0.50 0.44 306.62 chF 27.43 5.6 3.6<br />
Euro sToxx select dividend 30 Pr Index (Eur) Tracker sToxd sara 0.00 0.66 - Eur 14.50 5.0 -16.4<br />
dJ asia selct dividend Tracker dJasd rBs 0.75 - - usd 111.85 4.9 -<br />
dJ asia select dividends 30 Tr Index Tracker aPdIV uBs 1.00 0.99 - usd 116.10 4.4 -<br />
db x-trackers Euro sToxx ® sel. div. 30 ETF xdIE dB 0.30 0.76 65.63 chF 18.15 4.3 -9.7<br />
dJ Europe select dividend 30 distributing Index Tracker EudIV uBs 0.75 1.17 - Eur 20.75 2.4<br />
ishares Euro dividend ucITs ETF ETF IdVY Ish 0.00 0.25 320.61 chF 18.75 0.3 -20.4<br />
lyxor ETF sToxx select dividend 30 ETF lYsEl lxr 0.30 0.23 81.43 Eur 13.12 -1.7 -16.5<br />
sPdr ® s&P Emerging Markets dividend ucITs ETF ETF EMdV sTT 0.65 0.69 87.00 chF 19.30 -13.4 -<br />
3y (%)<br />
in Chf<br />
dP-<br />
rating<br />
source: Bloomberg | sIx swiss <strong>Exchange</strong> | derivative Partners
ProducT TaBlEs<br />
CoMModitiES (aLL StratEgiES)<br />
ProduCt naME tyPE tiCKEr iSSuEr fEE P.a.<br />
(%)<br />
67 ExchangE TradEd ProducTs & IndExIng guIdE <strong>Switzerland</strong> <strong>2013</strong><br />
SPrEad<br />
(%)<br />
auM<br />
(in Mn.)<br />
CCy PriCE<br />
(in tC)<br />
PErforManCE<br />
1y (%)<br />
in Chf<br />
rBs certificate on nYBoT orange Juice a Tracker oranQ rBs 1.77 2.94 - chF 0.57 39.0 9.6<br />
IcE Frozen concentrated orange Juice FM Tracker orang rBs 0.00 2.17 - usd 0.81 26.6 -2.4<br />
IcE Frozen concentrated orange Juice FM Tracker oraoE rBs 0.00 1.31 - usd 13.50 26.3 -1.6<br />
uBs Bloomberg cMcI gasoline hedged Tracker ExBcI uBs 0.52 0.80 - Eur 1'741.00 25.2 45.3<br />
uBs Bloomberg cMcI gasoil Tr Index Tracker TxBcI uBs 0.40 0.81 - usd 1'835.00 22.5 39.7<br />
uBs Bloomberg cMcI gasoline hedged Tracker cxBcI uBs 0.84 0.83 - chF 1'678.00 22.3 55.2<br />
uBs Bloomberg cMcI cotton hedged Tracker EcTcI uBs 0.58 0.82 - Eur 1'426.00 20.7 47.8<br />
uBs Bloomberg cMcI soybean Meal Tracker TsMcI uBs 0.53 0.79 - usd 3'167.00 20.0 70.8<br />
rIcI Enhanced soybean Meal Tr Index Tracker rIcag rBs 0.85 0.67 - usd 136.10 19.7 -<br />
IcE Brent crude oil Front Month Future Tracker lcoEE gs 0.00 0.00 - Eur 88.20 19.7 46.1<br />
nYMEx unleaded gasoline FM Tracker gasQa rBs 1.61 0.00 - chF 17.90 19.2 80.7<br />
nYMEx unleaded gasoline FM Tracker gaZou rBs n.a. 0.81 - usd 22.15 18.0 53.1<br />
uBs Bloomberg cMcI cotton Tracker TcTcI uBs 0.46 0.80 - usd 1'461.00 17.8 41.4<br />
uBs Bloomberg cMcI cotton hedged Tracker ccTcI uBs 0.90 0.79 - chF 1'350.00 17.6 56.5<br />
cBoT soybean Meal Front Month Future Tracker soYME rBs 0.00 0.38 - usd 62.20 16.9 56.5<br />
IcE Brent crude oil Front Month Future Tracker lcoEu gs 0.00 0.24 - usd 78.50 16.4 37.7<br />
IcE Brent crude oil Front Month Future Tracker BcooE rBs n.a. 0.99 - usd 9.70 15.9 35.8<br />
IcE Brent crude oil Front Month Future Tracker oIloE rBs n.a. 0.47 - usd 6.16 15.8 35.9<br />
nYMEx WTI crude oil Front Month Future Tracker cloEE gs 0.00 0.00 - Eur 54.00 15.2 -4.8<br />
s&P gscI Brent crude oil a18 strategy Tracker BrQEu gs 1.00 0.21 - Eur 179.90 14.8 27.1<br />
db Brent crude oil Booster Euro hedged ETP xETc dB 0.45 0.30 69.98 Eur 122.82 14.7 -<br />
s&P gscI Brent crude oil a18 strategy Tracker Brusd gs 1.00 0.20 - usd 194.30 13.8 26.2<br />
s&P gscI crude oil Er Index Tracker gsoEl gs 0.75 0.62 - Eur 4.48 13.3 -8.7<br />
JPM commodity curve cotton Tr Index Tracker ETccTu VT 1.00 1.45 - usd 53.80 13.2 -<br />
uBs Bloomberg cMcI Brent crude oil hedged Tracker EcocI uBs 0.42 0.74 - Eur 1'449.00 13.1 26.5<br />
s&P gscI Brent crude oil Enhanced TBill secured ETP BoIl sou 0.49 0.42 0.25 usd 162.79 13.1 -<br />
s&P gscI Petroleum Er Index Tracker gsoEc gs 0.75 0.48 - Eur 58.95 12.9 9.2<br />
uBs Bloomberg cMcI 1Y Brent crude oil Tracker Tco3M uBs 0.30 0.68 - usd 1'411.00 12.8 28.0<br />
IcE cotton no. 2 Front Month Future Tracker coTTo rBs n.a. 1.33 - usd 4.40 12.7 50.3<br />
uBs Bloomberg cMcI Energy hedged Tracker EEncI uBs 0.52 0.81 - Eur 940.50 12.6 -0.4<br />
s&P gscI Energy Er Index Tracker gsoEI gs 0.75 0.37 - Eur 25.55 12.6 2.6<br />
nYMEx WTI crude oil Front Month Future Tracker WTIoE rBs 1.00 0.47 - usd 5.90 12.4 -8.3<br />
nYMEx WTI crude oil Front Month Future Tracker lsoIl rBs n.a. 0.92 - usd 3.01 12.3 -8.6<br />
IcE cotton no. 2 Front Month Future Tracker coToE rBs n.a. 0.87 - usd 11.25 12.1 49.4<br />
nYMEx WTI crude oil Front Month Future Tracker cloEu gs 0.00 0.45 - usd 41.50 12.1 -10.3<br />
uBs Bloomberg cMcI 1Y WTI crude oil Tracker Tcl6M uBs 0.30 0.93 - usd 1'330.00 11.8 0.1<br />
uBs Bloomberg cMcI 1Y WTI crude oil Tracker Tcl3M uBs 0.30 0.90 - usd 1'034.00 11.8 -7.3<br />
uBs Bloomberg cMcI lead hedged Tracker EllcI uBs 0.49 0.81 - Eur 1'245.00 11.8 5.8<br />
db Brent crude oil Booster chF hedged ETP xcTT dB 0.45 0.39 1.02 chF 98.85 11.7 -<br />
uBs Bloomberg cMcI WTI crude oil hedged Tracker EclcI uBs 0.42 0.89 - Eur 1'170.00 11.6 -0.4<br />
3y (%)<br />
in Chf<br />
dP-<br />
rating<br />
source: Bloomberg | sIx swiss <strong>Exchange</strong> | derivative Partners
ProducT TaBlEs<br />
CoMModitiES EnErgy<br />
ProduCt naME tyPE tiCKEr iSSuEr fEE P.a.<br />
(%)<br />
68 ExchangE TradEd ProducTs & IndExIng guIdE <strong>Switzerland</strong> <strong>2013</strong><br />
SPrEad<br />
(%)<br />
auM<br />
(in Mn.)<br />
CCy PriCE<br />
(in tC)<br />
PErforManCE<br />
1y (%)<br />
in Chf<br />
uBs Bloomberg cMcI gasoline hedged Tracker ExBcI uBs 0.52 0.80 - Eur 1'741.00 25.2 45.3<br />
uBs Bloomberg cMcI gasoil Tracker TxBcI uBs 0.40 0.81 - usd 1'835.00 22.5 39.7<br />
uBs Bloomberg cMcI gasoline hedged Tracker cxBcI uBs 0.84 0.83 - chF 1'678.00 22.3 55.2<br />
IcE Brent crude oil Front Month Future Tracker lcoEE gs 0.00 0.00 - Eur 88.20 19.7 46.1<br />
nYMEx unleaded gasoline FM Future Tracker gasQa rBs 1.61 0.00 - chF 17.90 19.2 80.7<br />
nYMEx unleaded gasoline FM Future Tracker gaZou rBs n.a. 0.81 - usd 22.15 18.0 53.1<br />
IcE Brent crude oil FM Future Tracker lcoEu gs 0.00 0.24 - usd 78.50 16.4 37.7<br />
IcE Brent crude oil FM Future Tracker BcooE rBs n.a. 0.99 - usd 9.70 15.9 35.8<br />
IcE Brent crude oil FM Future Tracker oIloE rBs n.a. 0.47 - usd 6.16 15.8 35.9<br />
nYMEx WTI crude oil FM Future Tracker cloEE gs 0.00 0.00 - Eur 54.00 15.2 -4.8<br />
s&P gscI Brent crude oil Tr a18 strategy Index Tracker BrQEu gs 1.00 0.21 - Eur 179.90 14.8 27.1<br />
db Brent crude oil Booster Euro hedged ETc ETP xETc dB 0.45 0.30 69.98 Eur 122.82 14.7 -<br />
s&P gscI Brent crude oil Tr a18 strategy Index Tracker Brusd gs 1.00 0.20 - usd 194.30 13.8 26.2<br />
s&P gscI crude oil Er Index Tracker gsoEl gs 0.75 0.62 - Eur 4.48 13.3 -8.7<br />
uBs Bloomberg cMcI Brent crude oil hedged Tr Index Tracker EcocI uBs 0.42 0.74 - Eur 1'449.00 13.1 26.5<br />
s&P gscI Brent crude oil Enhanced Bill secured source ETP BoIl sou 0.49 0.42 0.25 usd 162.79 13.1 -<br />
s&P gscI Petroleum Er Index Tracker gsoEc gs 0.75 0.48 - Eur 58.95 12.9 9.2<br />
uBs Bloomberg cMcI 1Y Brent crude oil Tr Index Tracker Tco3M uBs 0.30 0.68 - usd 1'411.00 12.8 28.0<br />
uBs Bloomberg cMcI Energy hedged Tr Index Tracker EEncI uBs 0.52 0.81 - Eur 940.50 12.6 -0.4<br />
s&P gscI Energy Er Index Tracker gsoEI gs 0.75 0.37 - Eur 25.55 12.6 2.6<br />
nYMEx WTI crude oil Front Month Future Tracker WTIoE rBs 1.00 0.47 - usd 5.90 12.4 -8.3<br />
nYMEx WTI crude oil Front Month Future Tracker lsoIl rBs n.a. 0.92 - usd 3.01 12.3 -8.6<br />
nYMEx WTI crude oil Front Month Future Tracker cloEu gs 0.00 0.45 - usd 41.50 12.1 -10.3<br />
uBs Bloomberg cMcI 1Y WTI crude oil Tr Index Tracker Tcl6M uBs 0.30 0.93 - usd 1'330.00 11.8 0.1<br />
uBs Bloomberg cMcI 1Y WTI crude oil Tr Index Tracker Tcl3M uBs 0.30 0.90 - usd 1'034.00 11.8 -7.3<br />
db Brent crude oil Booster chF hedged ETc ETP xcTT dB 0.45 0.39 1.02 chF 98.85 11.7 -<br />
uBs Bloomberg cMcI WTI crude oil hedged Tr Index Tracker EclcI uBs 0.42 0.89 - Eur 1'170.00 11.6 -0.4<br />
s&P gscI light sweet crude oil WTI a1 strategy Index Tracker oIlEu gs 1.50 0.51 - Eur 128.30 11.6 -6.9<br />
uBs Bloomberg cMcI 1Y Brent crude oil Tr Index Tracker Tco6M uBs 0.30 0.68 - usd 1'568.00 11.3 23.6<br />
s&P gscI crude oil Tr Index Tracker gsTro gs 1.40 0.74 - usd 12.55 11.2 -10.4<br />
s&P gscI light sweet crude oil WTI Tr a1 strategy Index Tracker oIlEn gs 1.50 0.56 - usd 165.80 11.0 -7.8<br />
s&P gscI Petroleum Tr Index Tracker gsTrP gs 0.90 0.42 - usd 22.45 11.0 5.4<br />
s&P gscI Enhanced crude oil TBill secured ETP sEWTI sou 0.49 0.23 16.70 usd 167.84 10.8 -<br />
uBs Bloomberg cMcI 1Y Brent crude oil Tr Index Tracker TcocI uBs 0.30 0.70 - usd 1537.00 10.8 22.4<br />
uBs-Index solutions - cMcI oil ETF ETF oIlEua uBs 0.00 0.92 13.86 Eur 53.45 10.6 -<br />
JPM commodity curve Brent crude Tr Index Tracker ETcBcE VT 1.00 0.85 - Eur 91.10 10.6 -<br />
s&P gscI Energy Tr Index Tracker gsTrB gs 1.40 0.98 - usd 9.65 10.5 -0.9<br />
uBs Bloomberg cMcI Brent crude oil hedged Tracker ccocI uBs 0.72 0.70 - chF 1'391.00 10.4 35.4<br />
db s&P gscI Energy ETc ETP xET8 dB 0.45 0.61 15.02 usd 115.70 10.3 -<br />
uBs Bloomberg cMcI Energy Tr Index (usd) Tracker TEncI uBs 0.40 0.87 - usd 987.00 10.2 -4.3<br />
3y (%)<br />
in Chf<br />
dP-<br />
rating<br />
source: Bloomberg | sIx swiss <strong>Exchange</strong> | derivative Partners
SourCE MarKEtS PLC<br />
The US energy landscape is undergoing a profound structural<br />
shift as technological advances allow the extraction of oil<br />
and gas from previously inaccessible reserves. Master Limited<br />
Partnerships (MLPs) are central to this transformation. MLPs<br />
own and operate many of the US’s core infrastructure assets,<br />
including pipelines, storage, processing facilities and gathering<br />
iSSuEr source Markets plc<br />
nuMbEr of ProduCtS<br />
MlPs sW (dividend reinvesting)<br />
MlPd sW (dividend distributing)<br />
trading CurrEnCy usd<br />
fEES Mgt. fee: 0.50% / swap fee: 0.75%<br />
bEnChMarK Morningstar ® MlP composite Index sM (Tr)<br />
LaunCh datE 15 May <strong>2013</strong><br />
auM $120Mn (as of 09/08/<strong>2013</strong>)<br />
hEdging no<br />
wEbSitE www.source.info<br />
PhonE nuMbEr +44 (0)20 3370 1100<br />
Chf daiLy CurrEnCy-hEdgEd CoMModity SECuritiES<br />
ETF Securities has developed a range of 28 Swiss Franc Daily<br />
Currency-Hedged Commodity Securities on SIX Swiss <strong>Exchange</strong>.<br />
The impact of currency movements on investment<br />
returns can be significant. These products offer an opportunity<br />
for investors to achieve a total return exposure to commodities<br />
in Swiss Francs whilst mitigating the effects of fluctuations in<br />
iSSuEr swiss commodity securities limited<br />
nuMbEr of ProduCtS 28<br />
trading CurrEnCy chF<br />
fEES 0.49%<br />
bEnChMarK<br />
LaunCh datE 28.01.<strong>2013</strong><br />
hEdging daily hedging<br />
swiss Franc hedged daily versions of<br />
the dow Jones-uBs commodity Indices<br />
wEbSitE www.etfsecurities.com<br />
PhonE nuMbEr +44 (0)20 7448 4330<br />
69 ExchangE TradEd ProducTs & IndExIng guIdE <strong>Switzerland</strong> <strong>2013</strong><br />
systems. The Source Morningstar US Energy Infrastructure<br />
MLP UCITS ETF is the first European ETF to offer exposure<br />
to this high dividend and rapidly growing space. Source is<br />
a leading European ETP provider with US$14BN in assets in<br />
equity, fixed income and commodity products, it had the second<br />
highest net new assets in Europe in 2012.<br />
MorningStar MLP CoMPoSitE tr indEX<br />
%<br />
450<br />
400<br />
350<br />
300<br />
250<br />
200<br />
150<br />
100<br />
50<br />
2004 2005 2006 2007 2009 2010 2011 2012 <strong>2013</strong><br />
Morningstar MLP Composite TR Index<br />
US Energy Infrastructure MLP ETF A (NAV)<br />
source: Bloomberg<br />
2008<br />
the US Dollar–Swiss Franc exchange rate through a currency<br />
hedging mechanism that operates on a daily basis. These securities<br />
track the performance of the Swiss Franc Hedged Daily<br />
versions of the Dow Jones-UBS Commodity Index SM and its<br />
sub-indices. Our products track commodities across a variety<br />
of sectors.<br />
CurrEnCy hEdgEd VS. unhEdgEd CoMModity<br />
%<br />
250<br />
200<br />
150<br />
100<br />
50<br />
0<br />
2003 2004 2005 2006 2007 2009 2010 2011 2012 <strong>2013</strong><br />
DJ-UBS Commodity Index – CHF Daily hedged<br />
DJ-UBS Commodity Index – CHF Un-hedged<br />
USD/CHF <strong>Exchange</strong> Rate<br />
source: Bloomberg, ETF securities<br />
2008
ProducT TaBlEs<br />
CoMModitiES PrECiouS MEtaLS<br />
ProduCt naME tyPE tiCKEr iSSuEr fEE P.a.<br />
(%)<br />
70 ExchangE TradEd ProducTs & IndExIng guIdE <strong>Switzerland</strong> <strong>2013</strong><br />
SPrEad<br />
(%)<br />
auM<br />
(in Mn.)<br />
CCy PriCE<br />
(in tC)<br />
PErforManCE<br />
1y (%)<br />
in Chf<br />
Palladium Tracker TracB uBs 0.00 2.22 - chF 61.70 11.6 -<br />
Julius Baer Physical Palladium Fund ETF JBPaEx BaEr 0.50 0.92 147.00 Eur 409.53 11.5 27.9<br />
Palladium Tracker VZoPa VT 0.00 1.35 - usd 6.42 11.3 29.6<br />
Julius Baer Physical Palladium Fund ETF JBPaEa BaEr 0.50 0.91 147.00 Eur 410.86 11.3 27.9<br />
Palladium Tracker Palla rBs 0.00 1.35 - usd 6.43 10.9 28.4<br />
Palladium Tracker PMTaB uBs 0.00 2.01 - usd 65.25 10.9 28.3<br />
ZKB Palladium ETF ETF ZPal ZKB 0.49 0.17 223.53 chF 190.06 10.7 26.3<br />
Palladium Tracker PldoE gs 0.00 0.81 - usd 63.75 10.5 28.1<br />
uBs-Index solutions- Palladium ETF a ETF Plusa uBs 0.28 0.93 13.78 chF 30'142.00 10.4 -<br />
uBs-Index solutions- Palladium ETF a ETF Plusa uBs 0.40 0.99 13.78 chF 60.88 10.2 -<br />
Julius Baer Physical Palladium Fund ETF JBPaua BaEr 0.50 0.47 147.00 usd 627.53 10.0 25.7<br />
uBs-Index solutions- Palladium ETF I ETF PlusI uBs 0.40 1.10 13.78 usd 64.38 10.0 -<br />
uBs-Index solutions- Palladium ETF I ETF PlusI uBs 0.28 0.99 13.78 usd 31'883.50 9.9 -<br />
Julius Baer Physical Palladium Fund ETF JBPaux BaEr 0.50 0.47 147.00 usd 622.62 9.8 25.7<br />
db Physical Palladium ETc ETP xPal dB 0.45 0.82 72.76 usd 64.02 9.6<br />
Julius Baer Physical Palladium Fund ETF JBPacx BaEr 0.50 0.46 147.00 chF 593.35 9.2 36.1<br />
Julius Baer Physical Palladium Fund ETF JBPaca BaEr 0.50 0.46 147.00 chF 593.37 9.1 36.1<br />
Palladium Tracker PallQ rBs 2.88 1.75 - chF 4.76 9.0 33.7<br />
Julius Baer Physical Palladium Fund ETF JBPagx BaEr 0.50 0.99 147.00 gBP 373.54 6.8 25.3<br />
Julius Baer Physical Palladium Fund ETF JBPaga BaEr 0.50 0.99 147.00 gBP 373.54 6.4 25.3<br />
Julius Baer Physical Platinum Fund ETF JBPlEx BaEr 0.50 0.51 126.89 Eur 857.34 -6.4 -23.6<br />
Julius Baer Physical Platinum Fund ETF JBPlEa BaEr 0.50 0.51 126.89 Eur 857.34 -6.4 -23.6<br />
Platinum Tracker Traca uBs 0.00 2.93 - chF 12.50 -6.7 -<br />
Platinum Tracker VZoPl VT 0.00 2.11 - usd 13.20 -6.8 -23.8<br />
Platinum Tracker PMTac uBs 0.00 2.75 - usd 13.30 -7.0 -23.4<br />
uBs Bloomberg cMcI Platinum hedged Tracker EPlcI uBs 0.61 1.52 - Eur 1'023.00 -7.2 -24.8<br />
uBs-Index solutions - Platinum ETF a ETF PTusa uBs 0.40 0.55 139.68 chF 123.13 -7.3 -<br />
ZKB Platinum ETF ETF ZPla ZKB 0.48 0.17 464.21 chF 391.17 -7.5 -25.4<br />
Platinum Tracker PlToE gs 0.00 0.56 - usd 131.10 -7.5 -24.2<br />
db Physical Platinum ETc ETP xPla dB 0.45 0.42 61.09 usd 130.03 -7.7 -<br />
Julius Baer Physical Platinum Fund ETF JBPlux BaEr 0.50 0.38 126.89 usd 1'290.70 -7.7 -25.5<br />
uBs-Index solutions - Platinum ETF I ETF PTusI uBs 0.40 0.34 139.68 usd 130.25 -7.8 -<br />
uBs-Index solutions - Platinum ETF a ETF PTusa uBs 0.28 1.19 139.68 chF 61'747.50 -7.8 -<br />
Julius Baer Physical Platinum Fund ETF JBPlua BaEr 0.50 0.38 126.89 usd 1'298.59 -8.0 -25.6<br />
uBs-Index solutions - Platinum ETF I ETF PTusI uBs 0.28 0.66 139.68 usd 65'212.50 -8.2 -<br />
Julius Baer Physical Platinum Fund ETF JBPlcx BaEr 0.50 0.38 126.89 chF 1'261.70 -8.7 -18.5<br />
Julius Baer Physical Platinum Fund ETF JBPlca BaEr 0.50 0.38 126.89 chF 1'265.77 -8.7 -18.5<br />
uBs Bloomberg cMcI Platinum Tracker TPlcI uBs 0.49 1.55 - usd 1'065.00 -8.8 -27.6<br />
uBs Bloomberg cMcI Platinum hedged Tracker cPlcI uBs 0.92 1.53 - chF 959.50 -9.8 -21.3<br />
Julius Baer Physical Platinum Fund ETF JBPlga BaEr 0.50 0.59 126.89 gBP 789.57 -11.1 -25.2<br />
3y (%)<br />
in Chf<br />
dP-<br />
rating<br />
source: Bloomberg | sIx swiss <strong>Exchange</strong> | derivative Partners
ProducT TaBlEs<br />
CoMModitiES goLd<br />
ProduCt naME tyPE tiCKEr iSSuEr fEE P.a.<br />
(%)<br />
71 ExchangE TradEd ProducTs & IndExIng guIdE <strong>Switzerland</strong> <strong>2013</strong><br />
SPrEad<br />
(%)<br />
auM<br />
(in Mn.)<br />
CCy PriCE<br />
(in tC)<br />
PErforManCE<br />
1y (%)<br />
in Chf<br />
ishares gold Eur hedged (ch) ETF csgldE Ish 0.35 0.10 129.46 Eur 80.28 -22.9 -11.3<br />
Julius Baer Physical gold Fund ETF JBgoEx BaEr 0.40 0.21 3'447.38 Eur 907.63 -23.1 -11.7<br />
uBs-Index solutions - gold ETF auEuah uBs 0.28 0.31 163.89 Eur 82.70 -23.1 -11.7<br />
Julius Baer Physical gold Fund ETF JBgoEa BaEr 0.40 0.11 3'447.38 Eur 908.13 -23.2 -11.7<br />
db Physical gold Euro hedged ETc ETP xad1 dB 0.59 0.29 563.18 Eur 95.53 -23.2 -<br />
uBs-Index solutions - gold ETF auEuIh uBs 0.24 0.60 163.89 Eur 4'1891.74 -23.2 -11.9<br />
ZKB gold ETF hedged (Eur) ETF ZgldhE ZKB 0.40 0.09 316.84 Eur 813.78 -23.3 -12.3<br />
uBs Bloomberg cMcI gold hedged Tracker EgccI uBs 0.38 0.77 - Eur 1'689.00 -23.8 -13.0<br />
gold fix PM Tracker goldch sara 0.30 0.23 - usd 122.20 -23.8 -13.9<br />
gold fix PM Tracker VZogo VT 0.00 1.43 - usd 123.30 -24.2 -14.1<br />
gold fix PM Tracker goldEu sara 0.30 0.80 - Eur 935.00 -24.2 -<br />
gold fix PM Tracker xauoE rBs 0.00 0.68 - usd 118.90 -24.2 -14.3<br />
s&P gscI gold Er Index Tracker gdEgs gs 0.00 0.10 - chF 97.80 -24.3 -15.5<br />
gold fix PM Tracker goldus sara 0.30 0.76 - usd 1'216.00 -24.4 -<br />
ZKB gold ETF ETF Zgld ZKB 0.40 0.10 3'533.96 chF 359.29 -24.5<br />
ZKB gold ETF (Eur) ETF ZgldEu ZKB 0.60 0.07 677.20 Eur 916.02 -24.5 -15.3<br />
source Physical gold P-ETc ETP sgld sou 0.29 0.18 1'919.63 usd 117.82 -24.5 -<br />
Julius Baer Physical gold Fund ETF JBgoux BaEr 0.40 0.18 3'447.38 usd 1'186.15 -24.5 -15.3<br />
db Physical gold ETc ETP xgld dB 0.29 0.20 453.23 usd 120.09 -24.5 -<br />
Julius Baer Physical gold Fund ETF JBgoua BaEr 0.40 0.14 3'447.38 usd 1'188.79 -24.6 -15.3<br />
ishares gold (ch) ETF csgold Ish 0.30 0.17 1'105.20 usd 119.90 -24.6 -15.2<br />
uBs-Index solutions - gold ETF ETF auusa uBs 0.28 0.76 410.32 chF 110.79 -24.6 -15.2<br />
ZKB gold ETF (usd) ETF Zgldus ZKB 0.40 0.10 1'891.41 usd 1'195.02 -24.6 -15.3<br />
uBs-Index solutions - gold ETF ETF auusa uBs 0.28 0.35 410.32 usd 120.08 -24.6 -15.2<br />
uBs-Index solutions - gold ETF ETF auusa uBs 0.28 0.81 410.32 Eur 90.00 -24.7 -15.1<br />
ZKB gold ETF (gBP) ETF ZgldgB ZKB 0.40 0.21 8.37 gBP 774.12 -24.7 -15.5<br />
rBs physical gold ETc ETP rBsgo rBs 0.29 - 26.54 usd 120.62 -24.7 -<br />
gold fix PM Tracker gldoE gs 0.00 0.78 - usd 118.40 -24.7 -16.0<br />
ishares gold chF hedged (ch) ETF csgldc Ish 0.35 0.07 524.12 chF 117.69 -24.7 -7.4<br />
uBs gold-Tracker Tracker Tracd uBs 0.00 2.42 - chF 11.70 -24.8 -<br />
uBs-Index solutions - gold ETF (usd) I ETF auusI uBs 0.24 0.38 410.32 usd 58'752.16 -24.9 -15.5<br />
uBs-Index solutions - gold (chF) hedged ETF I ETF auchIh uBs 0.24 0.50 710.17 chF 57'526.36 -24.9 -7.4<br />
Julius Baer Physical gold Fund ETF JBgocx BaEr 0.40 0.12 3'447.38 chF 1'286.88 -25.2 -7.5<br />
ZKB gold ETF hedged (chF) ETF Zgldhc ZKB 0.40 0.08 1'193.18 chF 378.77 -25.2 -7.4<br />
Julius Baer Physical gold Fund ETF JBgoca BaEr 0.40 0.12 3'447.38 chF 1'288.75 -25.2 -7.5<br />
uBs-Index solutions - gold (chF) ETF auchah uBs 0.28 0.24 710.17 chF 119.08 -25.2 -7.4<br />
uBs Bloomberg cMcI gold Tr Index (usd) Tracker TgccI uBs 0.26 0.81 - usd 1'703.00 -25.3 -17.3<br />
JPM commodity curve gold Tr Index Tracker ETcgou VT 1.00 0.89 - usd 82.90 -25.8 -<br />
raiffeisen ETF - solid gold a-Klasse usd ETF rglds raIF 0.44 0.36 105.95 usd 3'859.94 -26.0 -<br />
raiffeisen ETF - solid gold h-Klasse chF ETF rgldsh raIF 0.45 0.39 105.95 chF 3'591.50 -26.2 -<br />
3y (%)<br />
in Chf<br />
-15.4<br />
dP-<br />
rating<br />
source: Bloomberg | sIx swiss <strong>Exchange</strong> | derivative Partners
ProducT TaBlEs<br />
CoMModitiES SiLVEr<br />
ProduCt naME tyPE tiCKEr iSSuEr fEE P.a.<br />
(%)<br />
72 ExchangE TradEd ProducTs & IndExIng guIdE <strong>Switzerland</strong> <strong>2013</strong><br />
SPrEad<br />
(%)<br />
auM<br />
(in Mn.)<br />
CCy PriCE<br />
(in tC)<br />
PErforManCE<br />
1y (%)<br />
in Chf<br />
silver Tracker PMTad uBs 0.00 0.81 - chF 1'151.00 -24.2 -<br />
silver Tracker Tracc uBs 0.00 2.59 - chF 18.55 -28.7 -<br />
Julius Baer Physical silver Fund ETF JBsIEa BaEr 0.60 0.66 318.80 Eur 12.33 -29.3 -9.2<br />
ZKB silver ETF (Eur) hedged Klasse h ETF ZsIlhE ZKB 0.60 0.38 12.77 Eur 135.06 -29.5 -<br />
db Physical silver Euro hedged ETc ETP xad2 dB 0.75 1.05 68.99 Eur 146.17 -29.5 -<br />
Julius Baer Physical silver Fund ETF JBsIEx BaEr 0.60 0.58 318.80 Eur 12.28 -29.6 -9.6<br />
silver Tracker slVoE gs 0.00 1.97 - usd 19.35 -29.8 -8.2<br />
silver Tracker VZosI VT 0.00 1.74 - usd 19.20 -29.8 -8.9<br />
silver Tracker sIlVE rBs 0.00 1.00 - usd 19.25 -30.0 -8.4<br />
uBs Bloomberg cMcI silver hedged Tracker EsIcI uBs 0.49 0.85 - Eur 1'239.00 -30.1 -9.4<br />
ZKB silver ETF - a Klasse ETF ZsIl ZKB 0.70 0.17 959.71 chF 56.80 -30.4 -10.7<br />
db Physical silver ETc ETP xsIl dB 0.45 1.01 52.72 usd 189.52 -30.5 -<br />
uBs-Index solutions- silver ETF a ETF sVusa uBs 0.48 0.72 17.13 chF 180.14 -30.6 -<br />
uBs-Index solutions- silver ETF I ETF sVusI uBs 0.36 1.11 17.13 chF 89'659.75 -30.6 -<br />
ZKB silver ETF (usd) ETF ZsIlus ZKB 0.60 0.17 414.41 usd 187.58 -30.6 -10.7<br />
ZKB silver ETF (Eur) ETF ZsIlEu ZKB 0.60 0.19 213.63 Eur 144.40 -30.6 -10.5<br />
uBs-Index solutions- silver ETF a ETF sVusa uBs 0.48 0.62 17.13 usd 185.03 -30.7 -<br />
Julius Baer Physical silver Fund ETF JBsIua BaEr 0.60 0.49 318.80 usd 18.89 -30.8 -11.2<br />
JPM commodity curve silver Tr Index Tracker ETcsIu VT 1.00 1.43 - usd 53.50 -30.9<br />
Julius Baer Physical silver Fund ETF JBsIux BaEr 0.60 0.74 318.80 usd 18.28 -30.9 -11.4<br />
uBs-Index solutions- silver ETF I ETF sVusI uBs 0.36 0.80 17.13 usd 94'546.94 -30.9 -<br />
uBs Index solutions - silver (chF) hedged ETF sVchIh uBs 0.36 1.20 14.19 chF 7679.38 -31.1 -<br />
uBs Bloomberg cMcI silver Tr Index Tracker TsIcI uBs 0.37 0.79 - usd 1'332.00 -31.2 -12.0<br />
uBs Index solutions - silver (chF) hedged ETF sVchah uBs 0.48 0.44 14.19 chF 15.09 -31.4 -<br />
Julius Baer Physical silver Fund ETF JBsIca BaEr 0.60 0.45 318.80 chF 17.89 -31.4 -4.3<br />
ZKB silver ETF (chF) hedged Klasse h ETF ZsIlhc ZKB 0.60 0.29 61.81 chF 54.24 -31.5 -<br />
Julius Baer Physical silver Fund ETF JBsIcx BaEr 0.60 0.56 318.80 chF 17.86 -31.5 -4.7<br />
uBs Bloomberg cMcI silver hedged Tracker csIcI uBs 0.80 0.84 - chF 1'149.00 -32.5 -5.6<br />
Julius Baer Physical silver Fund ETF JBsIga BaEr 0.60 0.93 318.80 gBP 11.32 -33.1 -11.8<br />
Julius Baer Physical silver Fund ETF JBsIgx BaEr 0.60 0.93 318.80 gBP 11.31 -33.1 -11.9<br />
silver Tracker sIlVQ rBs 4.67 1.53 - chF 8.65 -53.7 -39.2<br />
3y (%)<br />
in Chf<br />
dP-<br />
rating<br />
source: Bloomberg | sIx swiss <strong>Exchange</strong> | derivative Partners
ProducT TaBlEs<br />
CoMModitiES agriCuLturE & CattLE<br />
ProduCt naME tyPE tiCKEr iSSuEr fEE P.a.<br />
(%)<br />
73 ExchangE TradEd ProducTs & IndExIng guIdE <strong>Switzerland</strong> <strong>2013</strong><br />
SPrEad<br />
(%)<br />
auM<br />
(in Mn.)<br />
CCy PriCE<br />
(in tC)<br />
PErforManCE<br />
1y (%)<br />
in Chf<br />
rBs certificate on nYBoT orange Juice a Tracker oranQ rBs 1.77 2.94 - chF 0.57 39.0 9.6<br />
IcE Frozen concentrated orange Juice FM Tracker orang rBs 0.00 2.17 - usd 0.81 26.6 -2.4<br />
IcE Frozen concentrated orange Juice FM Tracker oraoE rBs 0.00 1.31 - usd 13.50 26.3 -1.6<br />
uBs Bloomberg cMcI cotton hedged Tracker EcTcI uBs 0.58 0.82 - Eur 1'426.00 20.7 47.8<br />
uBs Bloomberg cMcI soybean Meal Tracker TsMcI uBs 0.53 0.79 - usd 3'167.00 20.0 70.8<br />
rIcI Enhanced soybean Meal Tr Index Tracker rIcag rBs 0.85 0.67 - usd 136.10 19.7 -<br />
uBs Bloomberg cMcI cotton Tracker TcTcI uBs 0.46 0.80 - usd 1'461.00 17.8 41.4<br />
uBs Bloomberg cMcI cotton hedged Tracker ccTcI uBs 0.90 0.79 - chF 1'350.00 17.6 56.5<br />
cBoT soybean Meal Front Month Future Tracker soYME rBs 0.00 0.38 - usd 62.20 16.9 56.5<br />
JPM commodity curve cotton Tr Index Tracker ETccTu VT 1.00 1.45 - usd 53.80 13.2 -<br />
IcE cotton no. 2 Front Month Future Tracker coTTo rBs n.a. 1.33 - usd 4.40 12.7 50.3<br />
IcE cotton no. 2 Front Month Future Tracker coToE rBs n.a. 0.87 - usd 11.25 12.1 49.4<br />
rIcI Enhanced orange Juice Tr Index Tracker rIcaK rBs 0.85 1.98 - usd 86.50 9.8 -<br />
uBs Bloomberg cMcI soybeans hedged Tracker EsYcI uBs 0.58 0.76 - Eur 2'255.00 8.7 55.0<br />
cBoT soybean Front Month Future Tracker soYaa rBs 0.00 1.63 - usd 12.35 8.1 46.9<br />
cBoT soybean Front Month Future Tracker soYoE rBs n.a. 1.69 - usd 17.80 7.9 47.1<br />
cBoT soybean Front Month Future Tracker soYaQ rBs 1.34 1.01 - chF 9.93 6.2 68.1<br />
uBs Bloomberg cMcI soybeans Tracker TsYcI uBs 0.46 0.79 - usd 2'308.00 6.0 47.1<br />
uBs Bloomberg cMcI soybeans hedged Tracker csYcI uBs 0.90 0.76 - chF 2'134.00 5.8 64.4<br />
s&P gscI soybeans Tr T Bill sec. source ETc ETP ssoYB sou 0.49 0.47 0.35 usd 45.46 5.0 -<br />
rIcI Enhanced soybeans Tr Index Tracker rIsoc rBs 0.85 0.60 - chF 137.72 4.1 -<br />
uBs Bloomberg cMcI corn hedged Tracker EcncI uBs 0.59 0.80 - Eur 1'234.00 3.4 86.6<br />
rIcI Enhanced oats Tr Index Tracker rIcaJ rBs 0.85 1.02 - usd 75.45 3.2 -<br />
cME live cattle Front Month Future Tracker caToE rBs n.a. 0.33 - usd 9.12 2.7 -3.6<br />
cME live cattle Front Month Future Tracker caTTl rBs 0.00 0.16 - usd 6.13 2.7 -3.6<br />
uBs Bloomberg cMcI rough rice hedged Tracker ErrcI uBs 1.08 0.79 - Eur 995.00 2.1 -<br />
cBoT corn Front Month Future Tracker corno rBs n.a. 1.04 - usd 21.35 1.8 59.4<br />
cBoT corn Front Month Future Tracker coroE rBs n.a. 1.01 - usd 55.00 1.7 59.2<br />
WcE canola Front Month Future Tracker canol rBs n.a. 0.62 - usd 3.38 1.1 32.3<br />
uBs Bloomberg cMcI corn Tracker TcncI uBs 0.47 0.86 - usd 1'278.00 0.8 77.1<br />
s&P gscI corn Er Index Tracker gscnu gs 1.20 1.37 - usd 16.25 0.6 63.8<br />
uBs Bloomberg cMcI corn hedged Tracker ccncI uBs 0.91 0.75 - chF 1'170.00 0.5 98.8<br />
uBs Bloomberg cMcI Milling Wheat Tracker EcacI uBs 0.57 2.39 - Eur 2'163.00 0.3 -<br />
s&P gscI corn Tr T Bill sec. source ETc ETP scorn sou 0.49 0.99 0.28 usd 16.84 0.2 -<br />
cME lean hog Front Month Future Tracker lEanh rBs 0.00 1.17 - usd 2.56 0.0 -7.9<br />
rIcI Enhanced lumber Tr Index Tracker rIcad rBs 0.85 1.04 - usd 54.35 0.0 -<br />
cME lean hog Front Month Future Tracker hogoE rBs n.a. 0.30 - usd 6.66 0.0 -8.1<br />
uBs Bloomberg cMcI rough rice Tracker TrrcI uBs 0.96 0.75 - usd 975.00 -0.2 -<br />
uBs Bloomberg cMcI rough rice hedged Tracker crrcI uBs 1.18 0.79 - chF 925.00 -0.5 -<br />
uBs Bloomberg cMcI lean hogs hedged Tracker ElhcI uBs 0.66 0.84 - Eur 478.25 -1.1 -12.8<br />
3y (%)<br />
in Chf<br />
dP-<br />
rating<br />
source: Bloomberg | sIx swiss <strong>Exchange</strong> | derivative Partners
ProducT TaBlEs<br />
CoMModitiES induStriaL MEtaLS<br />
ProduCt naME tyPE tiCKEr iSSuEr fEE P.a.<br />
(%)<br />
74 ExchangE TradEd ProducTs & IndExIng guIdE <strong>Switzerland</strong> <strong>2013</strong><br />
SPrEad<br />
(%)<br />
auM<br />
(in Mn.)<br />
CCy PriCE<br />
(in tC)<br />
PErforManCE<br />
1y (%)<br />
in Chf<br />
uBs Bloomberg cMcI lead hedged Tracker EllcI uBs 0.49 0.81 - Eur 1'245.00 11.8 5.8<br />
uBs Bloomberg cMcI lead hedged Tracker TllcI uBs 0.37 0.83 - usd 1'329.00 9.5 2.2<br />
uBs Bloomberg cMcI lead hedged Tracker cllcI uBs 0.81 0.77 - chF 1'174.00 8.5 11.3<br />
lME lead Front Month Future Tracker lEdoE rBs 0.00 0.95 - usd 2.10 5.7 -5.5<br />
rBs certificate on lME lead Forward Tracker lEdoQ rBs 3.10 0.00 - chF 1.67 5.0 -2.6<br />
rIcI Enhanced Tin Tr Index Tracker rIcaT rBs 0.85 0.80 - usd 69.80 4.1 -<br />
lME Tin Front Month Future Tracker ZInno rBs 0.00 1.01 - usd 19.95 2.2 -5.1<br />
uBs Bloomberg cMcI Zinc Tracker ElxcI uBs 0.49 0.76 - Eur 460.25 -1.3 -12.8<br />
rIcI Enhanced Zinc Tr Index Tracker rIcxu rBs 0.85 0.29 - usd 128.08 -2.7 -<br />
rIcI Enhanced Zinc Tr Index Tracker rIcxc rBs 0.85 0.30 - chF 100.92 -2.9 -<br />
uBs Bloomberg cMcI Zinc Tracker TlxcI uBs 0.37 0.77 - usd 482.25 -3.3 -16.0<br />
uBs Bloomberg cMcI Zinc Tracker clxcI uBs 0.81 0.80 - chF 435.50 -4.1 -8.2<br />
lME special high grade Zinc FM Tracker ZIcoE gs 1.50 0.40 - usd 12.55 -4.2 -21.0<br />
ZKB Industriemetalle Tr Index Tracker InduI ZKB 0.50 0.54 - chF 91'585.00 -5.0 -<br />
lME special high grade Zinc FM Tracker ZInoE rBs 0.00 1.36 - usd 1.46 -5.5 -21.4<br />
ZKB Industriemetalle Tr Index Tracker Indur ZKB 1.35 0.54 - chF 91.10 -5.9 -<br />
uBs Bloomberg cMcI Industrial Metals hedged Tracker EIMcI uBs 0.49 0.73 - Eur 863.00 -9.0 -14.3<br />
uBs Bloomberg cMcI aluminium hedged Tracker ElacI uBs 0.49 0.78 - Eur 562.00 -9.7 -26.3<br />
uBs Bloomberg cMcI copper hedged Tracker ElPcI uBs 0.49 0.77 - Eur 1'379.00 -10.1 -2.9<br />
rBs certificate on Zinc Forward contract Tracker ZInoQ rBs 2.80 2.25 - chF 0.88 -10.2 -23.5<br />
JPM commodity curve Industrial Metals Tracker ETcIME VT 1.00 1.20 - Eur 65.00 -10.6 -<br />
uBs Bloomberg cMcI Industrial Metals Tracker TIMcI uBs 0.37 0.70 - usd 904.00 -10.8 -17.3<br />
s&P gscI Industrial Metals Er Index Tracker gsoEE gs 0.75 0.56 - Eur 17.50 -10.8 -19.5<br />
rBs Industrial Metals Basket Tracker EdElM rBs n.a. 0.00 - usd 197.00 -10.8 -22.8<br />
JPM commodity curve Industrial Metals Tr Index Tracker ETcIMu VT 1.00 1.14 - usd 68.70 -11.2 -<br />
uBs Bloomberg cMcI aluminium Tr Index Tracker TlacI uBs 0.37 0.83 - usd 577.00 -11.3 -29.1<br />
lME high grade Primary aluminium FM Tracker aluoE rBs n.a. 1.53 - usd 1.27 -11.5 -32.0<br />
uBs Bloomberg cMcI Industrial Metals hedged Tracker cIMcI uBs 0.81 0.66 - chF 813.50 -11.6 -10.0<br />
uBs Bloomberg cMcI copper Tr Index Tracker TlPcI uBs 0.37 0.80 - usd 1'455.00 -11.8 -6.3<br />
db Industrial Metals Booster ETc ETP xcT7 dB 0.45 0.84 3.49 usd 87.05 -12.1 -<br />
rIcI Enhanced aluminium Tr Index Tracker rIcaZ rBs 0.85 0.31 - usd 66.82 -12.2 -<br />
lME copper grade a Front Month Future Tracker cuPoE gs 0.00 0.32 - usd 59.70 -12.3 -12.2<br />
rIcI Enhanced aluminium Tr Index Tracker rIcal rBs 0.85 0.30 - chF 52.62 -12.3 -<br />
uBs Bloomberg cMcI aluminium hedged Tracker clacI uBs 0.81 0.84 - chF 521.00 -12.5 -23.2<br />
lME copper grade a Front Month Future Tracker coPoE rBs n.a. 0.31 - usd 9.52 -12.6 -9.6<br />
uBs Bloomberg cMcI copper hedged Tracker clPcI uBs 0.81 0.82 - chF 1'307.00 -12.7 2.2<br />
db s&P gscI Industrial Metals ETc ETP xET7 dB 0.45 0.85 18.97 usd 85.69 -12.7 -<br />
s&P gscI Indust Metals Tr T Bill sec. source ETc ETP sIMETl sou 0.49 0.97 15.34 usd 126.68 -12.7 -<br />
s&P gscI Industrial Metals Tr Index Tracker gsTrI gs 1.25 0.82 - usd 11.95 -12.8 -22.0<br />
s&P gscI Industrial Metals Er Index Tracker InEgs gs 1.35 0.53 - chF 18.25 -12.9 -21.2<br />
3y (%)<br />
in Chf<br />
dP-<br />
rating<br />
source: Bloomberg | sIx swiss <strong>Exchange</strong> | derivative Partners
ProducT TaBlEs<br />
CoMModitiES MuLti-indiCiES<br />
ProduCt naME tyPE tiCKEr iSSuEr fEE P.a.<br />
(%)<br />
75 ExchangE TradEd ProducTs & IndExIng guIdE <strong>Switzerland</strong> <strong>2013</strong><br />
SPrEad<br />
(%)<br />
auM<br />
(in Mn.)<br />
CCy PriCE<br />
(in tC)<br />
PErforManCE<br />
1y (%)<br />
in Chf<br />
s&P gscI Energy Tr T Bill secured source ETc ETP sEnErg sou 0.49 0.86 6.14 usd 100.80 10.0 -<br />
dBlcI Mean reversion Er Index Tracker dBEdB dB 0.00 0.00 - Eur 1'359.00 4.0 3.7<br />
EasyETF s&P gscI TM caPPEd coMModITY 35/20 ETF gscId BnP 0.30 0.15 451.73 usd 44.19 3.5 -0.5<br />
s&P gscI Tr Index Tracker gsTrx gs 1.05 0.44 - usd 43.15 3.5 -0.3<br />
db s&P gscI ETc ETP xET5 dB 0.45 0.57 15.67 usd 113.90 3.3 -<br />
uBs Bloomberg s&P gscI cMcI Tracker gcMcI uBs 0.50 0.75 - usd 1'167.00 3.2 2.4<br />
s&P gscI Tr T Bill secured source ETc ETP sgscI sou 0.49 0.92 4.95 usd 44.59 3.1 -<br />
cYd long short commodity Tr Index Tracker clsch rBs 1.60 0.98 - chF 71.25 2.4 -13.8<br />
cYd long short commodity Tr Index Tracker clsus rBs 1.60 1.00 - usd 93.75 2.4 -14.0<br />
s&P gscI reduced Energy Er Index Tracker gsoEJ gs 0.75 0.57 - Eur 33.85 2.3 2.4<br />
dBlcI Mean reversion Er Index Tracker dBudB dB 0.00 1.51 - usd 1'254.00 1.8 2.9<br />
db commodity Booster ETc ETP xcT5 dB 0.45 0.46 14.98 usd 111.67 1.7 -<br />
s&P gscI Er Index Tracker cIEgs gs 0.00 0.45 - chF 42.40 1.6 1.1<br />
cYd long only commodity Tr Index Tracker cloQu rBs 2.10 0.95 - chF 91.45 1.4 15.8<br />
ZKB rohstoffbasket Tr Index Tracker rohsI ZKB 0.50 0.49 - chF 99'115.00 0.4 -<br />
rBs Market access Jim rogers Intl. cdty. Index ETF MrIc rBs 0.70 0.40 192.55 usd 31.75 0.3 -0.7<br />
s&P gscI reduced Energy Tr Index Tracker gsTrr gs 1.10 0.41 - usd 35.35 -0.1 -1.9<br />
uBs Bloomberg cMcI active hedged Tracker EcMaM uBs 1.37 0.66 - Eur 815.50 -0.6 -<br />
ZKB rohstoffbasket Tr Index Tracker rohsr ZKB 0.50 0.50 - chF 98.25 -0.8 -<br />
uBs Bloomberg cMcI composite hedged Tracker EcMcI uBs 0.50 0.62 - Eur 1'110.00 -1.0 4.4<br />
reuters/Jefferies crB Er Index Tracker crBus rBs 0.00 0.69 - usd 2.76 -1.1 -6.1<br />
comstage ETF cB commodity ex-agri. ETF cBcoMM cBK 0.30 0.34 140.14 chF 118.58 -1.1 0.4<br />
comstage ETF cB commodity ex-agri. ETF cBcoMM cBK 0.30 0.35 140.14 usd 125.29 -1.3 0.3<br />
s&P gscI reduced Energy Er Index Tracker rEEgs gs 0.00 0.56 - chF 34.85 -1.6 0.4<br />
JPM commodity curve aggregate Tr Index Tracker ETccIE VT 1.00 0.93 - Eur 83.10 -1.7 -<br />
s&P gscI light Energy Er Index Tracker gsoEh gs 0.75 0.53 - Eur 27.95 -1.8 0.7<br />
uBs ETFs plc - cMcI coMPosITE sF Eur-I ETF ccEuI uBs 0.00 - 309.91 Eur 80'783.62 -2.1 -<br />
uBs Bloomberg cMcI composite Er Index Tracker ucM6M uBs 0.00 0.77 - usd 1151.00 -2.1 3.4<br />
uBs ETFs plc - cMcI coMPosITE sF Eur-a ETF ccEua uBs 0.00 - 309.91 Eur 80.31 -2.2 -<br />
uBs Bloomberg cMcI composite Er Index Tracker ucM3M uBs 0.00 0.68 - usd 1'000.00 -2.3 0.5<br />
lyxor ETF cmdts. Thomson reuters/Jefferies crB ETF crB lxr 0.35 0.26 775.35 usd 26.03 -2.4 -8.1<br />
JPM commodity curve aggregate Tr Index Tracker ETccIu VT 1.00 0.89 - usd 87.00 -2.5 -<br />
cYd Market neutral Plus 5 commodity Tr Index Tracker cMnus rBs 1.75 1.04 - usd 105.20 -2.5 -16.9<br />
uBs Bloomberg dJ-uBs cMcI Tr Index Tracker cMdJc uBs 0.50 0.63 - chF 108.40 -2.5 -<br />
uBs Bloomberg cMcI composite usd Tr Index Tracker TcM6M uBs 0.38 0.66 - usd 1'194.00 -2.6 2.9<br />
cYd Market neutral Plus 5 commodity Tr Index Tracker cMnch rBs 1.75 1.01 - chF 79.80 -2.6 -16.9<br />
uBs Bloomberg cMcI composite usd Tr Index Tracker TcM3M uBs 0.38 0.75 - usd 1'036.00 -2.6 0.1<br />
uBs Bloomberg cMcI composite Er Index Tracker ucMcI uBs 0.00 0.70 - usd 1'121.00 -2.7 1.6<br />
uBs Bloomberg cMcI active Tr Index Tracker TcMaM uBs 1.25 0.73 - usd 803.50 -2.7 -<br />
uBs Bloomberg cMcI active hedged Tracker ccMaM uBs 1.47 0.70 - chF 766.00 -3.0 -<br />
3y (%)<br />
in Chf<br />
dP-<br />
rating<br />
source: Bloomberg | sIx swiss <strong>Exchange</strong> | derivative Partners
ProducT TaBlEs<br />
MonEy-MarKEt & fX<br />
ProduCt naME tyPE tiCKEr iSSuEr fEE P.a.<br />
(%)<br />
76 ExchangE TradEd ProducTs & IndExIng guIdE <strong>Switzerland</strong> <strong>2013</strong><br />
SPrEad<br />
(%)<br />
auM<br />
(in Mn.)<br />
CCy PriCE<br />
(in tC)<br />
PErforManCE<br />
1y (%)<br />
in Chf<br />
rBs Mxn Tr Money Market Index Tracker MxnZZ rBs 0.00 0.20 - chF 97.40 6.7 -3.5<br />
rBs sEK Tr Money Market Index Tracker sEKZZ rBs 0.00 - - chF 96.10 4.1 6.3<br />
rBs Pln Tr Money Market Index Tracker PlnZZ rBs 0.00 0.19 - chF 102.60 3.7 -1.5<br />
sEK 6M swap Tracker VxsEd VT 0.70 0.10 - sEK 104.20 3.5 5.3<br />
rBs huF Tr Money Market Index Tracker huFZZ rBs 0.00 0.38 - chF 104.80 3.5 1.5<br />
EonIa Euro overnight Index Tracker ETEon uBs 0.00 0.00 - Eur 1.01 2.5 -5.0<br />
lyxor ETF Euro cash ETF lYcsh lxr 0.04 0.02 687.96 Eur 106.93 2.5 -5.9<br />
comstage ETF commerzbank EonIa ETF cBEonI cBK 0.10 0.02 117.06 Eur 103.23 2.5 -5.8<br />
rBs Eur Tr Money Market Index Tracker EurZZ rBs 0.00 0.09 - Eur 113.90 2.4 -5.9<br />
db x-trackers II EonIa ucITs ETF 1c ETF xEon dB 0.10 0.01 842.95 Eur 139.75 2.4 -<br />
comstage ETF commerzbank EonIa ETF cBEonI cBK 0.10 0.20 117.06 chF 127.06 2.4 -6.0<br />
ishares EonIa ucITs ETF (swap) ETF csEo Ish 0.04 0.06 22.01 Eur 100.81 2.4 -<br />
rBs Eur Tr Money Market Index Tracker EurZc rBs 0.00 0.11 - chF 91.50 2.3 -5.9<br />
Eur 6M swap Tracker VxEud VT 0.70 0.09 - Eur 116.50 2.3 -5.3<br />
comstage ETF cB FedFundsEffectiverate ETF cBFEdF cBK 0.10 0.50 21.65 chF 94.93 -0.1 -12.2<br />
rBs chF Tr Money Market Index Tracker chFZI rBs n.a. 0.05 - chF 100.74 -0.1 -0.2<br />
noK 2Y swap Tracker Vxnos VT 0.70 0.24 - noK 125.70 -0.1 0.8<br />
comstage ETF cB FedFundsEffectiverate ETF cBFEdF cBK 0.10 0.03 21.65 usd 100.52 -0.3 -12.0<br />
rBs usd Tr Money Market Index Tracker usdZQ rBs 0.00 0.09 - usd 115.50 -0.3 -12.1<br />
rBs usd Tr Money Market Index Tracker usdZE rBs 0.00 0.12 - chF 87.60 -0.5 -12.3<br />
ishares FEd Funds Effective rate ETF csFF Ish 0.04 0.05 7.63 usd 99.62 -0.6 -<br />
chF 6M swap Tracker Vxchd VT 1.20 0.09 - chF 105.60 -0.7 -0.9<br />
usd 6M swap Tracker Vxusd VT 0.70 0.09 - usd 116.60 -0.8 -12.4<br />
rBs noK Tr Money Market Index Tracker noKZQ rBs 0.00 0.19 - chF 100.90 -0.8 -0.5<br />
TrY 6M swap Tracker VxTrd VT 0.70 0.08 - TrY 126.20 -1.1 -11.5<br />
rBs noK Tr Money Market Index Tracker Vxnod VT 0.70 0.08 - noK 122.90 -1.2 -0.2<br />
rBs nZd Tr Money Market Index Tracker nZdZZ rBs 0.00 0.24 - chF 119.50 -1.4 7.1<br />
db x-trackers us dollar cash ETF xusd dB 0.15 2.60 38.84 usd 170.80 -1.6 -<br />
rBs Money Market super Yield Index Tracker MMsYu rBs 0.85 - - usd 138.16 -1.7 -2.0<br />
rBs Money Market super Yield Index Tracker MMsYc rBs 0.85 - - chF 99.58 -1.8 -2.2<br />
rBs Money Market super Yield Index Tracker MMsYE rBs 0.85 - - Eur 126.70 -1.8 -2.3<br />
rBs Money Market super Yield Index Tracker MMsYP rBs 0.85 - - chF 93.79 -1.8 -2.4<br />
rBs cad Tr Money Market Index Tracker - rBs 0.00 0.18 - chF 106.80 -2.5 -9.4<br />
rBs gBP Tr Money Market Index Tracker cadZZ rBs 0.00 0.13 - chF 76.90 -3.0 -9.9<br />
rBs TrY Tr Money Market Index Tracker gBPZZ rBs 0.00 0.28 - chF 106.30 -3.1 -21.2<br />
gBP 6M swap Tracker TrYZZ VT 0.70 0.08 - gBP 123.00 -3.5 -10.0<br />
rBs Brl Tr 1M currency Index Tracker VxgBd rBs 2.00 0.66 - chF 85.80 -4.7 -<br />
rBs aud Tr Money Market Index Tracker BrEal rBs 0.00 0.15 - chF 133.30 -5.9 7.2<br />
rBs Zar Tr Money Market Index Tracker audZZ rBs 0.00 0.59 - chF 84.20 -14.6 -23.5<br />
3y (%)<br />
in Chf<br />
dP-<br />
rating<br />
source: Bloomberg | sIx swiss <strong>Exchange</strong> | derivative Partners
ProducT TaBlEs<br />
fiXEd-inCoME aMEriCa<br />
ProduCt naME tyPE tiCKEr iSSuEr fEE P.a.<br />
(%)<br />
77 ExchangE TradEd ProducTs & IndExIng guIdE <strong>Switzerland</strong> <strong>2013</strong><br />
SPrEad<br />
(%)<br />
auM<br />
(in Mn.)<br />
CCy PriCE<br />
(in tC)<br />
PErforManCE<br />
1y (%)<br />
in Chf<br />
aMundI ETF shorT us TrEasurY 7-10 ETF su7 aMdI 0.14 0.37 14.51 usd 81.72 3.3 -<br />
db x-trackers II us TrEasurIEs shorT ETF xuTs dB 0.10 0.89 12.19 usd 90.18 1.1 -<br />
aMundI ETF shorT us TrEasurY 3-7 ETF su3 aMdI 0.14 0.25 6.65 usd 88.89 1.0 -<br />
ishares usd government Bond 1-3 ucITs ETF ETF csBgu3 Ish 0.12 0.13 31.22 usd 103.96 -0.2 -10.7<br />
db x-trackers II IBoxx $ TrEasurIEs 1-3 ETF xuT3 dB 0.10 0.02 14.95 usd 165.16 -0.2 -<br />
lyxor ETF iBoxx $ Treasuries 1-3Y ETF lYus13 lxr 0.17 0.17 19.26 usd 101.21 -0.2 -<br />
aMundI ETF us TrEasurY 1-3 ucITs ETF ETF us1 aMdI 0.14 0.21 6.78 usd 165.24 -0.3 -<br />
ishares $ Treasury Bond 1-3yr ucITs ETF ETF IBTs Ish 0.00 0.06 1'033.81 usd 131.90 -0.4 -11.5<br />
aMundI ETF shorT us TrEasurY 1-3 daIlY ETF su1 aMdI 0.14 0.22 1.94 usd 97.26 -0.5 -<br />
usd swap 24M Tracker Vxuss VT 0.70 0.25 - usd 122.20 -0.7 -11.7<br />
ZKB Wegelin usd Inflation Basket Tracker usdIl ZKB 0.50 0.67 - usd 104.21 -1.6 0.6<br />
ishares usd government Bond 3-7 ucITs ETT ETF csBgu7 Ish 0.12 0.15 94.95 usd 115.61 -1.6 -4.7<br />
aMundI ETF us TrEasurY 3-7 ucITs ETF ETF us3 aMdI 0.14 0.23 2.79 usd 191.89 -1.7 -<br />
lyxor ETF iBoxx $ liquid Emerging Mkts. sovereigns ETF lYlEMB lxr 0.30 0.85 61.22 usd 112.51 -2.1 -<br />
usd 5Y swap Tracker VxusM VT 0.70 0.35 - usd 141.20 -2.4 -6.3<br />
lyxor ETF iBoxx $ Treasuries 5-7Y ETF lYus57 lxr 0.17 0.18 7.45 usd 105.93 -2.4 -<br />
uBs-ETF MscI usa a ETF usausa sTT 0.20 0.61 20.84 chF 97.66 -2.7 -<br />
db x-trackers II IBoxx $ TrEasurIEs ETF xuTd dB 0.10 0.10 24.18 usd 202.89 -2.7 -<br />
sPdr® Barclays us Treasury Bond ETF TrsY sTsT 0.15 0.25 14.13 chF 98.36 -3.1 -<br />
ishares $ corporate Bond ucITs ETF ETF lQdE Ish 0.20 0.59 1'390.07 usd 106.76 -3.6 -8.7<br />
ishares usd government Bond 7-10 ETF csBgu0 Ish 0.12 0.14 2.54 usd 125.40 -3.8 0.6<br />
aMundI ETF us TrEasurY 7-10 ETF us7 aMdI 0.14 0.25 2.71 usd 226.20 -4.0 -<br />
rBs high Yield canadian Income Trusts Tracker cITEu rBs 0.00 1.01 - Eur 139.85 -4.2 50.2<br />
rBs high Yield canadian Income Trusts Tracker cITch rBs 0.00 1.00 - chF 110.00 -4.2 50.5<br />
ishares $ Treasury Bond 7-10yr ETF IBTM Ish 0.20 0.09 350.60 usd 189.77 -5.5 -5.3<br />
db x-trackers II us TrEasurIEs InFlaTIon-lInKEd ETF xuIT dB 0.10 0.37 11.96 usd 265.33 -5.9 -<br />
ishares usd Inflation linked Bond ETF csBIlu Ish 0.16 0.26 42.51 usd 124.16 -5.9 -0.7<br />
ishares $ TIPs ucITs ETF ETF ITPs Ish 0.25 0.15 427.27 usd 188.89 -6.2 -0.3<br />
usd 10Y swap Tracker Vxusl VT 0.70 0.34 - usd 149.60 -6.8 -3.9<br />
lyxor ETF iBoxx $ Treasuries 10Y+ ETF lYus10 lxr 0.17 0.24 37.24 usd 118.89 -9.4 -<br />
3y (%)<br />
in Chf<br />
dP-<br />
rating<br />
source: Bloomberg | sIx swiss <strong>Exchange</strong> | derivative Partners
ProducT TaBlEs<br />
fiXEd-inCoME EuroPE<br />
ProduCt naME tyPE tiCKEr iSSuEr fEE P.a.<br />
(%)<br />
78 ExchangE TradEd ProducTs & IndExIng guIdE <strong>Switzerland</strong> <strong>2013</strong><br />
SPrEad<br />
(%)<br />
auM<br />
(in Mn.)<br />
CCy PriCE<br />
(in tC)<br />
PErforManCE<br />
1y (%)<br />
in Chf<br />
dbx ITraxx ® crossoVEr ucITs 1c ETF xTxc dB 0.10 0.18 142.47 Eur 143.82 20.1 -<br />
armundi gov.Bnd l. rat. €MTs Inv. grd. ETF x1g aMdI 0.14 0.16 268.72 Eur 180.29 15.2 -<br />
ITraxx ® EuroPE subord. Financials ETF xsB5 dB 0.10 0.47 14.61 Eur 114.05 14.3 -<br />
iBoxx Eur liquid high Yield 30 ETF lYYIEl lxr 0.45 0.51 125.54 Eur 119.88 13.9 -<br />
comstage iBoxx €liquid sov. div 25+ ETF cBEu25 cBK 0.12 0.34 12.23 chF 164.56 13.7 12.4<br />
comstage iBoxx €liquid sov. div 25+ ETF cBEu25 cBK 0.12 0.19 12.23 Eur 133.86 13.6 12.7<br />
comstage iBoxx €liquid sov. div 15+ ETF cBEu15 cBK 0.12 0.30 12.70 chF 168.98 13.3 12.0<br />
comstage iBoxx €liquid sov. div 15+ ETF cBEu15 cBK 0.12 0.13 12.70 Eur 137.47 13.2 12.3<br />
comstage iBoxx €liquid sov. div 10-15 ETF cBEu10 cBK 0.12 0.32 11.68 chF 161.89 13.1 7.5<br />
comstage iBoxx €liquid sov. div 10-15 ETF cBEu10 cBK 0.12 0.14 11.68 Eur 131.57 13.0 7.8<br />
comstage iBoxx €sov IFl ETF cBIFlE cBK 0.17 0.21 18.85 Eur 114.57 12.7 -<br />
comstage iBoxx €sov IFl ETF cBIFlE cBK 0.17 0.31 18.85 chF 140.88 12.6 -<br />
comdirect iBoxx €liquid sov. div 7-10 ETF cBEu70 cBK 0.12 0.08 13.27 chF 166.95 11.7 7.1<br />
IBoxx Euro InFlaTIon-lInKEd ETF xEIn dB 0.10 0.37 137.54 Eur 186.99 11.7 -<br />
comstage iBoxx €liquid sov. div 5-7 ETF cBEu57 cBK 0.12 0.07 15.59 chF 170.65 11.6 7.9<br />
comstage iBoxx €liquid sov. div 7-10 ETF cBEu70 cBK 0.12 0.07 13.27 Eur 135.60 11.5 7.3<br />
EuroMTs Inflation linked Investment grade ETF lYMTI lxr 0.20 0.11 191.08 Eur 128.55 11.4 2.9<br />
ishares Euro Inflation link Bond ETF csBIlE Ish 0.16 0.41 35.52 Eur 116.03 11.3 3.5<br />
iBoxx Euro liquid sovereigns div 5-7 ETF cBEu57 cBK 0.12 0.07 15.59 Eur 138.61 11.3 8.1<br />
EuroMTs 7-10Y Investment grade ETF lYMTd lxr 0.17 0.07 98.32 Eur 135.72 10.9 5.3<br />
ishares Euro government Bond 7-10 ETF csBgE0 Ish 0.12 0.16 16.86 Eur 123.50 10.9 7.3<br />
EuroMTs 5-7Y Investment grade ETF lYMTc lxr 0.17 0.06 227.07 Eur 135.40 10.2 3.4<br />
ishares Euro government Bond 10-15yr ETF IEgZ Ish 0.00 0.17 22.03 Eur 136.31 9.8 -3.7<br />
EuroMTs global Investment grade ETF lYMTx lxr 0.17 0.09 487.48 Eur 147.20 9.4 2.9<br />
Euro liquid sovereigns div overall Tr ETF cBEuoV cBK 0.12 0.10 26.99 chF 165.31 9.4 5.0<br />
goVT Bond EuroMTs Broad Inv. grd. ETF cB3 aMdI 0.14 0.17 261.47 Eur 189.57 9.3 4.5<br />
IBoxx soVErEIgns EuroZonE ETF xglE dB 0.10 0.19 628.32 Eur 190.08 9.3 -<br />
iBoxx Euro liquid sov. div. overall Tr ETF cBEuoV cBK 0.12 0.10 26.99 Eur 134.23 9.2 5.2<br />
ITraxx ® hIVol ucITs 1c ETF xTxh dB 0.10 0.46 11.47 Eur 115.50 8.9 -<br />
ishares €government Bond 15-30yr ETF IBgl Ish 0.20 0.23 59.80 chF 211.45 8.8 -0.8<br />
armundi Euro corp. Fin. IBoxx ETF aFIn aMdI 0.16 0.31 98.85 Eur 118.02 8.6 -<br />
Euro government Bond 3-7 ucITs (acc) ETF csBgE7 Ish 0.12 0.08 79.61 Eur 116.71 8.4 3.8<br />
Barclays Euro high Yield Bond ucITs ETF JnKE sTT 0.45 1.12 52.37 chF 67.41 8.2 -<br />
comstage iBoxx €liquid sov. div 3-5 Tr ETF cBEu35 cBK 0.12 0.25 18.30 chF 162.05 8.0 2.8<br />
comstage iBoxx €liquid sov. div 3-5 Tr ETF cBEu35 cBK 0.12 0.06 18.30 Eur 131.67 7.8 3.1<br />
ITraxx ® EuroPE sr. Fin. ETF xsn5 dB 0.10 0.24 8.96 Eur 109.37 7.7 -<br />
Euro liquid corporates Tr Index Tracker JFaIE BaEr 0.50 0.45 - Eur 111.20 7.5 -<br />
Euro corPoraTEs ucITs ETF cc4 aMdI 0.16 0.18 253.72 Eur 191.07 7.3 6.2<br />
Euro corporate Bond ETF lYcrP lxr 0.20 0.13 616.67 Eur 130.20 7.3 6.3<br />
IBoxx Eur lIQuId corPoraTEs ETF xBlc dB 0.10 0.31 196.33 Eur 135.90 7.2 -<br />
3y (%)<br />
in Chf<br />
dP-<br />
rating<br />
source: Bloomberg | sIx swiss <strong>Exchange</strong> | derivative Partners
glossarY<br />
ACTIVE MANAGEMENT<br />
The process of hand selecting securities with the purpose of<br />
trying to outperform a benchmark index. Active portfolio managers<br />
use economic data, investment research, market forecasts,<br />
and other indicators to help make investment decisions.<br />
ALPHA<br />
A statistical measure of performance adjusted for risk. Alpha<br />
reflects the amount by which a mutual fund or portfolio<br />
outperforms or underperforms based upon its level of risk.<br />
Positive alpha means a portfolio’s risk-adjusted performance<br />
was higher compared to its corresponding benchmark index.<br />
Negative alpha means a portfolio’s risk adjusted performance<br />
was lower compared to its index. The alpha for index ETFs<br />
should match the accepted beta of the benchmark.<br />
ASSET ALLOCATION<br />
The process of apportioning investments among various asset<br />
classes, such as stocks, bonds, commodities, real estate, collectibles<br />
and cash equivalents. Asset allocation affects both the<br />
risk and return of investors, and is often used as a core strategy<br />
in basic financial planning.<br />
ASSET CLASS<br />
Refers to the categorization of an asset. Representative asset<br />
classes include equities, bonds, commodities, etc.<br />
AUTHORIZED PARTICIPANTS<br />
This term refers to large financial institutions, such as specialist<br />
firms and market makers, which are involved in the<br />
creation and redemption activity of ETF shares.<br />
BASIS POINT<br />
Measurement used to quote bonds. One basis point is equal to<br />
0.01%, or one one-hundredth of one percent. 100 basis points<br />
is equal to 1%, whereas 50 basis points would equal one half<br />
percent, or 0.50%.<br />
BASKET<br />
A unit or group of securities. The grouping of securities within<br />
an ETF is sometimes referred to as a basket.<br />
BENCHMARK<br />
A benchmark is a yardstick or standard for measuring the performance<br />
of an investment. For example, the Barclays Capital<br />
U.S. Aggregate Bond index is a popular benchmark for judging<br />
79 ExchangE TradEd ProducTs & IndExIng guIdE <strong>Switzerland</strong> <strong>2013</strong><br />
the performance of diversified taxable bond mutual funds. The<br />
goal of most money managers and investors is to outperform<br />
their respective benchmark.<br />
BETA<br />
Beta is a volatility measurement of a stock mutual fund or ETF<br />
versus a comparable benchmark like the S&P 500 stock index.<br />
A stock fund or ETF with a higher beta than the S&P 500 will<br />
rise or fall to a greater degree. In contrast, a stock fund or ETF<br />
with a low beta will rise or fall less.<br />
BOND<br />
A debt instrument issued by corporations and governments to<br />
raise capital. Interest on the outstanding debt is paid to bondholders<br />
at specific intervals, with the principal amount of the<br />
loan paid on the bond maturity date.<br />
BLUE CHIPS<br />
Blue Chip stocks are regarded as leading companies with world<br />
class products and services, universally recognizable brands<br />
and run by top-notch management teams.<br />
BREAKPOINTS<br />
Mutual funds with front-end loads, or a sales charge, enable investors<br />
to reduce front-end sales charges as the amount of that<br />
investment increases to certain levels called "breakpoints".<br />
Each prospectus will have details on the breakpoints used to<br />
reduce the front-end sales charge.<br />
CALL OPTION<br />
A call option gives its owner the right (not obligation) to buy<br />
a predetermined quantity of stock or commodities from the<br />
seller at a specified price (strike price) within a certain time<br />
frame (expiration date).<br />
CHICAGO BOARD OPTIONS EXCHANGE (CBOE)<br />
Founded in 1973 the CBOE changed options trading by creating<br />
standardized listed stock options. Prior to this time, trading<br />
options was largely unregulated. The CBOE lists options on<br />
interest rates, individual stocks, and various market indexes.<br />
The exchange is located in downtown Chicago, IL.<br />
CLOSED-END FUND<br />
Closed-end funds issue a fixed number of shares through an<br />
initial public offering and often use leverage to magnify their<br />
performance. Closed-end funds are bought and sold just like
glossarY<br />
stocks and their share price often trades at a noticeable discount<br />
or premium to the fund’s net asset value.<br />
CLOSET INDEX FUND<br />
An actively managed fund that closely mimics the volatility<br />
and performance of an index fund.<br />
COMMISSION<br />
Transaction fee paid to a broker for executing a securities trade.<br />
Commission amounts vary and are often dependent on the<br />
size of trade, the frequency of trades, and sometimes the size of<br />
the brokerage account. Discount brokers tend to charge lower<br />
commissions for trades versus full service brokers.<br />
COMMODITY INDEXES<br />
Indexes that measure either the price or performance of physical<br />
commodities, or the price of commodities as represented by<br />
the price of futures contracts listed on commodity exchanges.<br />
CONTRARIAN<br />
Describes an investor that believes and does the exact opposite<br />
of what the majority of investors are doing at any given<br />
moment. For example, contrarians might perceive value in a<br />
stock or industry sector that is out of favor or has performed<br />
poorly. While many investors are inclined to avoid unpopular<br />
investments, contrarians are likely to invest in these areas with<br />
the expectation of an eventual rebound or change in market<br />
sentiment.<br />
COUNTERPARTY RISK<br />
Counterparty risk is the risk that an institution defaults and<br />
fails to pay on a credit derivative, a credit default swap, insurance<br />
contract, a trade or a another financial transaction. ETFs<br />
that use swaps or derivatives may be exposed to counterparty<br />
risk. ETNs too are subject to counterparty risk because they<br />
rely on the creditworthiness of the issuing financial institution.<br />
CREATION UNIT<br />
The smallest block of shares in an exchange-traded fund that<br />
can be purchased or redeemed directly from the fund company<br />
at net asset value. Creation units are usually transacted in<br />
50,000 share increments, making them large dollar transactions<br />
limited to large institutions and other authorized participants.<br />
Instead of receiving cash, the seller of a creation unit<br />
would receive a basket of securities that corresponds to the<br />
portfolio holdings in a particular ETF. This 'in-kind' transfer pro-<br />
80 ExchangE TradEd ProducTs & IndExIng guIdE <strong>Switzerland</strong> <strong>2013</strong><br />
cess is unique to ETF's and does not create tax consequences<br />
for the seller.<br />
DEFERRED SALES CHARGE<br />
A sales charge deducted from an investment for exiting early,<br />
or before the sales charge ceases to exist. Mutual fund class B<br />
and C shares often carry a deferred sales charge. Also called<br />
back end load, CDSC or contingent deferred sales charge.<br />
DISCOUNT TO NAV<br />
A mutual fund, closed end fund or ETF whose share price is<br />
lower than fund's net asset value (NAV). The occurrence of<br />
significant premiums or discounts with ETFs is rare, whereas<br />
with closed end funds it’s common.<br />
DIVIDEND<br />
Distribution of earnings paid out to shareholders. With mutual<br />
funds and ETFs, dividends can be a result of capital gains, interest<br />
income, or dividends paid to the fund itself by securities<br />
within the portfolio. Dividends are often paid quarterly, but the<br />
frequency can be less and is determined by fund management.<br />
DIVIDEND YIELD<br />
The distribution rate of a fund calculated by dividing the<br />
amount of the dividends per share by the per share market<br />
price of the fund. For example, a fund price of $20 that pays a<br />
$2 dividend per year has a 10% dividend yield.<br />
DOW JONES INDUSTRIAL AVERAGE (DJIA)<br />
The DJIA is a widely followed index that is used as a barometer<br />
of stock market performance. This stock index is based upon<br />
30 major companies, or components in diversified industries,<br />
such as banking, consumer staples, retail, healthcare, and<br />
technology.<br />
EFFICIENT MARKET THEORY (EMT)<br />
The Efficient Market Theory (EMT) dissuades investors from<br />
using fundamental research to find undervalued or mis-priced<br />
securities. The central idea is that market prices already reflect<br />
the full knowledge of investors, which makes it impossible to<br />
outperform the market.<br />
EMERGING MARKET<br />
Refers to the economy or capital markets of developing nations,<br />
which are often new, un-established or have a limited history.
glossarY<br />
ENHANCED INDEXING<br />
This market strategy seeks incremental outperformance of a<br />
benchmark index without changing the profile characteristics<br />
of the index. By using leverage, options trading, or another<br />
mechanism, enhanced indexing offers the potential of outperforming<br />
a benchmark index.<br />
EXCHANGE TRADED COMMODITY (ETC)<br />
Commodity ETFs (ETCs) invest in commodities, such as precious<br />
metals and/or commodities futures. Among the first<br />
commodity ETFs were gold exchange-traded funds, which<br />
have been offered in a number of countries. In Europe, ETF<br />
Securities is pioneer in the ETC space.<br />
EXCHANGE TRADED FUND (ETF)<br />
ETFs or exchange-traded funds are low cost index funds that<br />
trade like stocks. ETFs offer intraday liquidity meaning they<br />
can be bought or sold when the stock market is open for trading.<br />
Generally, ETFs are very tax-efficient and have lower<br />
annual expenses compared to closed end funds and mutual<br />
funds. ETFs cover a broad spectrum of assets including stocks,<br />
bonds, currencies, real estate and commodities. ETFs can be<br />
sold short, leveraged with margin, hedged with call/put options<br />
or bought and held.<br />
EXCHANGE-TRADED NOTE (ETN)<br />
ETNs or exchange-traded notes are unsecured debt securities<br />
that pay a return linked to the performance of a single security<br />
or index. ETNs don’t usually pay a dividend or annual coupon<br />
and they have maturity dates that can range up to 30 years.<br />
ETNs held to maturity pay the return of the note’s underlying<br />
index minus its annual expense ratio. ETNs are subject to counterparty<br />
risk, meaning, the creditworthiness of the financial<br />
issuer can impact the note’s final return and value.<br />
EXCHANGE-TRADED PRODUCT (ETP)<br />
A type of security that is derivatively-priced and which trades<br />
intra-day on a national securities exchange. <strong>Exchange</strong> <strong>Traded</strong><br />
<strong>Products</strong> are derivatively-priced, where the value is derived<br />
from another investment instruments such as a commodity,<br />
currency, share price or interest rate. Generally, exchange<br />
traded products are benchmarked to stocks, commodities,<br />
indices or they can be actively managed funds. <strong>Exchange</strong><br />
traded products include exchange traded funds (ETFs), exchange<br />
traded vehicles (ETVs), exchange traded notes (ETNs)<br />
and certificates.<br />
81 ExchangE TradEd ProducTs & IndExIng guIdE <strong>Switzerland</strong> <strong>2013</strong><br />
EXPENSE RATIO<br />
The expense ratio of a mutual fund or ETF covers the cost of<br />
investment management, legal and administrative expenses,<br />
12b-1 marketing fees and other associated expenses. The expense<br />
ratio does not include the cost of acquiring a fund, such<br />
as commissions or sales loads, and it’s expressed as a percentage<br />
of the fund’s average daily net assets.<br />
FINMA<br />
As an independent supervisory authority, the Swiss Financial<br />
Market Supervisory Authority FINMA protects creditors, investors<br />
and policy holders, ensuring the smooth functioning of<br />
the financial markets and preserving their reputation. In doing<br />
so, it contributes indirectly to enhancing the competitiveness<br />
of the financial sector.<br />
FINRA<br />
The Financial Industry Regulatory Authority (FINRA) is a selfregulatory<br />
organization that oversees the market regulation of<br />
all securities firms doing business in the United States. FINRA<br />
was created in 2007 through the consolidation of the National<br />
Association of Securities Dealers (NASD) with the member<br />
regulation, enforcement and arbitration divisions of the New<br />
York Stock <strong>Exchange</strong>.<br />
FUND OF FUNDS<br />
Investment strategy that seeks to diversify risk exposure and<br />
manager style among various fund managers. Potential pitfalls<br />
include a lack of transparency and an added layer of fees.<br />
This strategy is popular with hedge fund investors looking to<br />
diversify risk among various fund groups.<br />
FUND FLOWS<br />
Describes the money flow into or out of mutual funds and ETFs.<br />
FUNDAMENTAL INDEXING<br />
Fundamental indexing uses a company’s fundamentals such as<br />
sales, profits, book value, revenues and dividends to determine<br />
its weighting within an index. Some fundamental indexes use<br />
a multi-factor approach whereas others use one key factor.<br />
FUND OVERLAP<br />
Fund overlap refers to the duplication in owning two or more<br />
ETFs or mutual funds that have the same identical securities<br />
and/or underlying investment strategy. Investors are effectively<br />
paying twice for double work. They pay one fund compa
glossarY<br />
ny to execute an investment strategy and then they pay again<br />
to a competing fund to do the exact same work.<br />
GOLD FUND<br />
A type of mutual fund or ETF designed to give exposure to<br />
gold related securities or to physical gold itself. Gold securities<br />
can include stocks in companies engaged in the production,<br />
processing, or mining of gold. Funds that track the price of<br />
gold itself will generally acquire and store physical gold or<br />
gold derivatives. Gold funds are often used to hedge against<br />
inflation and currency risks.<br />
GRANTOR TRUST<br />
This type of fund structure distributes dividends directly to<br />
shareholders and allows investors to retain their voting rights<br />
on the underlying securities within the fund. The original fund<br />
components of the index remain fixed and this ETF structure<br />
is not registered under the SEC Investment Company Act of<br />
1940. Merrill Lynch’s HOLDRs follow this format.<br />
GROWTH AND INCOME FUND<br />
A mutual fund, closed end fund, or ETF with both the growth<br />
of capital and income as the primary investment objective.<br />
GROWTH FUND<br />
A mutual fund, closed end fund, or ETF with the growth of<br />
capital as the primary investment objective.<br />
HEDGING<br />
A strategy used to reduce financial risk or the possibility of<br />
loss. For example, an investor owning 100 shares of an S&P 500<br />
stock fund could hedge that long position by owning a short<br />
position or put options on the S&P 500 index.<br />
INCOME FUND<br />
A mutual fund, closed end fund, or ETF that has generating<br />
income, as the primary investment objective. Income can be<br />
derived from various sources, including interest payments,<br />
dividends, and capital gains.<br />
INDEX<br />
A statistical measure used to track the aggregate performance<br />
of stock, bond and commodities markets. Widely followed indexes<br />
include those developed and managed by Standard &<br />
Poor’s, NYSE, NASDAQ, Russell, MSCI, or STOXX.<br />
82 ExchangE TradEd ProducTs & IndExIng guIdE <strong>Switzerland</strong> <strong>2013</strong><br />
INDEX FUND<br />
A type of mutual fund or ETF that attempts to match the performance<br />
of a stock, bond or commodity index. Index funds<br />
are sometimes referred to as passive funds and are notorious<br />
for their tax efficiency and low fees. Some index funds follow<br />
traditional market cap indexes whereas others follow an equal<br />
weight or fundamental indexing approach.<br />
INDEXING<br />
Investment strategy that seeks to match the exact performance<br />
of a specific market or benchmark index.<br />
INDEX OPTIONS<br />
Calls and puts on stock or bond indexes. Index options allow<br />
investors to trade a particular market sector or index of<br />
securities, without having to make individual purchases of<br />
each security in that sector. Index options are listed on various<br />
exchanges, including the American, New York, and Chicago<br />
Board Options <strong>Exchange</strong>.<br />
INVERSE ETFS<br />
(See Short ETFs)<br />
INVESTMENT COMPANY ACT OF 1940<br />
The U.S. Investment Company Act of 1940 regulates the organization<br />
of companies, including mutual funds that engage<br />
primarily in investing and trading in securities. The Act requires<br />
these companies to disclose their financial condition and<br />
investment policies to investors on a regular and timely basis.<br />
INVESTMENT GRADE<br />
Bonds whose issuers are rated AAA to BBB for safety and<br />
ability to repay principal by Standard & Poor’s or Moody’s Investors<br />
Service.<br />
INVESTMENT STYLE<br />
Indicates the approach of an investment manager in selecting<br />
securities. For example, a certain manager may be value oriented<br />
by emphasizing companies with low P/E or book-to-value<br />
ratios, whereas another may emphasize earnings and profit<br />
growth.<br />
LARGE CAP<br />
A large company or large cap stock generally refers to companies<br />
with a market capitalization or size over $5 billion.
glossarY<br />
LEVERAGE<br />
Margin and use of option contracts are forms of leverage which<br />
allow investors to enhance their returns without adding to<br />
their investments.<br />
LEVERAGED ETFS<br />
The main objective of leveraged ETFs is to deliver magnified<br />
performance of a particular stock, bond or commodity index.<br />
Most leveraged ETFs attempt to duplicate daily index returns<br />
by two or three times. Short leveraged ETFs aim for daily index<br />
returns that move in the opposite direction, but with magnified<br />
performance of two or three times.<br />
LIQUIDITY<br />
Liquidity refers to the ability to convert an asset to cash without<br />
substantially affecting its price. Assets that are quickly<br />
converted to cash have good liquidity whereas those that take<br />
time are less liquid. The liquidity of an ETF is best determined<br />
by the liquidity of the securities in its underlying stock, bond<br />
or commodity index along with the trading volume of the ETF<br />
itself. General market conditions are another secondary factor<br />
which can influence an ETF’s liquidity.<br />
MARKET CAPITALIZATION<br />
The market capitalization of a corporation is the measurement<br />
of the company’s value based upon the company’s number of<br />
outstanding shares multiplied by its current share price.<br />
MID CAP<br />
A mid-sized company or mid cap stock generally refers to companies<br />
with a market capitalization or size between $1 billion<br />
and $5 billion.<br />
MSCI<br />
MSCI distributes index and company-level data and also licenses<br />
the MSCI indexes to third parties for the purposes of creating<br />
mutual funds, ETFs, OTC derivatives and other financial<br />
products.<br />
MUNICIPAL BOND<br />
Municipal bonds or 'munis' are debt issued by city, state and local<br />
governments to finance various projects. Bond proceeds are<br />
typically used by local governments to construct or maintain<br />
highways, hospitals and schools. The interest income paid by<br />
municipal bonds is free from federal income tax and in many<br />
cases, exempt from state and local taxes as well.<br />
83 ExchangE TradEd ProducTs & IndExIng guIdE <strong>Switzerland</strong> <strong>2013</strong><br />
NASDAQ<br />
National Association of Securities Dealers Automated Quotations<br />
is a computerized system that quotes securities traded<br />
over the counter and on other exchanges.<br />
NET ASSET VALUE (NAV)<br />
Represents the per share price of a mutual fund. With closed<br />
end funds and ETFs, the true NAV is not always reflected in the<br />
share price of the security because it may trade at a premium<br />
or discount to the NAV. The calculation of NAV is the fund’s<br />
total net assets divided by the number of shares outstanding,<br />
minus fees and expenses.<br />
OPEN END FUND<br />
See Mutual Fund<br />
OPEN END INDEX FUND<br />
This type of fund structure reinvests dividends the date of<br />
receipt and pays them out via a quarterly cash distribution.<br />
This ETF structure is also permitted to use derivatives, loan<br />
securities and its registered under the SEC Investment Company<br />
Act of 1940. ETFs that utilize this legal structure include<br />
iShares and the Select Sector SPDRs.<br />
OVER THE COUNTER (OTC)<br />
Over the counter trading is conducted by market makers<br />
in OTCBB and Pink Sheets securities using inter-dealer quote<br />
services like the Pink Quote and the OTC Bulletin Board<br />
(OTCBB). OTC stocks are not usually listed or traded on a stock<br />
exchange, although exchange listed stocks can be traded in<br />
the OTC market.<br />
PASSIVE MANAGEMENT<br />
A market strategy that involves selecting a benchmark index<br />
to assure investment performance is the same as the underlying<br />
index. Passive investing assures that an investor will<br />
not underperform (or outperform) a market index. Passive<br />
management is opposite of active management.<br />
PERFORMANCE DRAG<br />
A reduction of portfolio performance due to various factors.<br />
An example of performance drag occurs when gains within a<br />
portfolio are offset by various expenses, such as management<br />
fees, transaction costs and taxes. These expenses create a drag<br />
or negative effect on the portfolios performance.
glossarY<br />
PORTFOLIO TURNOVER<br />
Portfolio turnover measures the frequency by which securities<br />
within a mutual fund or ETF are bought and sold. Turnover is<br />
determined by the dollar value of buys or sells (whichever is<br />
less) during a year divided by the total assets in the fund. For<br />
example, a mutual fund with $200 million in assets that has<br />
$100 million of sales and $100 million worth of purchases (using<br />
the same proceeds) during the year would have a 50% turnover<br />
rate, indicating an average holding period of two-years. A churn<br />
rate of 100% signifies that a fund manager has sold the funds<br />
entire portfolio and bought new holdings during the course of a<br />
year. High portfolio turnover translates into higher investment<br />
costs whereas low portfolio turnover is better because it lessens<br />
the impact of trading and tax related expenses.<br />
PREMIUM TO NAV<br />
A mutual fund, closed end fund or ETF whose share price is<br />
higher than fund’s net asset value (NAV). The occurrence of<br />
significant premiums or discounts with ETFs is rare, whereas<br />
with closed end funds it’s common.<br />
PROSPECTUS<br />
Required by securities laws and issued by mutual fund companies<br />
and ETFs, the prospectus is a legal document that discloses<br />
the investment objectives of the fund, operating history, fund<br />
management, management fees, portfolio holdings, and other<br />
related financial data. Brokers are required to give a prospectus<br />
to investors before they invest.<br />
PUT OPTION<br />
A put option gives its owner the right (not obligation) to sell a<br />
predetermined quantity of stock or commodities at a specified<br />
price (strike price) within a certain time frame (expiration date).<br />
R-SQUARED<br />
R-squared measures the correlation of a fund’s movement in<br />
comparison to its corresponding benchmark. An R squared<br />
score of 1.00 would indicate a perfect correlation, whereas a<br />
score of 0.00 indicates no correlation.<br />
SECTOR ROTATION<br />
An investment strategy that uses elements of market timing to<br />
identify industry sectors of the economy ready to outperform.<br />
Conversely, a sector rotation strategy would likely avoid or<br />
underweight industry sectors that are expected to lag the rest<br />
of the market.<br />
84 ExchangE TradEd ProducTs & IndExIng guIdE <strong>Switzerland</strong> <strong>2013</strong><br />
SECURITIES AND EXCHANGE COMMISSION (SEC)<br />
Federal agency created by the Securities <strong>Exchange</strong> Act of<br />
1934 with the primary mission of protecting investors and<br />
maintaining the integrity of the securities markets. The SEC<br />
has five Commissioners who are appointed by the President<br />
of the United States with the advice and consent of the Senate.<br />
Their terms last five years and are staggered so that one<br />
Commissioner's term ends on June 5 of each year.<br />
SHARE CLASSES<br />
Some mutual funds use multiple share classes for the same<br />
underlying portfolio. For example, investors that buy A shares<br />
pay an upfront sales charge to enter a fund, whereas a class B<br />
share would defer the sales charge. Some mutual fund families<br />
like Vanguard offer their ETFs as an additional share class of<br />
existing index mutual funds.<br />
SHARPE RATIO<br />
A measure of a fund’s historical returns adjusted for risk or<br />
volatility. The calculation is fund return minus the return on<br />
3-month treasury bills divided by the fund standard deviation.<br />
SHORT ETFS<br />
The main objective of short ETFs is to deliver inverse or opposite<br />
performance to a particular stock, bond or commodity<br />
index. Most short ETFs attempt to duplicate daily index returns<br />
in the opposite direction. Some short ETFs aim for daily index<br />
returns in the opposite direction but with leverage or magnified<br />
performance.<br />
SMALL CAP<br />
A small company or small cap stock generally refers to companies<br />
with a market capitalization between $1 billion and<br />
$250 million.<br />
STYLE BOX<br />
The investment style box is a visual tool that classifies mutual<br />
funds and ETFs by the size (large, mid or small) of stocks a fund<br />
holds along with the investment style of stocks (value, growth<br />
or blend) it holds. The style box has nine investment categories<br />
or styles and was developed by Morningstar.<br />
STYLE DRIFT<br />
Style drift happens when a fund diverts from its prospectus<br />
defined investment strategy to pursue another course.
glossarY<br />
TARGET DATE FUND<br />
A type of mutual fund or ETF that automatically adjusts its<br />
mix of stocks, bonds and other assets based upon a specified<br />
year or target date. Typically, a target date fund will reduce its<br />
exposure to stocks as it approaches its planned target date and<br />
maintain a fixed allocation for the remainder of time.<br />
TICKER SYMBOL<br />
The lettering system used to identify a stock, mutual fund, or<br />
ETF on an exchange. Also called trading symbols.<br />
TREASURY INFLATION PROTECTED<br />
SECURITIES (TIPS)<br />
TIPS are U.S. government debt indexed to inflation. The principal<br />
of a TIPS either increases with inflation or decreases<br />
with deflation, as measured by the Consumer Price Index.<br />
At maturity you are paid the adjusted principal or original<br />
principal, whichever is greater. TIPS pay interest twice a year,<br />
at a fixed rate. The rate is applied to the adjusted principal;<br />
so, like the principal, interest payments rise with inflation and<br />
fall with deflation.<br />
UNIT INVESTMENT TRUST<br />
This type of fund structure does not reinvest dividends in the<br />
fund and pays them out via a quarterly cash distribution. In<br />
order to comply with diversification rules, this ETF structure<br />
will sometimes deviate from the exact composition of a benchmark<br />
index. This type of fund is registered under the SEC<br />
Investment Company Act of 1940. The Dow DIAMONDS (DIA),<br />
PowerShares QQQ (QQQQ) and the S&P 500 SPDRs (SPY) follow<br />
this product format.<br />
VOLATILITY<br />
Volatility is determined by the price movement (rise or fall) of a<br />
security. Securities that experience sharp increases or declines<br />
within a short time frame are considered more volatile than<br />
those that don’t. (See Beta)<br />
VOLUME<br />
Total number of shares or contracts traded on a security. Volume<br />
data is tracked and reported daily by major stock exchanges<br />
around the world.<br />
WINDOW DRESSING<br />
Denotes the selling of underperforming securities by money<br />
managers just before the end of each quarter, so these holdings<br />
85 ExchangE TradEd ProducTs & IndExIng guIdE <strong>Switzerland</strong> <strong>2013</strong><br />
don’t appear in shareholder reports as significant investment<br />
positions. This selling activity is often accompanied with buying<br />
activity of strong performing securities. After quarterly<br />
reports are issued, the portfolio will reveal positions in strong<br />
performing securities, despite the fact that the majority of the<br />
capital gains in these were never experienced by shareholders.<br />
Window dressing is a cosmetic affect and adds little or<br />
no value.<br />
YEAR-TO-DATE (YTD)<br />
The period beginning at the start of the calendar year up until<br />
the most current date.<br />
YIELD CURVE<br />
A graph that illustrates the relationship between the yields of<br />
bonds with the same credit quality, but with varying maturities.<br />
A positive yield curve means short term interest rates are<br />
lower versus long term rates. A negative yield curve is just the<br />
opposite, whereas a flat yield curve shows little variance in the<br />
yields of short term bonds and long term bonds.<br />
ZERO COUPON BOND<br />
A zero coupon bond is bought at a discounted price to its face<br />
value and the principal is repaid at the bond’s maturity date.<br />
Unlike conventional bonds which make semi-annual payments,<br />
zero coupon bonds do not make periodic interest payments.<br />
U.S. Treasury bills, U.S. savings bonds and any other<br />
bond thats been stripped of its coupons are all examples of<br />
zero coupon bonds. Investors earn a return from zero coupon<br />
bonds after compounding interest is paid at maturity plus the<br />
difference between the discounted price of the zero bond and<br />
its par or redemption value.
WEBlInKs<br />
useful weblinks for<br />
<strong>Exchange</strong> <strong>Traded</strong> <strong>Products</strong> Investors<br />
ISSUERS<br />
Commerzbank<br />
www.comstage-etf.ch<br />
www.zertifikate.commerzbank.ch<br />
Deutsche Bank<br />
www.x-markets.ch<br />
ETF Securities<br />
www.etfsecurities.com<br />
Invesco<br />
www.invescopowershares.net<br />
Lyxor Asset Management<br />
www.lyxoretf.ch<br />
Source<br />
www.source.info<br />
SPDR / State Street<br />
www.spdrseurope.com<br />
UBS<br />
www.ubs.com/keyinvest<br />
Vanguard<br />
www.vanguard.ch<br />
Zürcher Kantonalbank<br />
www.zkb.ch/strukturierteprodukte<br />
TRADING VENUES<br />
Scoach <strong>Switzerland</strong><br />
www.scoach.ch<br />
Swiss <strong>Exchange</strong><br />
www.six-swiss-exchange.com<br />
Derivative.com<br />
www.derivative.com<br />
PRESS & MEDIA<br />
payoff<br />
www.payoff.ch/magazine<br />
Finanz- und Wirtschaft<br />
www.fuw.ch<br />
Bilan<br />
www.bilan.ch<br />
86 ExchangE TradEd ProducTs & IndExIng guIdE <strong>Switzerland</strong> <strong>2013</strong><br />
PRODUCT-RESEARCH & TOOLS<br />
payoff<br />
www.payoff.ch<br />
ETF Info<br />
www.etfinfo.com<br />
Bloomberg<br />
www.bloomberg.com<br />
Reuters<br />
www.reuters.com<br />
ETFGI<br />
www.etfgi.com<br />
Just ETF<br />
www.justetf.com<br />
ASSOCIATIONS<br />
Swiss Structured <strong>Products</strong> Association<br />
www.svsp-verband.ch<br />
Swiss Funds & Asset Management Association<br />
www.sfama.ch<br />
European Structured Investment<br />
<strong>Products</strong> Association<br />
www.eusipa.org<br />
EVENTS<br />
ETP Day<br />
www.etpd.ch<br />
Structured <strong>Products</strong> Forum<br />
www.strukiforum.ch<br />
Friends of Strukis<br />
www.friends-of-strukis.ch<br />
FINANCIAL EDUCATION<br />
Swiss Derivative Institute<br />
www.swissderivativeinstitute.ch