Radon anomalies in soil gas caused by seismic activity
Radon anomalies in soil gas caused by seismic activity
Radon anomalies in soil gas caused by seismic activity

You also want an ePaper? Increase the reach of your titles
YUMPU automatically turns print PDFs into web optimized ePapers that Google loves.
RADON ANOMALIES IN SOIL GAS CAUSED BY<br />
SEISMIC ACTIVITY<br />
BORIs ZMAZEK, MLADEN ŽIVc˘ić, LJUBc˘O TODOROVSKI,<br />
SAŠO DŽEROSKI, JANJA VAUPOTIc˘, IVAN KOBAL<br />
About the authors<br />
Boris Zmazek<br />
The Jožef Stefan Institute,<br />
Jamova 39, 1000 Ljubljana, Slovenia<br />
Phone: + 386 1 477 35 80<br />
Fax: + 386 1 477 38 11<br />
E-mail: boris.zmazek@ijs.si<br />
Mladen Živčić<br />
The Jožef Stefan Institute,<br />
Jamova 39, 1000 Ljubljana, Slovenia<br />
Office of Seismology, Environmental Agency of the<br />
Republic of Slovenia,<br />
Dunajska 47/VII, 1000 Ljubljana, Slovenia<br />
Ljubčo Todoroski, Sašo Džeroski, Janja Vaupotič, Ivan Kobal<br />
The Jožef Stefan Institute,<br />
Jamova 39, 1000 Ljubljana, Slovenia<br />
Abstract<br />
At the Orlica fault <strong>in</strong> the Krško bas<strong>in</strong>, comb<strong>in</strong>ed barasol<br />
detectors were buried <strong>in</strong> six boreholes, two along the fault<br />
itself and four on either side of it, to measure and record<br />
radon <strong>activity</strong>, temperature and pressure <strong>in</strong> <strong>soil</strong> <strong>gas</strong> every<br />
60 m<strong>in</strong>utes for four years. Data collected have been analysed<br />
<strong>in</strong> a manner aimed at dist<strong>in</strong>guish<strong>in</strong>g radon <strong>anomalies</strong><br />
result<strong>in</strong>g from environmental parameters (air and <strong>soil</strong><br />
temperature, barometric pressure, ra<strong>in</strong>fall) from those<br />
<strong>caused</strong> solely <strong>by</strong> <strong>seismic</strong> events. The follow<strong>in</strong>g approaches<br />
have been used to identify <strong>anomalies</strong>: (i) ± 2σ deviation of<br />
radon concentration from the seasonal average, (ii) correlation<br />
between time gradients of radon concentration and<br />
barometric pressure, and (iii) prediction with regression<br />
trees with<strong>in</strong> a mach<strong>in</strong>e learn<strong>in</strong>g program. In this paper<br />
the results obta<strong>in</strong>ed with regression trees are presented.<br />
A model has been built <strong>in</strong> which the program was taught<br />
to predict radon concentration from the data collected<br />
dur<strong>in</strong>g the <strong>seismic</strong>ally <strong>in</strong>active periods when radon is<br />
presumably <strong>in</strong>fluenced only <strong>by</strong> environmental parameters.<br />
A correlation coefficient of 0.83 between measured and<br />
predicted values was obta<strong>in</strong>ed. Then, the whole data time<br />
series was <strong>in</strong>cluded and a significantly lowered correlation<br />
was observed dur<strong>in</strong>g the <strong>seismic</strong>ally active periods. This<br />
reduced correlation is thus an <strong>in</strong>dicator of <strong>seismic</strong> effect.<br />
Keywords<br />
radon <strong>in</strong> <strong>soil</strong> <strong>gas</strong>, environmental parameters, earthquakes,<br />
correlation, regression trees, forecast<strong>in</strong>g<br />
1 INTRODUCTION<br />
S<strong>in</strong>ce the advent of the nuclear era <strong>in</strong> Slovenia <strong>in</strong> sixties,<br />
radon ( 222Rn) and other radionuclides have been systematically<br />
monitored <strong>in</strong> ground and surface waters [1-7].<br />
The first radon analyses, aimed at forecast<strong>in</strong>g earthquakes<br />
[8-15], were carried out <strong>in</strong> Slovenia <strong>in</strong> 1982 [16].<br />
In four thermal water spr<strong>in</strong>gs, radon concentrations<br />
were determ<strong>in</strong>ed weekly, while Cl – 2– , SO , hardness and<br />
4<br />
pH value, were determ<strong>in</strong>ed monthly. In 1998, this study<br />
was extended to other thermal water spr<strong>in</strong>gs [17-20] and<br />
also to <strong>soil</strong> <strong>gas</strong> [20-22] at selected, <strong>seismic</strong>ally relevant<br />
sites, and sampl<strong>in</strong>g frequency was <strong>in</strong>creased from once a<br />
week to once an hour.<br />
It is often difficult to dist<strong>in</strong>guish a radon anomaly <strong>caused</strong><br />
solely <strong>by</strong> a <strong>seismic</strong> event, from one result<strong>in</strong>g from<br />
meteorological or hydrological parameters, therefore the<br />
implementation of more advanced statistical methods <strong>in</strong><br />
data evaluation [23-29] is important. We have found that<br />
among these methods, regression/decision trees may<br />
be very successful for this purpose and outperformed<br />
the others [30]. We teach the program to predict radon<br />
concentrations on the basis of environmental data (air<br />
and <strong>soil</strong> temperature, barometric pressure, ra<strong>in</strong>fall)<br />
dur<strong>in</strong>g <strong>seismic</strong>ally non-active periods, and then apply<br />
the hypothesis that the prediction is significantly worsened<br />
dur<strong>in</strong>g <strong>seismic</strong>ally active periods.<br />
In this paper we shall focus on the radon concentration<br />
<strong>in</strong> <strong>soil</strong> <strong>gas</strong> <strong>in</strong> the Krško bas<strong>in</strong>. For earthquakes,<br />
Dobrovolsky’s [31] equation was used to calculate the<br />
radius of the zone with<strong>in</strong> which precursory phenomena<br />
may be manifested (so-called Dobrovolsky’s radius R D ):<br />
R D = 10 0.43M (1)<br />
ACTA GEOTECHNICA SLOVENICA, 2004 13.
B.ZMAZEK ET AL.: RADON ANOMALIES IN SOIL GAS CAUSED BY SEISMIC ACTIVITY<br />
where M is the earthquake magnitude. Earthquakes for<br />
which the distance R E between the epicentre and our<br />
measur<strong>in</strong>g site was equal or less than 2R D have been<br />
taken <strong>in</strong>to account.<br />
2 EXPERIMENTAL<br />
S<strong>in</strong>ce April 1999, <strong>in</strong> 60-90 cm deep boreholes at six<br />
locations <strong>in</strong> the Krško bas<strong>in</strong>, radon concentration <strong>in</strong><br />
<strong>soil</strong> <strong>gas</strong>, barometric pressure and <strong>soil</strong> temperature<br />
have been measured and recorded once an hour, us<strong>in</strong>g<br />
barasol probes (MC-450, ALGADE, France). Other<br />
meteorological data, such as air temperature and ra<strong>in</strong>fall,<br />
have been provided <strong>by</strong> the Office of Meteorology of the<br />
Environmental Agency of the Republic of Slovenia, and<br />
<strong>seismic</strong> data <strong>by</strong> the Office of Seismology of the same<br />
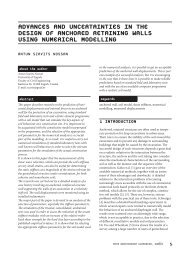
agency. Boreholes 1 and 4 are located <strong>in</strong> the Orlica fault<br />
zone, at a distance about 4000 m from each other, while<br />
the other boreholes are at distances from 150 to 2500<br />
m on either side of the fault zone (Fig. 1). Experimental<br />
details are described elsewhere [22]. Air temperature<br />
and ra<strong>in</strong>fall were measured at the meteorological station<br />
Bizeljsko, approximately 14 km from the boreholes.<br />
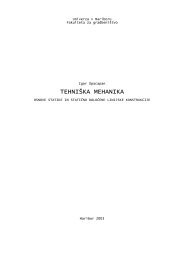
Data recorded are shown <strong>in</strong> Fig. 2. In this paper, only<br />
data collected from stations 1 (Krško-1) are evaluated<br />
because they have the longest time series.<br />
Figure 1. Map of the Krško bas<strong>in</strong> with locations of radon<br />
monitor<strong>in</strong>g stations at the Orlica fault with strike-slip<br />
displacement. The <strong>in</strong>sert shows the position of Krško<br />
(SLO - Slovenia, I - Italy, A - Austria, H - Hungary,<br />
HR - Croatia).<br />
3 RESULTS AND DISCUSSION<br />
S<strong>in</strong>ce radon concentration is a numerical variable, we<br />
have approached the task of predict<strong>in</strong>g radon concentration<br />
from meteorological data us<strong>in</strong>g regression (or<br />
14.<br />
ACTA GEOTECHNICA SLOVENICA, 2004<br />
function approximation) methods. We used regression<br />
trees [32], as implemented with the WEKA data m<strong>in</strong><strong>in</strong>g<br />
suite [33]. Details of our procedure are described elsewhere<br />
[30].<br />
Regression trees are a representation for piece-wise<br />
constants or piece-wise l<strong>in</strong>ear functions. Like classical<br />
regression equations, they predict the value of a<br />
dependent variable (called class) from the values of a<br />
set of <strong>in</strong>dependent variables (called attributes). Data<br />
presented <strong>in</strong> the form of a table can be used to learn or<br />
automatically construct a regression tree. In this table,<br />
each row (example) has the form (x 1 , x 2 ,..., x N , y), where<br />
x i are values of the N attributes (e.g., air temperature,<br />
barometric pressure, etc.) and y is the value of the class<br />
(e.g., radon concentration <strong>in</strong> <strong>soil</strong> <strong>gas</strong>). Unlike classical<br />
regression approaches, which f<strong>in</strong>d a s<strong>in</strong>gle equation for<br />
a given set of data, regression trees partition the space<br />
of examples <strong>in</strong>to axis-parallel rectangles and fit a model<br />
to each of these partitions. A regression tree has a test <strong>in</strong><br />
each <strong>in</strong>ner node that tests the value of a certa<strong>in</strong> attribute<br />
and, <strong>in</strong> each leaf, a model for predict<strong>in</strong>g the class. The<br />
model can be a l<strong>in</strong>ear equation or just a constant. Trees<br />
hav<strong>in</strong>g l<strong>in</strong>ear equations <strong>in</strong> the leaves are also called<br />
model trees (MT).<br />
A number of systems exist for <strong>in</strong>duc<strong>in</strong>g regression trees<br />
from examples, such as CART [32] and M5 [34]. M5<br />
is one of the best known programs for regression tree<br />
<strong>in</strong>duction. We used the system M5’ [35], a reimplementation<br />
of M5 with<strong>in</strong> the WEKA data m<strong>in</strong><strong>in</strong>g suite [33].<br />
The parameters of M5’ were set to their default values,<br />
unless stated otherwise.<br />
To test the hypothesis that the predictability of radon<br />
concentration <strong>in</strong> periods with <strong>seismic</strong> activities is worse<br />
than <strong>in</strong> periods without <strong>seismic</strong> activities, the follow<strong>in</strong>g<br />
procedure was applied. Firstly, the value of the class -<br />
daily radon concentration, the values of attributes - daily<br />
average barometric pressure, daily average air temperature,<br />
daily average <strong>soil</strong> temperature, difference between<br />
daily <strong>soil</strong> and daily air temperatures, daily amount of<br />
ra<strong>in</strong>fall, and difference <strong>in</strong> daily barometric pressure were<br />
selected. The difference between the pressures on day<br />
i +1 and day i is related to day i. Secondly, this dataset<br />
was split <strong>in</strong>to two parts. In the first part (labelled SA and<br />
amount<strong>in</strong>g to 23 % of the data), data for the periods with<br />
<strong>seismic</strong> <strong>activity</strong> were <strong>in</strong>cluded. As a first estimate, periods<br />
of seven days before and after an earthquake were<br />
taken. Data for the rema<strong>in</strong><strong>in</strong>g days were <strong>in</strong>cluded <strong>in</strong> the<br />
second part, belong<strong>in</strong>g to the <strong>seismic</strong>ally non-active<br />
periods (labelled non-SA and amount<strong>in</strong>g to 77 %). Then,<br />
to evaluate the predictability of radon concentration <strong>in</strong><br />
the non-SA periods, we estimated the performance of<br />
model trees on the non-SA data with cross-validation.
B.ZMAZEK ET AL.: RADON ANOMALIES IN SOIL GAS CAUSED BY SEISMIC ACTIVITY<br />
Figure 2. Time run of daily average radon concentration <strong>in</strong> <strong>soil</strong> <strong>gas</strong> and of <strong>soil</strong> temperature recorded with barasol probes <strong>in</strong> 60 cm<br />
deep boreholes at the Krško-1 station at the Orlica fault <strong>in</strong> the Krško bas<strong>in</strong> dur<strong>in</strong>g the period from June 2000 to January 2002. Local<br />
earthquakes with R E /R D equal to or less than 2 (Dobrovolsky et al., 1979), barometric pressure, air temperature and ra<strong>in</strong>fall at the<br />
near<strong>by</strong> meteorological station Bizeljsko are also shown.<br />
Furthermore, we <strong>in</strong>duced a model tree on the total<br />
non-SA data and measured its performance on the SA<br />
data <strong>in</strong> order to evaluate the practicability of predict<strong>in</strong>g<br />
radon concentration <strong>in</strong> the SA periods. If our hypothesis<br />
is true, the first prediction should be better than the<br />
second.<br />
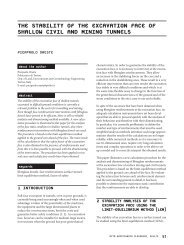
In order to facilitate the visualisation of radon <strong>anomalies</strong><br />
found <strong>by</strong> this technique, the quantity {(C Rn ) m /(C Rn ) p – 1}<br />
was plotted versus the time elapsed, as shown <strong>in</strong> Fig. 3<br />
for selected periods. Here, (C Rn ) m is the measured radon<br />
concentration and (C Rn ) p is the radon concentration<br />
predicted with decision trees. In the plots, <strong>in</strong> addition<br />
to the {(C Rn ) m /(C Rn ) p – 1} = 0 l<strong>in</strong>e, the ± 0.2 regions are<br />
<strong>in</strong>dicated <strong>by</strong> dashed l<strong>in</strong>es. Values fall<strong>in</strong>g beyond the<br />
dashed l<strong>in</strong>es are considered as <strong>anomalies</strong>. We see that<br />
some earthquakes are preceded and accompanied <strong>by</strong><br />
radon <strong>anomalies</strong> (denoted as CA case: correct anomaly<br />
related to <strong>seismic</strong> events), some are not (denoted as NA<br />
case: no anomaly observed for an earthquake), and, also,<br />
that there are <strong>anomalies</strong> dur<strong>in</strong>g <strong>seismic</strong>ally non-active<br />
periods (denoted as FA case: false anomaly appear<strong>in</strong>g<br />
without a <strong>seismic</strong> event). Sometimes a s<strong>in</strong>gle, short<br />
anomaly appears, but more often swarms of <strong>anomalies</strong><br />
ACTA GEOTECHNICA SLOVENICA, 2004 15.
B.ZMAZEK ET AL.: RADON ANOMALIES IN SOIL GAS CAUSED BY SEISMIC ACTIVITY<br />
are observed over longer periods. The duration period of<br />
a swarm, also called total time of <strong>anomalies</strong>, is def<strong>in</strong>ed as<br />
the time from the beg<strong>in</strong>n<strong>in</strong>g of the first to the stopp<strong>in</strong>g<br />
of the last anomaly <strong>in</strong> the swarm. On the other hand net<br />
time of <strong>anomalies</strong> <strong>in</strong> a swarm is called the sum of duration<br />
times of all <strong>anomalies</strong> <strong>in</strong> the swarm.<br />
All the <strong>anomalies</strong> found over the total period of observation<br />
are collected <strong>in</strong> Table 1. Several earthquakes<br />
occurr<strong>in</strong>g with<strong>in</strong> a few days (such as 14.04.00, 16.04.00<br />
and 17.04.00, 24.08.00 and 31.08.00, 29.10.00, 31.04.00<br />
and 06.11.00) are considered as one <strong>seismic</strong> event. The<br />
area of an anomaly is the area between the – 0.2 and<br />
+ 0.2 regions and the (C Rn ) m /(C Rn ) p – 1 versus t curve.<br />
For every earthquake the anomaly was observed at all<br />
stations (if <strong>in</strong> operation), though not at the same time.<br />
16.<br />
ACTA GEOTECHNICA SLOVENICA, 2004<br />
Data from Table 1 are summarized <strong>in</strong> Table 2. The<br />
number of CA cases largely outweighs the number of FA<br />
cases. The average surface area per anomaly is more than<br />
2-fold greater for CA than for FA. A positive anomaly<br />
(+) is one with {(C Rn ) m /(C Rn ) p – 1} > + 0.2, and negative<br />
(–), with {(C Rn ) m /(C Rn ) p – 1} < – 0.2. For CA, the number<br />
of ‘+’ cases is higher than the number of ‘–‘cases. The<br />
numbers of ‘+’ and ‘–‘ cases for FA are practically the<br />
same at all stations. In Table 3, the results for different<br />
threshold of (C Rn ) m /(C Rn ) p – 1 are shown, and we see<br />
that for {(C Rn ) m /(C Rn ) p – 1} > ± 0.2 optimal results were<br />
obta<strong>in</strong>ed.<br />
Table 1. Krško-1 station: earthquakes listed with (1) the date of occurr<strong>in</strong>g, (2) M L magnitude, and (3) R E /R D value (R E , distance<br />
of the measur<strong>in</strong>g site from the epicentre; R D , Dobrovolsky’s radius (Dobrovolsky et al., 1979)), and radon <strong>anomalies</strong> def<strong>in</strong>ed with<br />
{(C Rn ) m /(C Rn ) p – 1} < – 0.2 and > + 0.2 ((C Rn ) m is the measured radon concentration and (C Rn ) p is radon concentration predicted <strong>by</strong><br />
decision trees, cf. Fig. 3), and characterised <strong>by</strong>, (4) period of the anomaly, (5) type (CA – correct anomaly, FA – false anomaly, NA<br />
- no anomaly), (6) how many days the anomaly appeared before the <strong>seismic</strong> event, (7) duration of the anomaly <strong>in</strong> days (net time of<br />
<strong>anomalies</strong> / total time from the start of the first to the end of the last anomaly <strong>in</strong> the swarm), (8) number of <strong>anomalies</strong> <strong>in</strong> a swarm, and<br />
(9) surface area of the anomaly <strong>in</strong> day<br />
earthquakes radon <strong>anomalies</strong><br />
1 2 3 4 5 6 7 8 9<br />
13.04.99 0.8 1.4 13.04.-16.04.99 CA 1 3/4 2 0.34<br />
20.05.99 0.6 1.6 06.05.-23.05.99 CA 14 12/18 3 1.73<br />
- - - 11.08-12.08.99 FA - 1/1 1 0.02<br />
06.10.99 2.1 2.0 04.10.-10.10.99 CA 2 5/7 2 0.23<br />
- - - 21.02.-09.03.00 FA - 3/18 2 0.04<br />
14.04.00 1.8 1.6<br />
16.04.00 3.2 0.5 01.04.-11.04.00 CA 13 10/11 2 1.93<br />
17.04.00 2.2 1.2<br />
28.07.00 3.0 0.4 10.07.-15.07.00 CA 17 4/6 2 0.29<br />
24.08.00<br />
31.08.00<br />
1.8<br />
1.9<br />
1.0<br />
2.0<br />
25.08.-26.08.00 CA 7 1/1 1 0.01<br />
13.10.00 1.1 1.4 08.10.-12.10.00 CA 5 4/5 2 1.27<br />
29.10.00 2.7 1.5<br />
31.10.00 1.3 1.0 02.11.-07.11.00 CA 4 4/6 2 1.39<br />
06.11.00 1.0 2.0<br />
29.11.00 1.6 0.8 15.11.-16.12.00 CA 14 24/32 5 2.60<br />
- - - 02.01-12.01.01 FA - 10/11 2 0.80<br />
19.02.01 1.4 0.4 26.01.-04.03.01 CA 24 15/38 6 1.14<br />
- - - 09.03.-29.04.01 FA - 12/50 8 0.63<br />
04.06.01 2.7 2.0 01.06.-12.06.01 CA 3 2/12 2 0.15<br />
- - - 20.06.-24.06.01 FA - 5/5 1 0.39<br />
25.09.01 1.9 1.4 03.09.-11.10.01 CA 22 18/39 7 3.50<br />
- - - 09.11.-28.12.01 FA - 11/50 5 1.24
B.ZMAZEK ET AL.: RADON ANOMALIES IN SOIL GAS CAUSED BY SEISMIC ACTIVITY<br />
Figure 3. Time run of expression (C Rn ) m /(C Rn ) p – 1 (C Rn , radon concentration <strong>in</strong> <strong>soil</strong> <strong>gas</strong>, m – measured, p - predicted with decision<br />
trees) for selected periods at the Krško-1 stations. The solid l<strong>in</strong>e is drawn at {(C Rn ) m /(C Rn ) p – 1} = 0, and dashed l<strong>in</strong>es at – 0.2 and + 0.2.<br />
Numbers attached to the earthquake bars are R E /R D values. <strong>Radon</strong> <strong>anomalies</strong> are the (C Rn ) m /(C Rn ) p – 1 values outside the – 0.2 and 0.2<br />
regions.<br />
ACTA GEOTECHNICA SLOVENICA, 2004 17.
B.ZMAZEK ET AL.: RADON ANOMALIES IN SOIL GAS CAUSED BY SEISMIC ACTIVITY<br />
Table 2. Summary of characteristics of <strong>anomalies</strong> from Table 1.<br />
CA FA NA<br />
total number of <strong>anomalies</strong> a 36/12 19/6 0<br />
total duration of <strong>anomalies</strong> b / d 102/179 42/135 -<br />
average duration time / d 2.83 2.21 -<br />
total surface area of <strong>anomalies</strong> / d 14.58 3.12 -<br />
average surface area per anomaly / d 0.41 0.16 -<br />
number of ‘+’ <strong>anomalies</strong> 22 11 -<br />
number of ‘-‘ <strong>anomalies</strong> 14 8 -<br />
a number of <strong>anomalies</strong> / number of swarms<br />
b net time of duration of <strong>anomalies</strong> / total time of duration<br />
of swarms<br />
Table 3. Different threshold for (C Rn ) m /(C Rn ) p – 1, marked as A.<br />
18.<br />
Krško-1 A > ± 0,15 A > ± 0,20 A > ± 0,25<br />
PA 12 12 9<br />
LA 8 4 2<br />
NA 0 0 3<br />
4 CONCLUSIONS<br />
The analysis has shown that regression trees are reliable<br />
<strong>in</strong> identify<strong>in</strong>g radon <strong>anomalies</strong> <strong>caused</strong> <strong>by</strong> earthquakes,<br />
i.e., radon <strong>anomalies</strong> were observed for all earthquakes<br />
of R E /R D < 1. Unfortunately, the approach has shown a<br />
number of false <strong>anomalies</strong> (FA), that is, ones not related<br />
to <strong>seismic</strong> events. We hope to reduce this number <strong>by</strong><br />
<strong>in</strong>clud<strong>in</strong>g additional environmental parameters such as<br />
humidity of <strong>soil</strong> [36-37], direction and velocity of w<strong>in</strong>d<br />
[38], and snow coverage [37], and <strong>by</strong> extend<strong>in</strong>g the time<br />
with cont<strong>in</strong>ued measurements. This will improve the<br />
mach<strong>in</strong>e learn<strong>in</strong>g and hence <strong>in</strong>crease predictability of<br />
radon levels. Therefore, a great deal of further effort will<br />
be devoted to this approach.<br />
Acknowledgments – The study was funded <strong>by</strong> the<br />
Slovenian M<strong>in</strong>istry of Education, Science and Sport.<br />
ACTA GEOTECHNICA SLOVENICA, 2004<br />
REFERENCES<br />
[1] Kobal, I., Kristan, J., Škofljanec, M., Jerančič, S.<br />
and Ančik, M. (1978). Radio<strong>activity</strong> of spr<strong>in</strong>g and<br />
surface waters <strong>in</strong> the region of the uranium ore<br />
deposit at Žirovski vrh. J. Radioanal. Chem. 44,<br />
307-315.<br />
[2] Kobal, I. (1979). Radio<strong>activity</strong> of thermal and<br />
m<strong>in</strong>eral spr<strong>in</strong>gs <strong>in</strong> Slovenia. Health Phys. 37,<br />
239-242.<br />
[3] Kobal, I. and Renier, A. (1987). Radio<strong>activity</strong> of<br />
the Atomic spa at Podčetrtek, Slovenia, Yugoslavia.<br />
Health Phys. 53, 307-310.<br />
[4] Kobal, I. and Fed<strong>in</strong>a, Š. (1987). Radiation doses at<br />
the Radenci health resort. Radiat. Prot. Dosim. 20,<br />
257-259.<br />
[5] Kobal, I., Vaupotič, J., Mitić, D., Kristan, J., Ančik,<br />
M., Jerančič, S. and Škofljanec, M. (1990). Natural<br />
radio<strong>activity</strong> of fresh waters <strong>in</strong> Slovenia, Yugoslavia.<br />
Environ. Int. 16, 141-154.<br />
[6] Vaupotič, J. and Kobal, I. (2001). <strong>Radon</strong> exposure<br />
<strong>in</strong> Slovenian spas. Radiat. Prot. Dosim. 97, 265-270.<br />
[7] Vaupotič, J. (2002). <strong>Radon</strong> exposure at dr<strong>in</strong>k<strong>in</strong>g<br />
water supply plants <strong>in</strong> Slovenia. Health Phys. 83,<br />
901-906.<br />
[8] Ulomov, V.I. and Mavashev, B.Z. (1971). Forerunners<br />
of the Tashkent earthquake. Izv. Akad. Nauk<br />
Uzb. SSR, 188-200.<br />
[9] K<strong>in</strong>g, C.Y. (1978). <strong>Radon</strong> emanation on San<br />
Andreas fault. Nature 271, 516-519.<br />
[10] Ui, H., Moriuchi, H., Takemura, Y., Tsuchida, H.,<br />
Fujii I. and Nakamura, M. (1988). Anomalously<br />
high radon discharge from the Atotsugawa fault<br />
prior to the western Nagano Prefecture earthquake<br />
(M 6.8) of September 14, 1984. Tectonophys. 152,<br />
147-152.<br />
[11] Ohno, M. and Wakita, H. (1996). Co<strong>seismic</strong> radon<br />
changes of the 1995 Hyogo-ken Nanbu earthquake.<br />
J. Phys. Earth 44, 391-395.<br />
[12] Plan<strong>in</strong>ić, J., Radolić, V. and Čulo, D. (2000).<br />
Search<strong>in</strong>g for an earthquake precursors: temporal<br />
variations of radon <strong>in</strong> <strong>soil</strong> and water. Fizika B<br />
(Zagreb) 9, 75-82.<br />
[13] Plan<strong>in</strong>ić, J., Radolić, V. and Lazan<strong>in</strong>, Ž. (2001).<br />
Temporal variations of radon <strong>in</strong> <strong>soil</strong> related to<br />
earthquakes. Appl. Radiat. Isot. 55, 267-272.<br />
[14] Virk, H.S., Walia, V. and Kumar, N. (2001).<br />
Helium/radon precursory <strong>anomalies</strong> of Chamoli<br />
earthquake, Garhwal Himalaya, India. J. Geodyn.<br />
31, 201-210.<br />
[15] Yasuoka, Y. and Sh<strong>in</strong>nogi, M. (1997). Anomaly<br />
atmospheric radon concentration: a posible<br />
precursor of the 1995 Kobe, Japan, earthquake.<br />
Helth Phys. 72, 759-761.
[16] Zmazek, B., Vaupotič, J., Živčić, M., Premru, U.<br />
and Kobal, I. (2000). <strong>Radon</strong> monitor<strong>in</strong>g for earthquake<br />
prediction <strong>in</strong> Slovenia. Fizika B (Zagreb) 9,<br />
111-118.<br />
[17] Zmazek, B., Vaupotič, J., Živčić, M., Mart<strong>in</strong>elli, G.,<br />
Italiano, F. and Kobal, I. (2000). <strong>Radon</strong>, temperature,<br />
electrical conductivity and 3 He/ 4 He measurements<br />
<strong>in</strong> three thermal spr<strong>in</strong>gs <strong>in</strong> Slovenia. In:<br />
Book of Abstracts: New Aspects of Radiation Measurements,<br />
Dosimetry and Spectrometry, 2 nd Dresden<br />
Symposium on Radiation Protection, September<br />
10-14, Dresden, Germany.<br />
[18] Zmazek, B., Italiano, F., Živčić, M., Vaupotič, J.,<br />
Kobal, I. and Mart<strong>in</strong>elli, G. (2002). Geochemical<br />
monitor<strong>in</strong>g of thermal waters <strong>in</strong> Slovenia: relationships<br />
to <strong>seismic</strong> <strong>activity</strong>. Appl. Radiat. Isot. 57,<br />
919-930.<br />
[19] Zmazek, B., Vaupotič, J. and Kobal, I. (2002).<br />
<strong>Radon</strong>, temperature and electric conductivity <strong>in</strong><br />
Slovenian thermal waters as potential earthquake<br />
precursors. In: Book of Abstracts: 1 st Workshop on<br />
Natural Radionuclides <strong>in</strong> Hydrology and Hydrogeology,<br />
Centre Universitaire de Luxembourg, September<br />
4-7.<br />
[20] Zmazek, B. (2004). Influence of Seismic Activity on<br />
<strong>Radon</strong> Levels <strong>in</strong> Thermal Waters and Soil Gas at<br />
Selected Sites <strong>in</strong> Slovenia. PhD Thesis, University of<br />
Maribor, Faculty for Civil Eng<strong>in</strong>eer<strong>in</strong>g.<br />
[21] Zmazek, B., Vaupotič, J., Bidovec, M., Poljak, M.,<br />
Živčić, M., P<strong>in</strong>eau, J. F. and Kobal, I. (2000). <strong>Radon</strong><br />
monitor<strong>in</strong>g <strong>in</strong> <strong>soil</strong> <strong>gas</strong> tectonic faults <strong>in</strong> the Krško<br />
bas<strong>in</strong>. In: Book of Abstracts: New Aspects of Radiation<br />
Measurements, Dosimetry and Spectrometry,<br />
2 nd Dresden Symposium on Radiation Protection,<br />
September 10-14, Dresden, Germany.<br />
[22] Zmazek, B., Živčić, M., Vaupotič, J., Bidovec, M.,<br />
Poljak, M. and Kobal, I. (2002). Soil radon monitor<strong>in</strong>g<br />
<strong>in</strong> the Krško bas<strong>in</strong>, Slovenia. Appl. Radiat.<br />
Isot. 56, 649-657.<br />
[23] Di Bello, G., Ragosta, M., He<strong>in</strong>icke, J., Koch, U.,<br />
Lapenna, V., Piscitelli, S., Macchiato, M. and Mart<strong>in</strong>elli,<br />
G. (1998). Time dynamics of background<br />
noise <strong>in</strong> geoelectrical and geochemical signals: an<br />
application <strong>in</strong> a <strong>seismic</strong> area of Southern Italy. Il<br />
Nuovo Cimento 6, 609-629.<br />
[24] Cuomo, V., Di Bello, G., Lapenna, V., Piscitelli, S.,<br />
Telesca, L., Macchiato M. and Serio, C. (2000).<br />
Robust statistical methods to discrim<strong>in</strong>ate extreme<br />
events <strong>in</strong> geoeletrical precursory signals: implications<br />
with earthquake prediction. Nat. Hazard 21,<br />
247-261.<br />
[25] Biagi, P.F., Erm<strong>in</strong>i, A., K<strong>in</strong>gsley, S.P., Khatkevich,<br />
Y.M. and Gordeev, E.I. (2001). Difficulties with<br />
<strong>in</strong>terpret<strong>in</strong>g changes <strong>in</strong> groundwater <strong>gas</strong> content<br />
B.ZMAZEK ET AL.: RADON ANOMALIES IN SOIL GAS CAUSED BY SEISMIC ACTIVITY<br />
as earthquake precursors <strong>in</strong> Kamchatka, Russia. J.<br />
Seismol. 5, 487-497.<br />
[26] Belyaev, A.A. (2001). Specific features of radon<br />
earthquake precursors. Geochem. Int. 12, 1245-1250.<br />
[27] Negarestani, A., Setayeshi, S., Ghannadi-Maragheh,<br />
M. and Akashe, B. (2001). Layered neural networks<br />
based analysis of radon concentration and environmental<br />
parameters <strong>in</strong> earthquake prediction. J.<br />
Environ. Radioact. 62, 225-233.<br />
[28] Plan<strong>in</strong>ić, J., Vuković, B., Radolić, V., Faj, Z. and<br />
Stanić, D. (2003). Determ<strong>in</strong>istic chaos <strong>in</strong> radon<br />
time variations. In: Proceed<strong>in</strong>g of the 5 th Symposium<br />
of the Croatian Radiation Protection Association,<br />
HDZZ-CRPA, Zagreb, 349-354.<br />
[29] Ste<strong>in</strong>itz, G., Beg<strong>in</strong>, Z.B. and Gazit-Yaari, N. (2003).<br />
Statistically significant relation between radon flux<br />
and weak earthquakes <strong>in</strong> Dead Sea rift valley. Geology<br />
31, 505-508.<br />
[30] Zmazek, B., Todorovski, L., Džeroski, S., Vaupotič,<br />
J. and Kobal, I. (2003). Application of decision<br />
trees to the analysis of <strong>soil</strong> radon data for earthquake<br />
prediction. Appl. Radiat. Isot. 58, 697-706.<br />
[31] Dobrovolsky, I.P., Zubkov, S.I. and Miachk<strong>in</strong>, V.I.<br />
(1979). Estimation of the size of earthquake preparation<br />
zones. Pure Appl. Geophys. 117, 1025-1044.<br />
[32] Breiman, L., Friedman, J.H., Olshen, R.A and<br />
Stone, C.J. (1984). Classification and Regression<br />
Trees. Wadsworth, Belmont.<br />
[33] Witten, I.H and Frank, E. (1999). Data M<strong>in</strong><strong>in</strong>g:<br />
Practical Mach<strong>in</strong>e Learn<strong>in</strong>g Tools and Techniques<br />
with Java Implementations. Morgan Kaufmann,<br />
San Francisco.<br />
[34] Qu<strong>in</strong>lan, J.R. (1992). Learn<strong>in</strong>g with cont<strong>in</strong>uous<br />
classes, In: Proceed<strong>in</strong>gs of the Fifth Australian Jo<strong>in</strong>t<br />
Conference on Artificial Intelligence, World Scientific,<br />
S<strong>in</strong>gapore, 343-348.<br />
[35] Wang, Y. and Witten, I.H. (1997). Induction of<br />
model trees for predict<strong>in</strong>g cont<strong>in</strong>uous lasses. In:<br />
Proceed<strong>in</strong>gs of the Poster Papers of the European<br />
Conference on Mach<strong>in</strong>e Learn<strong>in</strong>g, University of<br />
Economics, Faculty of Informatics and Statistics,<br />
Prague.<br />
[36] Ioannides, K.G., Papachristodoulou, C., Karamanis,<br />
D.T., Stamoulis, K.C. and Mertzimekis, T.J.<br />
(1996). Measurements of 222 Rn migration <strong>in</strong> <strong>soil</strong>. J.<br />
Radioanal. Nucl. Chem. 208, 541-547.<br />
[37] Fujiyoshi, R., Morimoto, H. and Sawamura, S.<br />
(2002). Investigation of <strong>soil</strong> radon variation dur<strong>in</strong>g<br />
the w<strong>in</strong>ter months <strong>in</strong> Sapporo, Japan. Chemosphere<br />
47, 369-373.<br />
[38] Riley, W.J., Gadgil, A.J. and Nazaroff, W.W. (1996).<br />
W<strong>in</strong>d-<strong>in</strong>udced ground-surface pressures around a<br />
s<strong>in</strong>gle-family house. J. W<strong>in</strong>d Eng<strong>in</strong>. Ind. Aerodyn.<br />
61, 153-167.<br />
ACTA GEOTECHNICA SLOVENICA, 2004 19.