CASSAVA OPPORTUNTIES IN NIGERIA - FAO.org
CASSAVA OPPORTUNTIES IN NIGERIA - FAO.org
CASSAVA OPPORTUNTIES IN NIGERIA - FAO.org

Create successful ePaper yourself
Turn your PDF publications into a flip-book with our unique Google optimized e-Paper software.
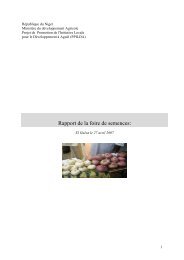
naira per tonne<br />
90,000<br />
80,000<br />
70,000<br />
60,000<br />
50,000<br />
40,000<br />
30,000<br />
20,000<br />
10,000<br />
0<br />
1993 1<br />
1993 5<br />
1993 9<br />
1994 1<br />
1994 5<br />
1994 9<br />
1995 1<br />
1995 5<br />
1995 9<br />
1996 1<br />
1996 5<br />
1996 9<br />
Figure 4-2 Monthly Prices<br />
Cassava Gari Maize<br />
1998 1<br />
1998 5<br />
1998 9<br />
2000 1<br />
2000 5<br />
2000 9<br />
2001 1<br />
2001 5<br />
2001 9<br />
2002 1<br />
2002 5<br />
2002 9<br />
2003 1<br />
2003 5<br />
Regional gari prices deflated by the US dollar for<br />
this same period from 1993 to the end of 2002 are<br />
illustrated in Figure 4-3. The impression is that<br />
prices move in unison around the country. Other<br />
than some individual months where isolated<br />
peaks and dips appear, regional prices fall within<br />
a relatively narrow band. Prices in the South East<br />
have been relatively higher of late, while prices in<br />
the North Central are shown to be dropping.<br />
US$ per tonne<br />
1,400<br />
1,200<br />
1,000<br />
800<br />
600<br />
400<br />
200<br />
0<br />
1993 1<br />
1994 6<br />
1994 9<br />
1994 12<br />
1995 3<br />
1995 6<br />
1995 9<br />
1995 12<br />
1996 3<br />
1996 6<br />
1996 9<br />
1996 12<br />
1998 3<br />
1998 6<br />
1998 9<br />
1998 12<br />
2000 3<br />
2000 6<br />
2000 9<br />
2000 12<br />
2001 3<br />
2001 6<br />
2001 9<br />
2001 12<br />
2002 3<br />
2002 6<br />
2002 9<br />
2002 12<br />
North Central North East North West South East South South South West<br />
Figure 4-3 Monthly Gari Prices by Zone<br />
Figure 4-4 provides a slightly different approach to<br />
examining regional prices. In this figure gari prices<br />
for each region are averaged for each month over<br />
the time period 1993 to 2002.<br />
The lack of seasonality in gari pricing, other than a<br />
few outliers, confirms the conclusion that the<br />
relatively consistent supply of cassava roots<br />
provides a fairly predictable price throughout the<br />
year and a relatively narrow gari price band<br />
across the country.<br />
19<br />
US$ per tonne<br />
450<br />
400<br />
350<br />
300<br />
250<br />
200<br />
150<br />
100<br />
50<br />
0<br />
January<br />
February<br />
March<br />
April<br />
May<br />
June<br />
July<br />
August<br />
September<br />
October<br />
November<br />
December<br />
North Central North East North West South East South South South West<br />
Figure 4-4 Average Monthly Gari Prices<br />
Cassava has a unique characteristic in that it can<br />
be continuously harvested and marketed<br />
throughout the year. This provides a consistent<br />
supply of product, available for immediate<br />
processing at a fairly predictable price throughout<br />
the year. This could be cassava’s greatest<br />
attribute 19 , relative to competing commodities like<br />
maize.<br />
As illustrated in the following map, gari prices 20<br />
below N20 000 are primarily found in the South<br />
West and North Central. Gari prices are highest in<br />
the South South, North East and North West.<br />
Map 4-2: Gari prices by State (N/tonne)<br />
Data on the cost of cassava production and<br />
processing was not readily available. Costs of<br />
production that were available were often<br />
19<br />
The fact that it is not is indicative of problems unrelated to<br />
this one delightful attribute.<br />
20 Gari prices were not available for Borno and Kebbi.