CASSAVA OPPORTUNTIES IN NIGERIA - FAO.org
CASSAVA OPPORTUNTIES IN NIGERIA - FAO.org
CASSAVA OPPORTUNTIES IN NIGERIA - FAO.org

Create successful ePaper yourself
Turn your PDF publications into a flip-book with our unique Google optimized e-Paper software.
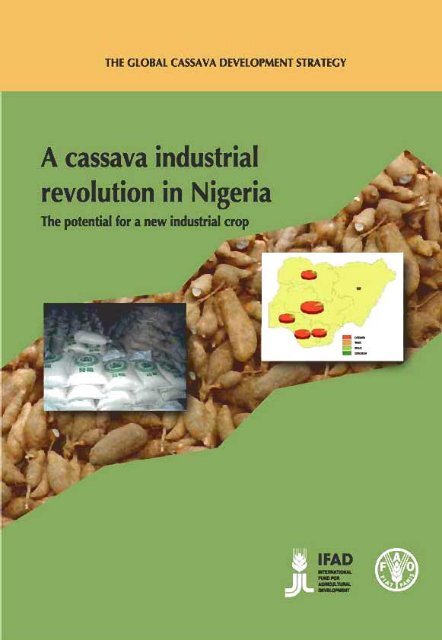
THE GLOBAL <strong>CASSAVA</strong> DEVELOPMENT STRATEGY<br />
A Cassava Industrial<br />
Revolution in Nigeria<br />
The Potential for a New<br />
Industrial Crop
THE GLOBAL <strong>CASSAVA</strong> DEVELOPMENT STRATEGY<br />
A cassava industrial revolution in Nigeria<br />
The potential for a new industrial crop<br />
Truman P. Phillips and Daphne S. Taylor<br />
dTp Studies Inc., Canada<br />
Lateef Sanni<br />
University of Agriculture, Abeokuta<br />
International Institute of Tropical Agriculture, Ibadan, Nigeria<br />
Malachy O. Akoroda<br />
University of Ibadan<br />
International Institute of Tropical Agriculture, Ibadan, Nigeria<br />
<strong>IN</strong>TERNATIONAL FUND FOR AGRICULTURAL DEVELOPMENT<br />
FOOD AND AGRICULTURE ORGANIZATION OF THE UNITED NATIONS<br />
Rome, 2004
The designations employed and the presentation of material in<br />
this information product do not imply the expression of any<br />
opinion whatsoever on the part of the Food and Agriculture<br />
Organization of the United Nations concerning the legal or<br />
development status of any country, territory, city or area or of its<br />
authorities, or concerning the delimitation of its frontiers or<br />
boundaries.<br />
All rights reserved. Reproduction and dissemination of material in this<br />
information product for educational or other non-commercial purposes are<br />
authorized without any prior written permission from the copyright holders<br />
provided the source is fully acknowledged. Reproduction of material in this<br />
information product for resale or other commercial purposes is prohibited<br />
without written permission of the copyright holders. Applications for such<br />
permission should be addressed to the Chief, Publishing Management Service,<br />
Information Division, <strong>FAO</strong>, Viale delle Terme di Caracalla, 00100 Rome, Italy or<br />
by e-mail to copyright@fao.<strong>org</strong><br />
© <strong>FAO</strong> 2004<br />
I
CONTENTS<br />
List of Tables ............................................................................................................................................... v<br />
List of Figures ............................................................................................................................................. v<br />
List of Maps ................................................................................................................................................ vi<br />
Preface ....................................................................................................................................................... vii<br />
Acknowledgements ...................................................................................................................................ix<br />
Explanatory Note.........................................................................................................................................x<br />
Acronyms and Abbreviations ...................................................................................................................xi<br />
Executive Summary..................................................................................................................................xii<br />
1 Introduction .........................................................................................................................................1<br />
1.1 Study Objectives..........................................................................................................................1<br />
1.2 The Cassava Statistical Handbook ............................................................................................1<br />
1.3 Regional Production Models ......................................................................................................2<br />
1.4 The Revolution ............................................................................................................................3<br />
2 Cassava Production............................................................................................................................ 4<br />
2.1 Current Status.............................................................................................................................4<br />
2.2 Future Targets.............................................................................................................................5<br />
2.3 New Initiatives.............................................................................................................................6<br />
2.4 The Way Forward.......................................................................................................................8<br />
3 Processing and Utilization ................................................................................................................. 9<br />
3.1 Current Status.............................................................................................................................9<br />
3.2 Future Targets...........................................................................................................................13<br />
3.3 New Initiatives...........................................................................................................................14<br />
3.4 The Way Forward.....................................................................................................................16<br />
4 Prices and Margins ...........................................................................................................................18<br />
4.1 Current Status...........................................................................................................................18<br />
4.2 Future Targets...........................................................................................................................21<br />
4.3 New Initiatives...........................................................................................................................23<br />
4.4 The Way Forward.....................................................................................................................25<br />
5 Development Clusters ......................................................................................................................27<br />
5.1 Current Status...........................................................................................................................27<br />
5.2 Future Targets...........................................................................................................................29<br />
5.3 New Initiatives...........................................................................................................................30<br />
5.4 The Way Forward.....................................................................................................................32<br />
6 The Ultimate Way Forward ...............................................................................................................35<br />
6.1 The Objective ............................................................................................................................35<br />
6.2 Beneficiaries...............................................................................................................................35<br />
6.3 The Process ................................................................................................................................35<br />
6.4 Outcomes and Activities ...........................................................................................................36<br />
References.................................................................................................................................................41<br />
Appendix A ................................................................................................................................................43<br />
Appendix B ................................................................................................................................................48<br />
II
LIST OF TABLES<br />
Table 2-1 Cassava Production by Zone 2000-2002 (tonnes) ________________________________ 4<br />
Table 3-1 Consumption Pattern by Zone and Cassava Product _____________________________ 9<br />
Table 3-2 Daily Consumption of Cassava per capita ______________________________________ 9<br />
Table 3-3 Frequency of Cassava Consumption _________________________________________ 10<br />
Table 3-4 Daily Processing Capacity by Scale of Operation and Product ____________________ 10<br />
Table 3-5 Cassava Demand Estimates by President’s Initiative by 2007 (tonnes) _____________ 13<br />
Table 3-6 A Conservative Estimate of Demand (tonnes) __________________________________ 13<br />
Table 3-7 Middle of the Road’ Estimate of Potential Demand for Cassava (tonnes) ____________ 13<br />
Table 4-1 Cost of Clearing Land in 2000 (N per Ha) ______________________________________ 20<br />
Table 4-2 Calculated Cassava Root and Processing Price ________________________________ 22<br />
Table 4-3 Thai Exports Value and Quantity 2002 ________________________________________ 22<br />
Table 4-4 Marketing Impact of Scenario where Yield Increase to 20 tonnes/ha _______________ 24<br />
Table 5-1 Marketed Produce and Distances to Markets___________________________________ 27<br />
Table 5-2 Road Blocks for a Selection of Routes ________________________________________ 27<br />
Table 5-3 Transportation Routes and Unit Costs ________________________________________ 28<br />
Table 5-4 Number of Plants Required to Meet Estimated Demand __________________________ 30<br />
Table 5-5 Site Selection Variables and Related Indicators ________________________________ 30<br />
Table 5-6 Results of Site Selection Criteria_____________________________________________ 31<br />
LIST OF FIGURES<br />
Figure 2-1 Leading World Producers of Cassava....................................................................................4<br />
Figure 2-2 Cassava Production 1980-2002............................................................................................... 4<br />
Figure 2-3 Production Scenarios for Cassava to 2020............................................................................5<br />
Figure 2-4 Cassava Area 1980 to Targeted 2007 .....................................................................................6<br />
Figure 2-5 Cassava Yields 1980 to Targeted 2007...................................................................................6<br />
Figure 2-6 Comparison with International Yields ....................................................................................6<br />
Figure 2-7 Cassava Production for Alternative Scenarios .....................................................................7<br />
Figure 2-8 Cassava Area for Alternative Scenarios ................................................................................8<br />
Figure 2-9 Total Labour for Alternative Scenarios ..................................................................................8<br />
Figure 4-1 Historical Price Series............................................................................................................18<br />
Figure 4-2 Monthly Prices ........................................................................................................................19<br />
Figure 4-3 Monthly Gari Prices by Zone .................................................................................................19<br />
Figure 4-4 Average Monthly Gari Prices.................................................................................................19<br />
Figure 4-5 Cassava-Maize Price Ratio and Cassava Production .........................................................21<br />
Figure 4-6 Volume Thai Exports ..............................................................................................................22<br />
Figure 4-7 Value Thai Exports .................................................................................................................22<br />
Figure 4-8 Marketable Cassava by Alternative Scenarios ....................................................................23<br />
Figure 4-9 A Roadmap for Supply Chain Development ........................................................................25<br />
Figure 5-1 Transaction Costs Between Rural and Urban Centres.......................................................28<br />
IV
LIST OF MAPS<br />
Map 2-1 Crop Production by State 2002 ................................................................................................... 5<br />
Map 3-1 Urban Centres and Express Roads in Nigeria.........................................................................14<br />
Map 4-1 Cassava Tuber Prices by State (N/tonne) ................................................................................18<br />
Map 4-2: Gari prices by State (N/tonne)..................................................................................................19<br />
Map 4-3 Primary Marketed Crops Base Scenario ..................................................................................23<br />
Map 4-4 Primary Marketed Crops in 20 tonnes/ha Scenario ................................................................24<br />
Map 5-1 Location of Textile Firms ...........................................................................................................29<br />
Map 5-2 Location of Bakeries ..................................................................................................................29<br />
Map 5-3 States Identified for Expanded Cassava Production..............................................................32<br />
Map 5-4 States Identified for Expanded Industrial Cassava Processing ............................................32<br />
Map 5-5 LGAs identified by ADP Staff as Best for Cassava Development .........................................32<br />
V
PREFACE<br />
In Africa, cassava is gradually being transformed from a famine-reserve commodity and rural food staple<br />
to a cash crop for urban consumption. For the cassava transformation to advance to the next stage of<br />
livestock feed and industrial raw material, labour-saving production, harvesting and processing<br />
technologies are needed to reduce costs, improve productivity and make cassava more competitive. Yet<br />
the transformation will not continue unless new uses and new markets are identified to absorb the<br />
increase in production.<br />
Nigeria is the world’s largest cassava producer; its cassava transformation is the most advanced in Africa.<br />
However, the scope for increasing the use of cassava in Nigeria’s industries is, to a large extent,<br />
determined by the development of an efficient and well-integrated production and marketing system, to<br />
assure a steady supply of cassava products of stable, high quality standards and appropriate price, and<br />
of specific properties required by domestic industries and export markets. Thus, public and private<br />
investments in research and development required to develop cassava products for industrial uses, if well<br />
targeted, could offer good returns and prospects for the future of cassava in Nigeria.<br />
The belief that a growing demand for cassava will spur rural industrial development and contribute to the<br />
economic development of producing, processing and trading communities and well-being of numerous<br />
disadvantaged people in the world, has prompted the development of the Global Cassava Development<br />
Strategy. The Strategy was endorsed at the International Validation Forum jointly <strong>org</strong>anized by the Food<br />
and Agriculture Organization of the United Nations (<strong>FAO</strong>) and the International Fund for Agriculture<br />
Development (IFAD) held in Rome, Italy in April 2000. It suggests that industry analysis in cassavaproducing<br />
countries should be undertaken to indicate current status, strengths, weaknesses and issues<br />
for attention and action needed to resolve pressing constraints and take advantage of markets and<br />
business opportunities as well as to encompass finding of committed national champions.<br />
The study on “A Cassava Industrial Revolution in Nigeria” coordinated by the International Institute of<br />
Tropical Agriculture (IITA) is in line with the Global Cassava Strategy. It was prepared as a contribution to<br />
the joint effort by IITA and the Federal Government of Nigeria to enhance the Nigerian Cassava Industry.<br />
This has been followed-up with similar support from many of the petroleum and crude oil producing<br />
companies operating in Nigeria to ensure that this effort is achieved.<br />
As part of the study, a nationwide cassava industry analysis was commissioned to dTp Studies Inc. of<br />
Canada to determine the actual and potential size of the market for cassava and cassava based products<br />
in Nigeria and to assess what is required in terms of economic, social and physical investments to<br />
develop an efficient cassava industrial sector. The study team comprising of agricultural economists from<br />
dTp Studies Inc., a local post harvest specialist and an agronomist began work in November 2003 with an<br />
extensive search for available data on the Nigerian cassava industry. This involved visits by the study<br />
team to all state agricultural development programmes (ADPs), federal offices and key industrial<br />
informants. Duplication was minimized by not visiting those industries already visited by previous<br />
consultants; instead information from their reports was used.<br />
This report together with the resulting Statistical Handbook forms a pool of information from which private<br />
sector investor information can be drawn. It is obvious that in its current form, the information contained<br />
in this report may be too detailed to interest large, medium and small scale investors. Condensed reports<br />
and pamphlets for industrial application should be gleamed from this report to suit specific end user<br />
interests.<br />
It is hoped that the available information will contribute to supporting the potential of cassava to being an<br />
engine of industrial revolution in Nigeria and so contribute to the development of action plans for the<br />
VI
industry, including the who, what, why and how, plus the question “Whose money should be used to<br />
guide investment and research decisions in the cassava subsector?”<br />
Mahmoud B. Sohl<br />
Director<br />
<strong>FAO</strong> Plant Production and Protection Division<br />
VII
ACKNOWLEDGEMENTS<br />
The survey work that leads to the analysis described in this publication was commissioned by the<br />
International Institute of Tropical Agriculture, Ibadan, Nigeria. The <strong>FAO</strong> Crop and Grassland Service<br />
wishes to acknowledge the excellent work and substantive contributions of the authors: Truman P.<br />
Phillips and Daphne S. Taylor of dTp Studies Inc., Canada; Lateef Sanni of the University of Agriculture,<br />
Abeokuta and the International Institute of Tropical Agriculture, Nigeria and Malachy Akoroda of the<br />
University of Ibadan and the International Institute of Tropical Agriculture, Nigeria.<br />
Useful information was provided by key informants at all the study locations in Nigeria; their special input<br />
and their friendly and accommodative nature during the field stages of this study are very much<br />
appreciated. In particular, the authors would like to thank and express gratitude to the executives and<br />
staff:<br />
Cassava farming village, Boodo, Ogun State<br />
Agro-Industrial Development Unit, Abuja<br />
Federal Institute of Industrial Research, Oshodi, Lagos<br />
National Root Crops Research Institute, Umudike<br />
Project Coordinating Unit, Abuja<br />
ADDIS Engineering Ltd, Isolo<br />
Peak Products, Abeokuta<br />
Root and Tuber Expansion Programme, Ijebu Ife<br />
RUSEP, IITA<br />
Starron Engineers, Mushin, Lagos<br />
Ifo Fufu Market, Ogun State<br />
Obasanjo Farms<br />
Odeda Farm Institute, Ogun State<br />
Agricultural Development Programmes of Oyo, Ogun, Osun, Ondo, Edo, Delta, Enugu, Imo,<br />
Rivers, Cross Rivers, Abia, Benue, Kaduna, Kogi<br />
AGIP Oil Company LTD, Rivers<br />
Consultancy Unit, University of Agriculture, Abeokuta<br />
National Association of Small Medium Enterprise in Nigeria<br />
Works and Transport [Engr. A.E. Ojobo], Edo<br />
Real Foods, Asejire, Oyo State<br />
The Nigerian Cassava Growers Association<br />
Agricultural Projects and Extension Services, Shell, Rivers<br />
Adrianna Gabrielli, <strong>FAO</strong>, is thanked for final editing and layout. Any remaining mistakes are the<br />
responsibility of the authors.<br />
Finally, NeBambi Lutaladio, Agricultural Officer of the <strong>FAO</strong> Crop and Grassland Service is thanked for his<br />
efforts which made possible the release of this publication within the framework of the Global Cassava<br />
Development Strategy.<br />
The study was funded by the Federal Government of Nigeria (FGN), the Niger Delta Development<br />
Commission (NDDC), the Nigerian National Petroleum Corporation (NNPC), the States of the South<br />
South and South East Nigeria, and IITA. Gratitude is expressed to these <strong>org</strong>anizations.<br />
Eric A. Kueneman<br />
Chief<br />
Crop and Grassland Service<br />
<strong>FAO</strong> Plant Production and Protection Division<br />
VIII
Statistics<br />
EXPLANATORY NOTE<br />
The statistical information in this study has been prepared from figures and information available to:<br />
- <strong>FAO</strong> Statistical Database (<strong>FAO</strong>STAT) and Web pages<br />
- Federal Office of Statistics, Nigeria<br />
- Agricultural development programmes (ADPs)<br />
- IITA’s Rural Sector Enhancement Programme (RUSEP)<br />
- Central Bank of Nigeria (CBN)<br />
- FMANR<br />
- State Agro-Processing and Market Expansion Groups (SAMEG)<br />
- Projects Coordinating Unit (PCU)<br />
- Ministry of Health and Nutrition of Nigeria - National Consumption Survey<br />
- Root and Tuber Expansion Program (RTEP) baseline survey<br />
- Nigeria’s cassava industry: statistical handbook<br />
- World Bank web site<br />
- United States Trade Representative Office web page<br />
- Supply-Chain Council Web page<br />
- International Food Policy Research Institute (IFPRI)<br />
- Federal Ministry of Agriculture and Natural Resources Nigeria (FMANRN)<br />
- Corporate Affairs Commission (CAMA) Web page<br />
Symbols<br />
The following symbols are used in this publication:<br />
$ = US dollars<br />
N = Naira<br />
N per Ha = Naira per hectare<br />
mt = metric tonnes<br />
mmt = million metric tonnes<br />
Yld = Yield<br />
km = kilometre<br />
N per km = Naira per kilometre<br />
Units<br />
Unless otherwise indicated, the metric system is used in this publication.<br />
Exchange rates<br />
During the study period the local currency Naira was 138.75 to US$ 1.00.<br />
IX
ACRONYMS AND ABBREVIATIONS<br />
ADP Agricultural development program<br />
AGIP Agip Oil Company LTD<br />
ARCEDEM African Regional Center for Engineering Designs and Manufacturing<br />
CAMA Corportate Affairs Commission<br />
CBN Central Bank of Nigeria<br />
DFID Department of International Development – United Kingdom<br />
EU European Union<br />
<strong>FAO</strong>STAT <strong>FAO</strong> Statistical Database<br />
FIIRO Federal Institute of Industrial Research, Osodi<br />
FMANR Federal Ministry of Agriculture and Natural Resources Nigeria<br />
IDEAA Initiative for Development and Equity on African Agriculture<br />
IFAD International Fund for Agricultural Development<br />
IFPRI International Food Policy Research Institute<br />
IITA International Institute of Tropical Agriculture<br />
LGA Local Government Authority<br />
NEPAD New Partnership for Africa’s Development<br />
NNPC Nigerian National Petroleum Corporation<br />
NRI Natural Resources Institute<br />
PCU Projects Coordinating Unit<br />
PRODA Product Development Agency<br />
RTEP Root and Tuber Expansion Program<br />
RUSEP Rural Sector Enhancement Programme<br />
SAMEG State Agro-Processing and Market Expansion Groups<br />
SCOR Supply Chain Operations Reference<br />
UNAAB University of Agriculture Abeokuta - Nigeria<br />
USAID United States Agency for International Development<br />
X
EXECUTIVE SUMMARY<br />
The objective of this report is to provide comprehensive information that will guide investment decisions in<br />
the Nigerian cassava subsector. Specifically the study team was mandated to develop a report that<br />
covered four topic areas; cassava production, processing and utilization, prices and margins and<br />
development clusters. Each topic is discussed in terms of the current status, future targets, new initiatives<br />
and a suggested way forward.<br />
It was the intention of this study to draw heavily on data collected and collated by the industry and State<br />
and Federal Governments. In travelling across the country it was soon realized that much of the data<br />
desired for this study of cassava did not exist. If it did exist, in many cases, it was not in a user friendly<br />
format that could be quickly or easily analysed. These realities led the team to develop the first Nigerian<br />
Cassava Industry Statistical Handbook.<br />
The Handbook contains over 100 pages of state and national level data in tabular form relevant to the<br />
Nigerian cassava industry. The sections provide data on production, processing, utilization, prices,<br />
enterprise budgets, transportation, domestic economic indicators and international cassava data. The<br />
data is intended to provide a baseline for monitoring changes in the industry and a guide for investments<br />
and research. Although some tables are incomplete, sections and table headings are provided, as a<br />
guide for future industrial data collection.<br />
The Handbook should be used as a companion when reading this report. Data summarized in this report<br />
can be examined in detailed tabular form in the Handbook. It is hoped that as the use and availability of<br />
the handbook become widespread, industrial stakeholders, policy-makers and national researchers will<br />
be able to undertake their own or similar analysis and interpretation of the data when and as needed. This<br />
report together with the Statistical Handbook forms a pool of information from which private sector<br />
investor information can be drawn.<br />
The second analytical contribution of this study was the development of Nigerian regional cassava<br />
production models. Regional production models have traditionally been used to assess the potential<br />
responses of farmers to changes in policy, technology and market conditions. In this study, linear<br />
programming was selected as an appropriate technique to use. Ideally, these models are based on<br />
enterprise budgets which provide an indication of quantity and cost of production inputs and timing of<br />
these activities.<br />
The 40 plus crop enterprise budgets collected from six states, published in the 2000/2001 Advisors<br />
Handbook, formed the core data for these models. The constraints to the model were regional land<br />
availability and producer food consumption requirements. The regional models are annual models that<br />
maximize gross margins (revenue minus input and labour expenditures) subject to minimal farmer<br />
consumption and limited by available land. A feature of the models is the assumption that the traditional<br />
harvesting of cassava continues into the second year. The implication being for an annual model,<br />
enterprises containing cassava require 2 ha of land rather than 1 ha of land, as do all other enterprises.<br />
The regional models were used to compare four scenarios against a base scenario. The base scenario is<br />
designed to represent current regional conditions of land use, food consumption and agricultural<br />
production. Land constraints are used to ensure that the base results are similar to calculated regional<br />
averages. The four scenarios are based around the permutations of two changes. One change results in<br />
cassava being harvested in one year as opposed to two years. The second is the adoption of high<br />
yielding varieties. The results of these models assisted the analysis of future production, processing and<br />
utilization targets and initiatives in the report.<br />
.<br />
XI
1 <strong>IN</strong>TRODUCTION<br />
In the early years of Nigeria’s independence,<br />
agriculture accounted for nearly 60 percent of<br />
Gross Domestic Product (GDP) and 80 percent of<br />
export earnings (Shaib, Aliyu, and Bakshi, 1997).<br />
Today agriculture accounts for a third of GDP and<br />
less than one percent of export earnings, oil<br />
accounting for the rest 1 .<br />
Although room exists for Nigeria to prosper, the<br />
country continues to face a number of challenges.<br />
Policies to date have yet to diversify the<br />
productive base away from the continued reliance<br />
on a single industry, petroleum. There continues<br />
to be underutilization of industrial capacity, high<br />
unemployment and political anxiety.<br />
A desirable outcome for the Nigerian populous<br />
and current government is a strong diversified<br />
economy able to generate employment and<br />
sustain incomes for its citizens. Increasing the<br />
productivity of agriculture, increasing the<br />
utilization of industrial capacity, diversifying export<br />
earnings and providing gainful employment for its<br />
population are all desirable targets.<br />
To achieve this, President Olusegun Obasanjo’s<br />
newly elected government, in 1999, pledged to<br />
support the agricultural sector and announced the<br />
need for immediate action in five agricultural<br />
subsectors: cassava, rice, vegetable oils, livestock<br />
and tree crops. The cassava initiative alone seeks<br />
to generate US$5 billion in export revenue by<br />
2007. Since its launch in July 2002, great<br />
excitement has been generated, creating new<br />
hopes and even greater expectations.<br />
To compliment this Initiative, IITA together with<br />
the Nigerian National Petroleum Corporation<br />
(NNPC) recently signed a four year action plan<br />
providing local communities with cassava mosaic<br />
disease resistant planting materials and<br />
production and marketing support. These<br />
improved cultivars also produce more cassava per<br />
plant. Their distribution to farmers could lead to a<br />
1 Oil represents 99.6 percent of total exports, valued at 1 979<br />
337 million N or US$17 418 million in 2001. There are 12<br />
pages of exports classified by commodity and country in the<br />
2001 Nigeria Foreign Trade Summary compared to 564 pages<br />
of imports (Federal Office of Statistics, 2001).<br />
1<br />
substantial increase in production (IITA, 2003).<br />
The question is can the utilization of cassava grow<br />
sufficiently to mirror farmer’s enhanced ability to<br />
produce cassava?<br />
1.1 STUDY OBJECTIVES<br />
The primary objective of this study was to<br />
determine the actual and potential size of the<br />
market for cassava and cassava based products<br />
in Nigeria and what is required in terms of<br />
economic, social and physical investments to<br />
develop an efficient cassava industrial sector. The<br />
specific objectives and activities directing this<br />
study are provided in Appendix A.<br />
The intended audience for the report was to<br />
include large, medium and small-scale private<br />
sector investors, farmers and processors. It was<br />
also intended to guide donor and development<br />
bank investments and government policy.<br />
The study team comprised two agricultural<br />
economists, a local post harvest specialist and an<br />
agronomist. Work began in November 2003 with<br />
an extensive search for available data on the<br />
Nigerian cassava industry. This involved visits by<br />
team members to all state agricultural<br />
development programmes (ADPs), federal offices,<br />
and key industrial informants. Duplication was<br />
minimized by not visiting those informants and<br />
industries already visited by previous consultants.<br />
Instead information from their reports was used in<br />
this report.<br />
The task for this single report is enormous. It is<br />
obvious that in its current form, the information<br />
contained in this report may be too detailed to<br />
interest large, medium and small-scale investors,<br />
donors, governments and development banks.<br />
Condensed reports or pamphlets for industrial<br />
application should be gleamed from this report to<br />
suit specific end user interests. The data<br />
intensive nature of this study lead to a companion<br />
document being assembled, entitled “The<br />
Nigerian Cassava Industry: Statistical Handbook”.<br />
1.2 THE <strong>CASSAVA</strong> STATISTICAL HANDBOOK<br />
This study draws heavily from previously<br />
presented material on simulating the cassava<br />
industry in Nigeria. It was also the intention of this<br />
study to draw heavily on data collected and<br />
collated by the industry and State and Federal
Governments. In travelling across the country it<br />
was soon realized that much of the data desired<br />
for this study of cassava had not been collected<br />
nor collated and was not readily available in a<br />
form that could be quickly or easily analysed. It<br />
was for this reason that The Nigerian Cassava<br />
Industry: Statistical Handbook 2004 was born.<br />
THE <strong>NIGERIA</strong>N<br />
<strong>CASSAVA</strong> <strong>IN</strong>DUSTRY:<br />
STATISTICAL<br />
HANDBOOK 2004<br />
THE 1ST ANNUAL<br />
<strong>IN</strong>CLUDES 2002 AND 2003 DATA<br />
WHERE AVAILABLE<br />
This handbook, a first of its kind for cassava,<br />
contains over 100 pages of data in tabular form<br />
relevant to the Nigerian cassava industry. The<br />
sections provide data on production, processing,<br />
utilization, prices, enterprise budgets,<br />
transportation, domestic economic indicators and<br />
international cassava data. The data is intended<br />
to provide a baseline for monitoring changes in<br />
the industry and a guide for investments and<br />
research. Although some tables are incomplete,<br />
sections and table headings are provided, as a<br />
guide for future industrial data collection.<br />
The Handbook is intended to provide the Nigerian<br />
Cassava Industry and those interested in learning<br />
about the industry with a basic understanding of<br />
its scope, <strong>org</strong>anization and magnitude. It is hoped<br />
that this Handbook will be updated on an annual<br />
basis and widely distributed in both hard and soft<br />
formats. Hard copies are to be made available to<br />
all levels of government, institutions, industries,<br />
associations and interested individuals. Soft<br />
copies are to be made available on request to<br />
those with available technology.<br />
Although many have suggested that such a<br />
Handbook can be easily and cheaply maintained<br />
in CD or web site form many people in Nigeria do<br />
not have access to such technology and even<br />
those that do, do not have a steady supply of<br />
electricity for it to be available when and as<br />
needed. Paper copies are still very important in<br />
2<br />
Nigeria. Especially so, when one considers the<br />
fact that less than one percent of the population<br />
accesses the Internet or has personal computers<br />
(World Bank, 2004).<br />
The Handbook should be used as a companion<br />
when reading this report. Data summarized in this<br />
report can be examined in detailed tabular form in<br />
the Handbook. It is hoped that as the use and<br />
availability of the handbook become widespread,<br />
industrial stakeholders, policy makers and<br />
national researchers will be able to undertake<br />
their own or similar analysis and interpretation of<br />
the data when and as needed. This report<br />
together with the Statistical Handbook forms a<br />
pool of information from which private sector<br />
investor information can be drawn.<br />
Another innovation brought about by this study<br />
was the development of regional production<br />
models that can be used to simulate the outcome<br />
of alternative production scenarios.<br />
1.3 REGIONAL PRODUCTION MODELS<br />
Regional production models have traditionally<br />
been used to assess the potential responses of<br />
farmers to changes in policy, technology and<br />
market conditions. Depending on the objectives of<br />
the analyses and the availability of data, the<br />
scope of such models has ranged from that of<br />
individual farms to aggregate models representing<br />
the entire agricultural industry.<br />
For this study linear programming was selected as<br />
an appropriate technique to develop regional<br />
production models. Linear programming is a<br />
technique that maximizes or minimizes an<br />
objective function subject to a set of constraints.<br />
In the case of regional modelling the objective<br />
function normally consists of maximizing profit or<br />
output from farming activities, or minimizing costs<br />
of production or use of inputs. The constraints<br />
generally refer to the availability of land and<br />
labour and the need to meet some minimum<br />
marketing, or consumption standard.<br />
These models are typically based on enterprise<br />
budgets. Ideally the budgets provide an indication<br />
of quantity and cost of production inputs, as well<br />
as the timing of these activities. These budgets<br />
also provide information on the output and value<br />
of production activities. The budgets may also
provide information on the linkages between<br />
different production activities, such as the amount<br />
of produce that is processed into another<br />
commodity (e.g. cassava roots to gari).<br />
Initial data collection activities led to the belief that<br />
each Agricultural Development Programme (ADP)<br />
had enterprise budgets for the primary cropping<br />
patterns in its state. It was thus planned to<br />
develop farm models for each state.<br />
Unfortunately, the visit to 16 ADPs proved<br />
otherwise. Only three of the 16 visited ADPs were<br />
able to provide enterprise budgets that were<br />
representative of the commonly practiced<br />
intercropped activities of the state. Two additional<br />
states provided an enterprise budget on monocrop<br />
activities, but it was felt that these could not<br />
be used to develop representative farm models. It<br />
was suggested by various ADPs that the desired<br />
enterprise budgets be available at the Project<br />
Coordinating Unit (PCU) in Abuja. Unfortunately it<br />
was not possible in the two-day visit to the PCU in<br />
Abuja to collect the desired data.<br />
Copies of the 2000/2001 Advisors Handbook<br />
(Projects Coordinating Unit, 2002) which<br />
contained a compilation of over 40 crop enterprise<br />
budgets collected from 6 states. From the point of<br />
view of farm modelling the data lacked information<br />
on the quantity of inputs (labour and purchased<br />
inputs) and location of the states used to develop<br />
the budgets. Appendix B details how the data was<br />
adjusted to account for this missing detail. With<br />
this adjustment, these data represented the best<br />
and most comprehensive source of cost of<br />
production data we were able to find and formed<br />
the starting point for developing regional farm<br />
models.<br />
The constraints to the model were regional land<br />
availability and producer food consumption<br />
requirements. The regional models are annual<br />
models that maximize gross margins (revenue<br />
minus input and labour expenditures) subject to<br />
minimal farmer consumption and limited by<br />
available land.<br />
The regional models were used to compare four<br />
scenarios against a base scenario. The base<br />
scenario is designed to represent current regional<br />
conditions of land use, food consumption and<br />
agricultural production. Land constraints are used<br />
3<br />
to insure that the base results are similar to<br />
calculated regional averages.<br />
A feature of the model is that it was assumed that<br />
the traditional harvesting of cassava continues<br />
into the second year. The implication for the<br />
annual model is that enterprises containing<br />
cassava require 2 ha of land rather than 1 ha of<br />
land, as do all other enterprises. The four<br />
scenarios are based around two changes. One<br />
change results in cassava being harvested in one<br />
year as opposed to two years. The second is the<br />
adoption of high yielding varieties.<br />
Scenario A assumes yields increase to 15<br />
tonne/ha but harvesting continues into second<br />
year. Scenario B assumes that cassava is<br />
harvested within a single year but yields don’t<br />
improve. Scenario C assumes yield increases to<br />
15 tonne/ha and cassava is harvested in one<br />
year. Scenario D assumes yield increases to 20<br />
tonne/ha and cassava is harvested in one year.<br />
Labelled<br />
Use High<br />
Yielding<br />
Varieties<br />
Harvest<br />
within a<br />
single<br />
year<br />
Base Scenario Base No No<br />
Scenario A Yld 2ha 15 tonne/ha No<br />
Scenario B 1ha No Yes<br />
Scenario C Yld 15 15 tonne/ha Yes<br />
Scenario D Yld 20 20 tonne/ha Yes<br />
The results obtained from these scenarios on<br />
production, area and quantities marketed are<br />
illustrated and discussed throughout the report.<br />
1.4 THE REVOLUTION<br />
The cassava revolution in Nigeria is at its infancy.<br />
This report hopes to describe it in the context of<br />
its current status; new initiatives; future targets;<br />
and future directions. The report <strong>org</strong>anizes the<br />
discussion within six sections: Introduction,<br />
Production, Utilization and Processing, Prices and<br />
Margins, Development Clusters, and The Ultimate<br />
Way Forward. Each section, except for the last,<br />
contains the four subsections: Current Status,<br />
Future Targets, New Initiatives, and The Way<br />
Forward.
2 <strong>CASSAVA</strong> PRODUCTION<br />
2.1 CURRENT STATUS<br />
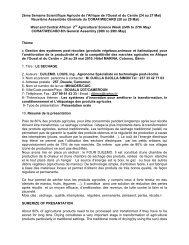
Nigerian cassava production is by far the largest<br />
in the world; a third more than production in Brazil<br />
and almost double the production of Indonesia<br />
and Thailand. Cassava production in other<br />
African countries, the Democratic Republic of the<br />
Congo, Ghana, Madagascar, Mozambique,<br />
Tanzania and Uganda appears small in<br />
comparison to Nigeria’s substantial output.<br />
'000 MT<br />
40,000<br />
35,000<br />
30,000<br />
25,000<br />
20,000<br />
15,000<br />
10,000<br />
5,000<br />
0<br />
Nigeria<br />
Brazil<br />
Thailand<br />
Indonesia<br />
Congo, D.R.<br />
Ghana<br />
Tanzania<br />
Mozambique<br />
Figure 2-1 Leading World Producers of Cassava<br />
Uganda<br />
Madagascar<br />
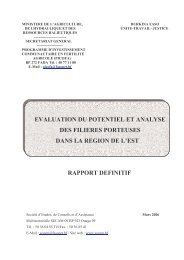
Three sets of estimates exist for Nigerian cassava<br />
Production from 1996 to 2002.<br />
Figure 2-2 Cassava Production 1980-2002<br />
The Food and Agriculture Organization of the<br />
United Nations (<strong>FAO</strong>) in Rome (<strong>FAO</strong>, 2004a)<br />
estimated 2002 cassava production in Nigeria to<br />
be approximately 34 million tonnes. The trend for<br />
4<br />
cassava production reported by the Central Bank<br />
of Nigeria mirrored the <strong>FAO</strong> data until 1996 and<br />
thereafter rises to the highest estimate of<br />
production at 37 million tonnes in 2000 (FMANR,<br />
1997; Central Bank of Nigeria ). The third series<br />
provided by the PCU (PCU, 2003) had the most<br />
conservative estimate of production at 28 million<br />
tonnes in 2002. PCU data collates state level data<br />
provided by the ADP offices in each state.<br />
Comparing the output of various crops in Nigeria,<br />
cassava production ranks first, followed by yam<br />
production at 27 million tonnes in 2002, s<strong>org</strong>hum<br />
at 7 million tonnes, millet at 6 million tonnes and<br />
rice at 5 million tonnes (<strong>FAO</strong>, 2004a).<br />
Expansion of cassava production has been<br />
relatively steady since 1980 with an additional<br />
push between the years 1988 to 1992 owing to<br />
the release of improved IITA varieties.<br />
By zone, the North Central zone produced over 7<br />
million tonnes of cassava a year (1999 to 2002).<br />
South South produces over 6 million tonnes a<br />
year while the South West and South East<br />
produce just less than 6 million tonnes a year. The<br />
North West and North East are small by<br />
comparison at 2 and 0.14 million tonnes<br />
respectively (Table 2-1).<br />
Table 2-1 Cassava Production by Zone 2000-2002<br />
(tonnes)<br />
Region 2000 2001 2002<br />
South West 4 993 380 5 663 614 5 883 805<br />
South South 6 268 114 6 533 944 6 321 674<br />
South East 5 384 130 5 542 412 5 846 310<br />
North West 2 435 211 2 395 543 2 340 000<br />
North Central 7 116 920 7 243 970 7 405 640<br />
North East 165 344 141 533 140 620<br />
Total<br />
(PCU, 2003)<br />
26 363 099 27 521 016 27 938 049<br />
On a per capita basis, North Central is the highest<br />
producing state at .72 tonnes/per person in 2002,<br />
followed by South East (.56), South South (.47),<br />
South West (.34), North West (.10) and North<br />
East (.01). National per capita production of<br />
cassava is .32 tonne/per person.<br />
Benue and Kogi state in the North Central Zone<br />
are the largest producers of cassava (IITA, 2004).
Map 2-1 Crop Production by State 2002<br />
Cross River, Akwa Ibom, Rivers and Delta<br />
dominate state cassava production in the South<br />
South. Ogun, Ondo and Oyo dominate in the<br />
South West and Enugu and Imo dominate<br />
production in the South East. Kaduna alone in the<br />
North West is comparable in output to many of the<br />
states in the southern regions at almost 2 million<br />
tonnes a year with very little currently produced, in<br />
the North East. The Handbook lists each state’s<br />
production and area.<br />
2.2 FUTURE TARGETS<br />
These are exciting times for cassava enthusiasts<br />
in Nigeria and indeed across Africa. African<br />
Heads of State and Government agreed at the<br />
African Union Summit held in July 2003, to make<br />
agriculture a top priority and to raise budget<br />
allocations for agriculture to a minimum of 10<br />
percent of total public spending within five years.<br />
At two recent conferences held in South Africa<br />
<strong>org</strong>anized by NEPAD 2 jointly by IDEAA 3 and<br />
IFPRI in August and November of 2003 it was<br />
strongly recommended that cassava be promoted<br />
as a poverty fighter across Africa facilitated by a<br />
continental or Pan-Africa Cassava Initiative. This<br />
initiative would be based on a transformation<br />
strategy that emphasizes markets, collective<br />
action, the private sector, research and extension.<br />
2 New Partnership for Africa’s Development<br />
3 Initiative for Development and Equity on African Agriculture<br />
5<br />
Much is being invested and much is being<br />
expected. Given the hopes and aspirations of<br />
many Nigerians, ignited by the Nigerian<br />
President’s Initiative for cassava and now<br />
KNEEPAD many futuristic scenarios for cassava<br />
production are being debated. Three are<br />
illustrated in the following figure.<br />
The first production target stems from the<br />
President’s Initiative itself. In order to actualize the<br />
President’s Initiative of US$5 billion a year by<br />
2007, it was determined that 150 million tonnes of<br />
cassava would be needed by the end of 2006<br />
(Subcommittee, 2002).<br />
Figure 2-3 Production Scenarios for Cassava to 2020<br />
Production being a function of area and yield, this<br />
target requires an expansion of 2 million ha of<br />
land (from 3 to 5 million ha) and an average yield<br />
of 30 tonnes per ha.<br />
Research institutes, such as IFPRI and <strong>FAO</strong><br />
suggest a more conservative production target for<br />
cassava. Extrapolating from estimates for cassava<br />
production in Africa (Scott, Rosegrant, and<br />
Ringler, 2000) and (<strong>FAO</strong>, 2004b), Nigeria’s<br />
production is targeted at 40 million tonnes by<br />
2005 and 60 million tonnes by 2020 (IITA, 2002).<br />
This target relates well to the mapping of a simple<br />
linear time trend on historical production levels in<br />
Figure 2-3.<br />
An alternative ‘middle of the road’ production<br />
target generated by mapping an exponential time<br />
trend to historical production levels suggests an<br />
intermediate production target for 2007 of 60<br />
million tonnes (a doubling from early 1990
production levels) to be followed by 150 million<br />
tonnes in the year 2020.<br />
Adopting the ‘middle road’ scenario of 60 million<br />
tonnes by 2007 the implications on area are<br />
illustrated in Figure 2-4. Applying a simple linear<br />
time trend to national cassava area illustrates an<br />
increase of 1 million ha or 4 million ha by the year<br />
2007.<br />
Figure 2-4 Cassava Area 1980 to Targeted 2007<br />
Given these two targets in production and area, a<br />
significant increase in national yields is required.<br />
Sixty million tonnes on 4 million ha would require<br />
an average yield of 15 tonnes per ha. Current<br />
yields have been stagnant at just over 10 tonnes<br />
per ha since the early 1990s. To advance the<br />
suggested exponential production growth target of<br />
60 million tonnes, an enormous intervention effort<br />
is required to propel cassava yields from their<br />
current trend (Figure 2-5).<br />
MT/Ha<br />
y = 0.0069x2 - 0.1833x + 11.932<br />
R2 16<br />
y = 0.0069x<br />
15<br />
= 0.203<br />
14<br />
13<br />
12<br />
11<br />
10<br />
9<br />
8<br />
7<br />
6<br />
2 - 0.1833x + 11.932<br />
R2 16<br />
15<br />
= 0.203<br />
14<br />
13<br />
12<br />
11<br />
10<br />
9<br />
8<br />
7<br />
6<br />
1986<br />
1987<br />
1988<br />
1989<br />
1990<br />
1991<br />
1992<br />
1993<br />
1994<br />
1995<br />
1996<br />
1997<br />
1998<br />
1999<br />
2000<br />
2001<br />
2002<br />
T 2003<br />
T 2004<br />
T 2005<br />
T 2006<br />
T 2007<br />
1986<br />
1987<br />
1988<br />
1989<br />
1990<br />
1991<br />
1992<br />
1993<br />
1994<br />
1995<br />
1996<br />
1997<br />
1998<br />
1999<br />
2000<br />
2001<br />
2002<br />
T 2003<br />
T 2004<br />
T 2005<br />
T 2006<br />
T 2007<br />
Pull Factors<br />
Consumer Demand<br />
Industrial Demand<br />
Favorable Markets<br />
Positive Attitudes<br />
Push Factors<br />
Government Support<br />
New Varieties<br />
Better Farm Practices<br />
Farmer Motivation<br />
Figure 2-5 Cassava Yields 1980 to Targeted 2007<br />
Increasing yields to 15 tonnes per ha is a<br />
significant challenge for the subsector. Push<br />
factors such as government support, new<br />
varieties, better farming practices and farmer<br />
6<br />
motivation are typically cited as a means to<br />
increasing yields. Pull factors such as consumer<br />
demand, industrial demand, favourable markets,<br />
and positive attitudes are not commonly<br />
mentioned. It is maintained that both the ‘push’<br />
and the ‘pull’ are needed if the industry is to move<br />
forward.<br />
Comparing this yield target to international levels,<br />
it is observed that Nigeria is not that far from<br />
yields obtained in other countries.<br />
Yields in Brazil and Indonesia are not much above<br />
that of Nigeria and are relatively flat. Yields in<br />
Thailand have only recently taken off since 1995.<br />
To supply low priced cassava starch, Thai<br />
producers are increasing their efficiencies in<br />
production. The target of 15 tonnes per ha places<br />
Nigeria on the same linear growth path as<br />
Thailand.<br />
Figure 2-6 Comparison with International Yields<br />
2.3 NEW <strong>IN</strong>ITIATIVES<br />
A number of new initiates are currently being<br />
implemented to increase yields and area to<br />
achieve increased cassava production in Nigeria.<br />
One innovative initiative to achieve greater<br />
cassava production is being undertaken by the<br />
Cassava Growers Association. It is acquiring large<br />
parcels of land in each Local Government<br />
Authority (LGA). Each parcel is intended to<br />
provide 1 000 ha of continuous land, suitable for<br />
commercial cassava cultivation. In addition to<br />
current production levels, farmers’ groups (or<br />
clusters) would be <strong>org</strong>anized in such a way that,<br />
using mechanized equipment, high yielding<br />
varieties and improving farming practices, yields<br />
of 30 tonnes per ha could be achieved in this new
area 4 . There are 547 LGAs said to be participating<br />
in this programme. If each LGA plants 1 000 ha of<br />
high yielding cassava this would increase<br />
production by 16.5 million tonnes achieving more<br />
than half of the targeted increase of 26 million<br />
tonnes by 2007.<br />
Members of the Cassava Growers Association are<br />
currently practicing cluster farming. Presently<br />
there are about 500 groups carrying out cluster<br />
farming with each group having about 30 ha under<br />
cultivation. Members are divided into groups with<br />
land side by side. As a group they can hire a<br />
tractor to plough, spray with herbicide to reduce<br />
weeding and gain in efficiency. Unfortunately, the<br />
success of these clusters was jeopardized<br />
because inappropriate tractors were made<br />
available 5 .<br />
Another initiative is the encouragement of plant<br />
population to the recommended 10 000 stands<br />
per ha. If plants per ha are currently 7 to 8<br />
thousand stands per ha an increase to 10 000<br />
stands per ha would increase yields to<br />
approximately 13 tonnes per ha or 9 million<br />
tonnes.<br />
The regional production models also indicate the<br />
benefits of improving production practices, as<br />
illustrated in Figure 2-7. The first observation is<br />
the close relationship of the base production to<br />
actual production levels. One has to realize that<br />
these results are based on a rudimentary styled<br />
model of a complex real world.<br />
4 Commercial or large scale cassava production implies<br />
continuous land of 400 ha and more. It implies the use of a<br />
planter and the use of a harvester. Brazil and Thailand are<br />
currently being examined as possible examples for future<br />
Nigerian production methods. The harvesters that are being<br />
examined require straight parallel rows. Prior to harvesting the<br />
cassava stems are cut leaving a stub for gripping and<br />
extracting the roots (Angar, 2004).<br />
5 Farmers cannot afford a tractor costing N4.5 million and the<br />
Federal Government of Nigeria tractors have no implements.<br />
Furthermore, the Federal Government of Nigeria gave one<br />
tractor to local governments but farmers had been promised<br />
tractors from the Federal Government of Nigeria on a hire to<br />
purchase basis<br />
7<br />
million tonnes<br />
160<br />
140<br />
120<br />
100<br />
80<br />
60<br />
40<br />
20<br />
0<br />
Base Yld 2ha 1ha Yld 15 Yld 20<br />
NC NE NW SE SS SW<br />
Figure 2-7 Cassava Production for Alternative Scenarios<br />
Nevertheless, the results of the model are<br />
intuitively correct. The adoption of improved<br />
agronomic practices (1 ha) has a more<br />
pronounced effect on cassava production, than<br />
improving yields to 15 tonnes/ha without the<br />
associated changes in production practices (Yld 2<br />
ha).<br />
Many claim that improving cassava production<br />
practices can result in increased cassava<br />
production. In terms of the regional production<br />
model the effect of completing cassava production<br />
in one year essentially doubles the yield of<br />
cassava which doubles current production. The<br />
target of 60 million metric tonnes by 2007 would<br />
appear quite feasible under this scenario.<br />
Increasing yields to 15 tonnes/ha and harvesting<br />
cassava within one year (Yld 15) has an even<br />
greater impact than agronomic improvement<br />
alone because it combines the positive impact of<br />
improved agronomic changes with the use of<br />
improved cassava varieties. The increase of yield<br />
to 20 tonnes/ha (Yld 20) boosts the expected<br />
output of cassava even further. In fact, the<br />
outcome is consistent with the target of 150<br />
million tonnes by 2020.<br />
The expansion of land devoted to cassava<br />
requires some explanation. As noted in the<br />
description of the models, total land available is a<br />
major constraint. Increases in cassava land are<br />
made possible by a decrease in the land devoted<br />
to some of the competing crops. This reduction of<br />
land does not lessen the amount of food produced<br />
for home consumption. What is reduced is the<br />
amount of competing crop that is marketed.
million hectares<br />
7.00<br />
6.00<br />
5.00<br />
4.00<br />
3.00<br />
2.00<br />
1.00<br />
0.00<br />
Base Yld 2ha 1ha Yld 15 Yld 20<br />
NC NE NW SE SS SW<br />
Figure 2-8 Cassava Area for Alternative Scenarios<br />
The estimate of labour required for the different<br />
scenarios underestimates the potential positive<br />
impact of perusing any of the scenarios. Firstly the<br />
model only provides estimates of the cost of major<br />
labour operations.<br />
million person years<br />
3.00<br />
2.50<br />
2.00<br />
1.50<br />
1.00<br />
0.50<br />
0.00<br />
Base Yield & 2ha 1ha Only Yield 15 Yield 20<br />
NC NE NW SE SS SW<br />
Figure 2-9 Total Labour for Alternative Scenarios<br />
Labour requirements were calculated by dividing<br />
labour costs by an estimate of labour wage rates.<br />
Secondly the model does not provide any<br />
estimates of the amount of labour opportunities<br />
that would be generated by post-harvest activities.<br />
The amount of land devoted to cassava and the<br />
amount of agricultural labour differs between<br />
scenarios although the changes were not as<br />
dramatic as the production changes.<br />
2.4 THE WAY FORWARD<br />
In the same way that the Cassava Growers<br />
Association has been provided with 1 000 ha of<br />
8<br />
continuous land per LGA, there is a need for<br />
authorities to assist corporate bodies and<br />
cooperatives in acquiring similar large parcels of<br />
agricultural land for agro-industrial development.<br />
Industrial users of cassava may initially wish to<br />
produce and process cassava themselves through<br />
own sourcing or outsourcing. Either way,<br />
continuous parcels of land will have to be<br />
<strong>org</strong>anized to provide efficient and continuous<br />
supplies of raw material. The setting up of such<br />
land parcels for industrial use will require the<br />
blessing, if nothing else, from local authorities.<br />
In discussing ‘the way forward’ it is wise to be<br />
mindful of the past. In the early years of Structural<br />
Adjustment, Nigerian agricultural trade policy set<br />
out to achieve many of the objectives being<br />
discussed here; promotion of agricultural exports<br />
and reduction of agricultural raw material imports.<br />
During that time four strategies were utilized:<br />
trade liberalization, export promotion, backward<br />
integration and privatization. In the early years<br />
these initiatives gave rise to significant<br />
improvements in non-oil exports, with cocoa<br />
leading the way. Unfortunately this growth was not<br />
sustained. The reasons cited: poor quality of<br />
exported product failing to attract good<br />
international prices, inefficient large scale farms<br />
established by the private sector resulting in large<br />
capital losses and problems in sourcing supply<br />
because out growers failed to honour contractual<br />
agreements with industries (Shaib, Aliyu, and<br />
Bakshi, 1997).<br />
In protect from these past mistakes an alternative<br />
mindset must be obtained by those producers<br />
involved in the industry. More will be discussed on<br />
this in the final section of this report the Ultimate<br />
Way Forward.<br />
It is sufficient to mention here that various<br />
requirements are needed to initiate changes in<br />
agronomic practices, yields and land utilization.<br />
Commissioning a national farm and agro-industry<br />
survey would greatly assist future modelling<br />
exercises. Accurate and reliable data would also<br />
assist in setting up benchmarks for developing the<br />
cassava subsector.
3 PROCESS<strong>IN</strong>G AND UTILIZATION<br />
3.1 CURRENT STATUS<br />
Cassava is a very versatile commodity with<br />
numerous uses and by products. Each component<br />
of the plant can be valuable to its cultivator. The<br />
leaves may be consumed as a vegetable, or<br />
cooked as a soup ingredient or dried and fed to<br />
livestock as a protein feed supplement. The stem<br />
is used for plant propagation and grafting. The<br />
roots are typically processed for human and<br />
industrial consumption. The Handbook lists the<br />
numerous uses of cassava in human consumption<br />
and industrial use.<br />
In Nigeria, the consumption pattern varies<br />
according to ecological zones (Table 3-1). Gari, a<br />
roasted granule is the dominant product and is<br />
widely accepted in both rural and urban areas. It<br />
can be consumed without any additives or it can<br />
be consumed with a variety of additives such as<br />
sugar, groundnut, fish, meat and stew.<br />
Table 3-1 Consumption Pattern by Zone and Cassava<br />
Product<br />
Zone 6 Order of importance<br />
South West Gari, Lafun, Fufu/Akpu<br />
South South Gari, Akpu<br />
South East Gari, Fufu/Akpu<br />
North Central Gari, Fufu/Akpu, Starch<br />
North East Fufu/Akpu, Gari, Abacha<br />
Fufu and Akpu, a fermented wet paste from<br />
cassava is also widely consumed throughout the<br />
country especially in the southern zones. Most<br />
processors however complain that the wet paste<br />
and ready to eat forms of fufu, that are currently<br />
sold, have a very short shelf life.<br />
Estimates of industrial cassava use suggest that<br />
approximately 16 percent of cassava root<br />
production was utilized as an industrial raw<br />
material in 2001 in Nigeria. Ten percent was used<br />
as chips in animal feed, 5 percent was processed<br />
into a syrup concentrate for soft drinks and less<br />
than one percent was processed into high quality<br />
6 Data were unavailable for the North West<br />
9<br />
cassava flour used in biscuits and confectionary,<br />
dextrin pre-gelled starch for adhesives, starch and<br />
hydrolysates for pharmaceuticals, and seasonings<br />
(Kormawa and Akoroda, 2003).<br />
This estimate leaves 84 percent or 28.9 million<br />
tonnes of production for food consumption, a<br />
portion of this of course being lost in post harvest<br />
and waste.<br />
Comparable time series data describing cassava<br />
processing and utilization at the national, regional<br />
and state level is virtually non-existent.<br />
Fortunately it was possible to obtain a preliminary<br />
analysis of the first national consumption survey<br />
of Nigeria since the early 1980s 7 (Ministry of<br />
Health and Nutrition of Nigeria, 2004).<br />
Table 3-2 illustrates daily cassava consumption<br />
per capita by geographic region. Surprisingly,<br />
urban and rural consumption are not dissimilar,<br />
confirming the fact that cassava is truly a national<br />
food with an urban market presence. Cassava<br />
appears to be a ‘food of choice’ even in the face<br />
of alternative food options in urban areas.<br />
Table 3-2 Daily Consumption of Cassava per capita<br />
Grams per Person per<br />
Day<br />
National 226.93<br />
Dry Savannah Zone 131.16<br />
Moist Savannah 192.37<br />
Humid Forest Zone 284.42<br />
Rural 239.74<br />
Medium 220.53<br />
Urban 213.76<br />
(Ministry of Health and Nutrition of Nigeria,<br />
2004)<br />
Assuming per capita urban consumption is 213.76<br />
gm of cassava per day, the rural micro, small and<br />
medium food processors is supplying 4 million<br />
metric tonnes of processed cassava product a<br />
year. This is equivalent to 6.6 million tonnes in<br />
cassava root. This estimate of cassava utilization<br />
is low given earlier estimates that work backwards<br />
7 The Cassava Handbook contains information on daily<br />
consumption by grams and frequency of cassava consumed<br />
per week by the states surveyed.
from production. Clearly, this suggests that a<br />
more in-depth study is required on the production<br />
of cassava product vis-à-vis its consumption by<br />
the populace.<br />
The informed impression in most ‘cassava circles’<br />
suggests that the demand for traditional foods in a<br />
convenience form is increasing in Nigeria.<br />
Cassava consumption is finding a new place in<br />
the diets of both rural dwellers and up and coming<br />
urban elites. Cassava is no longer only grown by<br />
the poor. It is a Nigerian food staple with industrial<br />
potential.<br />
In terms of frequency of cassava consumption in a<br />
surveyed state, it is encouraging to processors<br />
and producers of cassava alike to find high levels<br />
of consumption as reported in Table 3-3. There<br />
can be little doubt that cassava is a staple food,<br />
when over 30 percent of the respondents in seven<br />
of the 12 surveyed states respond that they<br />
consume cassava more than four times a week.<br />
Table 3-3 Frequency of Cassava Consumption<br />
Percent of respondents that consumed<br />
cassava in a week<br />
State 1-2 times 3-4 times > 4 times<br />
Osun 29% 36% 33%<br />
Akwa Ibom 29% 36% 33%<br />
Bayelsa 21% 15% 51%<br />
Edo 21% 25% 53%<br />
Imo 24% 21% 43%<br />
Kaduna 77% 18% 4%<br />
Kano 57% 37% 4%<br />
Kebbi 84% 15% 0%<br />
Kwara 27% 38% 35%<br />
Nassarawa 57% 28% 13%<br />
Borno 65% 28% 4%<br />
Taraba 37% 25% 33%<br />
Cassava processing operations in Nigeria can be<br />
described at 5 levels of capacity. The common<br />
terms used to describe these capacity levels are<br />
household (or cottage), micro, small, medium and<br />
large.<br />
Household level processing typically does not<br />
employ any outside labour. The household<br />
consumes virtually all of the processed products<br />
and sells a small amount to raise income for<br />
10<br />
additional household needs. At present, most<br />
Nigerian processors fall within this category.<br />
At the micro processing capacity the employment<br />
of one or two units of labour may take place while<br />
processing a variety of cassava products. This<br />
enterprise typically uses batch processing. Batch<br />
processing may take four hours per day and this<br />
would be sufficient for the owner/operator.<br />
Nigeria has a few cassava processors in this<br />
category of operation.<br />
The small and medium processing operations<br />
typically employ three to ten workers and are very<br />
sparse at present. Large scale cassava<br />
processing is virtually non-existent in Nigeria.<br />
Large-scale operations are defined as enterprises<br />
employing 10-30 or more labourers. Large-scale<br />
operations would also have the capacity for large<br />
tonnage processing with wider marketing<br />
opportunities. Table 3-4 illustrates commonly<br />
quoted capacities for various products and scales<br />
of operation.<br />
Table 3-4 Daily Processing Capacity by Scale of<br />
Operation and Product<br />
Processing<br />
Cottage to<br />
Small Scale<br />
Chips 1 tonne/day<br />
Small to<br />
Medium Scale<br />
Medium to<br />
Large Scale<br />
Ethanol 50 litres/day 1 000 litres/day 2 000 litres/day<br />
Malt Drink 100 litres/day 500 litres/day<br />
Feeds 1 tonne/day 2 tonne/day<br />
Flour 1 tonne/day<br />
Gari 1 tonne/day<br />
Hard Pellet 120 tonne/day<br />
Starch 1 tonne/day<br />
It is safe to say that medium to large scale<br />
cassava processing equipment and fabricators of<br />
this equipment are few and far between in Nigeria.<br />
Gari is the only product that is currently able to<br />
push the industry from a traditional to a semimechanized<br />
process. In a RTEP survey (RTEP,<br />
2001), participants in 25 states were asked about<br />
their use and availability of processing techniques<br />
such as graters, pressers and fryers. The<br />
resulted indicated a level of awareness and use of<br />
these primitive semi-mechanized equipment in<br />
every state surveyed (IITA, 2004).
The need for innovative cassava processing<br />
technologies is enormous. Traditional cassava<br />
processing has a number of undesirable<br />
attributes. It is time consuming, provides low<br />
yields and lacks storage capacities. Many<br />
unattractively describe it as drudgery.<br />
In a typical village, fufu processors cultivate<br />
cassava in family lots to process fufu for weekly<br />
market days 8 . Time is spent peeling roots,<br />
washing, soaking, wet sieving and copiously<br />
adding water before pressing. Fufu processing<br />
requires no less than 14 steps. On sale day, time<br />
would be spent grating and bagging.<br />
Women typically carry out 70 percent of the work;<br />
planting, weeding, harvesting, transporting<br />
cassava, peeling, soaking, bagging and selling.<br />
The men carry out approximately 30 percent of<br />
the work; land preparation, harvesting,<br />
transporting and grating. The only mechanization<br />
might be the use of a mobile grater.<br />
At the end of the week a basin of fufu would sell<br />
for between N300 and N350 depending on market<br />
conditions. One bag or six basins of fufu might<br />
sell for N2 100. Processors using hired labour<br />
indicated that 15-20 basins could be produced<br />
each week for market compared to ten basins<br />
without labour 9 .<br />
While seeking processing capacities and costs,<br />
the survey team found village level processors in<br />
Nigeria unable to describe their input to output<br />
capacities for their activities in quantifiable<br />
measures. Most respondents quoted the use of a<br />
basin, tin cup, plastic bucket, bags, mobile truck,<br />
head pans, etc. Attempts to standardize the<br />
weight of each proved abortive.<br />
The lack of standardized weights and measures<br />
make assessing the efficiency of the marketing<br />
systems extremely difficult. Assessing the extent<br />
to which differences in product quality affect the<br />
prices received by processors was extremely<br />
8 Alternatively, local truckload of cassava root might be<br />
purchased. A truckload of cassava costs N4 000 providing<br />
three bags (or 18 basins) of finished fufu.<br />
9 Labour costs are typically N200 per person-day plus N200 to<br />
feed, for a six-hour day (from 0600-0700 hours to 1200-1300<br />
hours).<br />
11<br />
difficult if not impossible. The lack of standard<br />
weights and measures for cassava products in the<br />
marketplace means one must rely on laboratory<br />
and industrial standards and conversions that do<br />
not accurately reflect the real world and the vast<br />
number of cassava processors in Nigeria.<br />
Assessing labour costs was another major<br />
setback in this study. When asked about the cost<br />
of a person-day for each processing unit, the<br />
responses were not assertive. Attempts to<br />
calculate processor and trader margins were<br />
ineffectual during the interviews. The tremendous<br />
role that women play in cassava production,<br />
processing and marketing was confirmed during<br />
field visits and must be taken into consideration in<br />
the design of any labour saving technologies and<br />
trainings.<br />
Turning now to large scale assembly in quick<br />
succession, it has already been mentioned that<br />
very few plants are in operation today. This was<br />
not the case even two years ago. In the late<br />
1990s medium to large processing facilities were<br />
operating, many as starch manufacturers.<br />
However, many of these industries closed down<br />
because they were working at low and seasonal<br />
capacities.<br />
Peak Products Nigeria Limited is an example of a<br />
company that was able to adjust under adverse<br />
circumstances and thus remain in operation. Its<br />
story is worth describing here in some detail.<br />
Peak Products Nigeria Limited began cassava<br />
processing in 1998 with the sun drying of cassava<br />
flour. The flour was sold to bakeries and<br />
confectionaries through Ogun State Agricultural<br />
Development Programme (Agro Processing Unit).<br />
However, some processors began contaminated<br />
fermented cassava flour with unfermented<br />
cassava and by 1999-2000 the flour bakeries and<br />
confectionaries stopped asking for and using<br />
cassava flour. This forced Peak to shift to the<br />
production of sun dried cassava starch.
With growing demand for cassava starch 10 , Peak<br />
upgraded from sun drying to the use of a<br />
mechanical dryer. Using a flash dryer, production<br />
capacity achieved 3-5 tonnes per day, 72 000<br />
tonnes per year with a daily input of 25-30 tonnes<br />
of wet starch.<br />
Flash drying however requires a wet milling<br />
component. Faced with environmental problems,<br />
the company was forced to stop wet milling and<br />
instead obtained wet cake from rural women. At<br />
present Peak is currently under utilized in its<br />
production of cassava starch because it has<br />
diversified production into the fabrication of flash<br />
dryers.<br />
Existing buyers of Peak’s flash dryers are<br />
predominantly chemical companies from the<br />
Sango-Lagos Axis and a few beverages and food<br />
industries. Prospective buyers include Nigerian<br />
Distilleries in Ota who want 150 tonnes of cassava<br />
flour per day for ethanol production. DeUnited Nig<br />
Ltd., is looking to produce 60 000 tonne of<br />
cassava flour per month for noodles (Ndomie<br />
Noodles). Oil companies are interested in<br />
producing cassava starch for drilling muds 11 .<br />
Textile industries, although not currently using<br />
local cassava starch negotiations are currently<br />
underway between the Government, cassava<br />
processors and the textile industry. Finally, paper<br />
mills such as Iwopin Paper Mill in Ogun State and<br />
Okui Ibokwe Paper Mill in Akwa Ibom State may<br />
also patronize cassava starch in the near future 12 .<br />
10 Cassava starch easily substitutes for imported corn starch<br />
and import bans on maize currently make cassava starch<br />
attractive. Once importation resumes however cassava starch<br />
will not be marketable at current prices. Cassava starch is<br />
currently N80 000 per tonne at factory price and N120 000-N<br />
125 000 per tonne at market price.<br />
As recently as two years ago, to reduce prices it was common<br />
for starch plants to mix cassava flour with cassava starch to<br />
break even. Fortunately the starch met most client<br />
requirements and plants remained in business. Since then<br />
prices of cassava have fallen and this has allowed the<br />
production of 100 percent cassava starch again.<br />
11<br />
ADP Rivers State should have more information on the level<br />
of expected demand.<br />
12 Provided there is adequate legislation and enforcement<br />
12<br />
Although no one can know the likelihood that<br />
these prospective buyers will actually purchase,<br />
their efforts to search out information on cassava<br />
processing fabrication offers hope. Their slowness<br />
to invest however may be a symptom of<br />
uncertainty regarding future government policy<br />
directions, uncertainty in being able to produce<br />
competitively and uncertainty in their ability to<br />
source cassava roots. As illustrated in the Peak<br />
example, cassava processing is vulnerable to<br />
many conditions – market vagaries, trade policy,<br />
product substitution, and adverse environmental<br />
impacts, to name a few.<br />
The ability (or inability) to source a reliable stream<br />
of good quality cassava roots is also a real<br />
concern for cassava processors. Problems<br />
relating to sourcing cassava roots are a serious<br />
deterrent for industrialists as described in the<br />
following example of the Mosaconi Cassava<br />
Factory in Kogi.<br />
The Mosaconi Cassava factory was a large<br />
operation that utilized raw cassava from farmers<br />
for the production of packaged gari and laundry<br />
starch for local markets. It began operations in<br />
1993 but closed in 1999.<br />
Before the establishment of the factory, the<br />
community used cheap cassava for the production<br />
of local staple foods like lafun and gari. When the<br />
company began, it patronized all cassava growers<br />
in the state and bought most of the cassava from<br />
their farms. This resulted in a scarcity of cassava<br />
and a higher selling price for smaller local<br />
processors.<br />
As local cassava prices rose, public complaint by<br />
the local people surfaced that the presence of the<br />
factory was increasing the price of lafun. This<br />
resulted in host of problems such as pilfering,<br />
administration fraud, and use of poor land, lack of<br />
adequate accurate information and vandalism of<br />
factory equipment. The factory suffered as a result<br />
and faced a shortage of cassava for its operation.<br />
Since the factory had no farm of its own, it tried to<br />
solicit cassava growers to supply cassava into the<br />
factory through radio and television jingles. This<br />
only encouraged cassava growers to truncate the<br />
maturity of planted cassava, selling cassava of<br />
less than eight months old. After many
unsuccessful attempts at troubleshooting, the<br />
owner was forced to close down the company.<br />
Clearly if cassava processing is to mature in<br />
Nigeria these types of deterrents must be<br />
resolved.<br />
3.2 FUTURE TARGETS<br />
A number of estimates exist as to future demands<br />
for cassava-based products. The President’s<br />
Initiative provides the following estimates.<br />
Table 3-5 Cassava Demand Estimates by President’s<br />
Initiative by 2007 (tonnes)<br />
Domestic Export Total<br />
Food 5 700 000 1 825 000 7 525 000<br />
Starch 1 770 000 3 200 000 4 970 000<br />
Livestock 15 622 000 75 621 248 91 243 248<br />
Ethanol 900 000 2 700 000 3 600 000<br />
Total 23 992 000 83 346 248 107 338 248<br />
A recent consultant’s report (Knipscheer, 2003)<br />
provides a more conservative estimate of potential<br />
domestic demand for cassava.<br />
Table 3-6 A Conservative Estimate of Demand (tonnes)<br />
Sector<br />
Current<br />
Alternative<br />
Product<br />
Use<br />
Substitution<br />
(%)<br />
Equivalent in<br />
fresh<br />
cassava<br />
roots<br />
(tonnes)<br />
Food 1 180 000 20 1 000 000<br />
Starch 67 100 100 350 000<br />
Livestock 1 200 000 20 1 000 000<br />
Ethanol 20 900 100 2 000 000<br />
Total 4 500 000<br />
For this study, these estimates have been merged<br />
with some additional assumptions to generate the<br />
following estimates of potential near term demand<br />
for cassava.<br />
13<br />
Table 3-7 Middle of the Road’ Estimate of Potential<br />
Demand for Cassava (tonnes)<br />
Sector Potential Market<br />
Food for Urban Market 14 157 438<br />
Food for Rural Market 4 378 788<br />
Food for Export 1 825 000<br />
Food as Flour 1 170 055<br />
Livestock 675 000<br />
Starch 335 000<br />
Ethanol 139 347<br />
Total 22 680 628<br />
The demand estimate in this study, different from<br />
the previous estimates, suggests that the human<br />
food market provides the greatest growth<br />
opportunity for cassava. The previous estimates<br />
suggested livestock and ethanol as the largest<br />
immediate markets. The explanation of human<br />
demand in this study’s estimate is the more than 4<br />
percent annual growth rate in urban population in<br />
Nigeria. This means that in a five-year period<br />
nearly 13 million people are expected to move to<br />
urban areas.<br />
It has been shown that these people continue to<br />
desire and eat cassava products. The difference<br />
between the urban dweller and the rural dweller is<br />
the tendency to develop preferences for foods that<br />
are convenient, well preserved and well<br />
packaged. These changes in preferences point to<br />
additional value addition to cassava products sold<br />
in urban areas.<br />
Markets for modified and new products are likely<br />
to develop. The estimates of potential growth of<br />
Nigerian urban and rural demand are based on<br />
population growth numbers and the maintenance<br />
of average per capita consumption rates. As is<br />
seen from Map 3-1 urban population is<br />
concentrated along Nigeria’s expressways. This<br />
relative concentration and access to better<br />
transportation should be beneficial to promoting<br />
the consumption of cassava and cassava<br />
products.
Map 3-1 Urban Centres and Express Roads in Nigeria<br />
The estimate for exported food is based on<br />
estimates of the number of Nigerian and West<br />
Africans outside of Nigeria who remain potential<br />
consumers of cassava products. Our estimate<br />
adopts the President’s Initiative estimates.<br />
The potential demand for animal feed, starch and<br />
ethanol originates from the previous consultant’s<br />
report outlined in Table 3-6. The animal feed<br />
estimate is derived from estimates of the size of<br />
Nigeria’s broiler and layer industries multiplied by<br />
the amount of animal feed they required. It is<br />
further assumed that only 60 percent of the<br />
industry uses mixed feeds and those cassava<br />
products (primarily chips and pellets) could<br />
replace 20 percent of this market. The potential<br />
for cassava flour as a replacement of wheat flour<br />
is based on a 20 percent substitution for imported<br />
wheat flour.<br />
The estimate of fresh cassava requirements for<br />
this animal feed in Table 3-7 are less than those<br />
in Table 3-6 because it was assumed that chips<br />
would be produced from unpeeled cassava. The<br />
impact of this assumption is that one tonne of<br />
chips can be produced from 2.5 tonnes of roots<br />
rather than the 1:4 ratio that is commonly<br />
practiced in Nigeria.<br />
The starch and ethanol demand figures are based<br />
on the assumption of replacing imports of these<br />
products. The fresh cassava equivalent for<br />
14<br />
ethanol in Table 3-7 is less than the estimate in<br />
Table 3-6 owing to the assumption that 150 litres<br />
of ethanol can be produced from one tonne of<br />
cassava rather than the 100 litres assumed in<br />
Table 3-6. The difference in conversion rates can<br />
be explained by different technologies and scale<br />
of production 13 .<br />
It is difficult to assess the ability of industry to<br />
process the above-mentioned amounts of<br />
cassava because these industries have been<br />
reported at running substantially below their<br />
designed capacity 14 . Due to this low level of<br />
production it is difficult to determine the timeframe<br />
required to return these industries to full capacity.<br />
This inability to absorb cassava production in a<br />
timely fashion could have damaging effects on<br />
future industrial cassava supplies.<br />
3.3 NEW <strong>IN</strong>ITIATIVES<br />
Although few, there are a number of new<br />
initiatives relating to cassava processing and<br />
utilization.<br />
First there is an initiative by IITA to increase<br />
consumer awareness with cassava recipe<br />
booklets on non-traditional ways to eat and cook<br />
with cassava. The publication is currently being<br />
modified and will be published as a manual by<br />
IITA. Information and recipes gathered from<br />
various training of processors at IITA, RTEP and<br />
ADPs are included. There remain some local<br />
snacks that need to be upgraded and included in<br />
the recipe manual.<br />
In addition to a recipe book for household<br />
consumption, a second booklet or pamphlet is<br />
required for commercial restaurateurs. Training<br />
would also sharpen food and beverage operators’<br />
understanding of cassava’s place in their<br />
businesses 15 .<br />
13 It is assumed that there was a typographical error and that in<br />
Table 3-6 the demand for ethanol should read 0.2 million.<br />
14 The textile milling industry in 1983 was reported to have 55<br />
mills with only 18 operational. Similarly liberalization of the<br />
textile industry in 1994 led to the closure of about 135<br />
companies out of 175. The feed milling industry is also said to<br />
be producing at about 15 percent capacity.<br />
15 Is there any possibility for micro finance and surveillance of<br />
graduates from such training in the nearest future?
Secondly, a project sponsored by the Department<br />
of International Development (DFID) – United<br />
Kingdom and now the European Union (EU) with<br />
NRI and the University of Agriculture Abeokuta<br />
(UNAAB) on the commercialization of traditional<br />
processed products from cassava, such as wet<br />
fufu and dried fufu has proven to be a successful<br />
initiative in South West Nigeria. This initiative has<br />
the potential to offer new opportunities to rural<br />
households – either through the sale of fresh roots<br />
or through processing and marketing. Several<br />
options exist for the commercialization of fufu,<br />
including the production of a shelf-stable product.<br />
At the rural level, processors have demonstrated<br />
their ability to adopt low-tech, low cost<br />
improvements to processing such as the<br />
construction and use of water tanks and “double<br />
fermentation”. A processing technology has also<br />
been developed for village level production of<br />
dried fufu flour using a simple drier that can<br />
operate in areas with or without electricity.<br />
The fabrication of user-friendly equipment for<br />
cassava processing in Nigeria is also witnessing<br />
renewed interest. Since 1970, the Federal<br />
Institute of Industrial Research Osodi, FIIRO, has<br />
provided a processing plant for the mechanization<br />
of cassava gari. National, regional and private<br />
fabricating centres have also demonstrated new<br />
processing equipment such as mobile graters,<br />
modified fryers, dryers and millers. Data on the<br />
adoption rate of this equipment, however, remains<br />
scarce.<br />
As part of the IITA Cassava Mosaic Disease<br />
(CMD) project, an initiative has been put forward<br />
for the collection of needed data on processing<br />
technologies and equipment. Benchmarks are<br />
needed to measure the progress of the cassava<br />
industry in the years to come. It is known that<br />
small-scale operators using low level technologies<br />
do process, but their needs, capacity or the<br />
intended benefit from moving to higher levels of<br />
technology are not known. This IITA CMD project<br />
survey will hopefully answer these questions and<br />
develop targets for future research and<br />
development in cassava processing and<br />
utilization. For example, technologies targeted to<br />
peeling may have implications on breeding of new<br />
cassava varieties.<br />
15<br />
An important initiative was started in September of<br />
2003 when a meeting of manufactures of textiles<br />
and producers of cassava starch was <strong>org</strong>anized.<br />
These types of dialogues are necessary and<br />
strongly recommended. The position put forward<br />
by the textile manufacturers was that corn starch<br />
is better than cassava starch and since Nigeria<br />
does not produce corn starch it should be allowed<br />
to import it. The key constraints identified by the<br />
textile representatives were the high moisture<br />
content of cassava starch above 13 percent, poor<br />
packaging, irregular supplies, high prices<br />
compared to imported corn starch, and<br />
unacceptable pH levels and values. The<br />
response from the cassava starch manufacturers<br />
was to suspect micro to small scale starch plants<br />
for the low standards and low starch purity levels.<br />
It was further explained, that the problems caused<br />
by low quality standards could be easily solved by<br />
patronage of medium to large starch plants. This<br />
response by the starch manufacturers is less than<br />
satisfactory and seems more like an attempt to<br />
shift blame and obtain new business. Instead an<br />
enquiry should have been suggested to determine<br />
where the textile firms were purchasing their<br />
cassava starch and what measures can be put in<br />
place to guarantee the desired product and<br />
delivery regardless of whether the supplier was a<br />
small, medium or large cassava starch<br />
manufacturer.<br />
Other processing research initiatives currently<br />
underway include developing a thin-skinned<br />
cassava that would remain unpeeled, dried and<br />
used in poultry animal feeds. By leaving the thin<br />
skin on it increases the conversion rate but also<br />
increases the fibre content of the feed 16 . Use of a<br />
yellow cassava in poultry feed is also being<br />
investigated as a positive contributor to making<br />
yolks more yellow and higher in nutrition.<br />
Finally although the new Federal Food Reserve<br />
Scheme has earmarked the collection of gari from<br />
various zones, implementation to date has been<br />
poor.<br />
16 In addition to this research, livestock feeding practices<br />
should also be investigated to see if placing the water in<br />
containers above the birds would lessen the caking of the<br />
cassava flour around the bird’s beaks.
3.4 THE WAY FORWARD<br />
State Agroprocessing and Market Expansion<br />
Groups (SAMEG) such as in Imo State have<br />
successfully demonstrated what can be achieved<br />
in state ADPs (Imo State Agricultural<br />
Development Programme (ADP), 2003). They<br />
have shown leadership and determination in the<br />
area of processing and utilization by providing a<br />
link between processing and marketing activities.<br />
As a way forward, this type of initiative should be<br />
encouraged at all ADPs as an example of<br />
supporting the cassava industry in their state.<br />
Imo State’s ADP SAMEG, began by surveying.<br />
Their yearly survey includes the identification of<br />
agroprocessors and industrial end users,<br />
agroprocessing equipment fabricators,<br />
participatory technology development, and an<br />
inventory of existing products by processor.<br />
In their most recent survey, thirty-seven gari and<br />
fufu processing groups were identified and<br />
documented. Cassava starch and flour were<br />
found as processed by products of the gari<br />
produced by rural women in their villages.<br />
SAMEG also identified 21 groups that were ready<br />
to go into partnership with any end users as a<br />
processor, marketer or producer. Their stated<br />
constraints however were poor quality of<br />
processing equipment, high cost and drudgery of<br />
operation.<br />
As an outcome from their work, stakeholder<br />
trainings and capacity building on group<br />
dynamics, record keeping, savings mobilization,<br />
participatory extension and monitoring and<br />
evaluation are being sought. A root and tuber fair<br />
is also forthcoming.<br />
This model is the hope and inspiration for the<br />
Cassava Industry in Nigeria. Worthy of greatest<br />
praise is the fact that the Imo State SAMEG has<br />
demonstrated the implementation of its stated<br />
objectives. The stated objectives include the<br />
provision of day-to-day leadership in processing<br />
and marketing activities; linkages with industrial<br />
end users; promotion of the concept of collection<br />
centres to improve marketing, finance and capital;<br />
and acquisition of equipment through partnership<br />
arrangements with industrial end users. Although<br />
the ultimate outcome of these efforts on<br />
production, incomes and employment in the state<br />
16<br />
are not documented, these activities represent the<br />
way forward.<br />
A number of industries and private individuals are<br />
showing interest in utilizing new equipment for<br />
cassava processing. After the stakeholder<br />
workshops <strong>org</strong>anized by IITA in 2001, linkages<br />
were formed between local fabricators of<br />
equipment and processors. To date, however<br />
there are no champions of cassava processing<br />
equipment to support these new equipment users<br />
and variability in the standards of fabricated<br />
equipment and installation remains. To achieve<br />
maximum utilization and output, expert opinion (or<br />
a consortium) is needed to oversee fabricators<br />
and advise new buyers of the proper use and<br />
maintenance of equipment.<br />
Small-scale local processing facilities should be<br />
strongly considered for the rural areas. Small<br />
diesel, petrol, or electric generators should power<br />
these facilities with capacities ranging from 3-6<br />
hp. Unfortunately, the scarcity of fuel and the<br />
frequent breakdown of these machines increase<br />
costs.<br />
Farm processing and cottage type processing that<br />
include storage and packaging facilities should<br />
also be promoted. The typical requirements of a<br />
cassava processing facilities include chipping<br />
machines (manual and motorized), a drying<br />
platform and tray dryers, packaging devices,<br />
graters, a press (screw and hydraulic type), a<br />
dryer, a grinder/milling (hammer/plate mills), a<br />
starch collection vat and sift (mechanical and<br />
manual). The concept of mobile processing<br />
facilities should also be promoted amongst<br />
processors.<br />
Even if time saving technologies are invented,<br />
improved processing equipment has not been<br />
introduced to village level processors. This fact<br />
has serious implications on the ability of village<br />
level processing to advance to the provision of<br />
bulk supplies, timely delivery and provision of safe<br />
consumable products.<br />
In closing, on the utilization side, a number of<br />
relatively drastic measures is commonly proposed<br />
and implemented to increase cassava utilization<br />
such as import bans and laws which force<br />
industries to use a specific level of cassava in<br />
their production. These may help to spur cassava
industries but they should be used carefully. Strict<br />
bans (such as those on poultry or textiles) may<br />
hinder regional trade and reciprocal bans may be<br />
placed on Nigeria when they wish to export their<br />
cassava-based products.<br />
An alternative to the introduction of laws forcing<br />
domestic industries to use cassava, a<br />
memorandum of understanding could be sought<br />
between all stakeholders of the Nigerian cassava<br />
supply chain. For example, the Government could<br />
commit to relieving market imperfections and<br />
improving public goods (such as transportation,<br />
communications, electricity, policy). The private<br />
sector might commit itself to working with cassava<br />
as an industrial input improving upon it so that it<br />
can effectively compete with alternative input<br />
sources. Non-governmental <strong>org</strong>anizations might<br />
commit themselves to supporting the efforts of<br />
both government and the private sector. Finally, a<br />
commitment is needed from everyone to support<br />
and defer to a ‘cassava ombudsman’ who can act<br />
on complaints of poor quality of produce,<br />
corruption and extortion that raise costs of<br />
production unnecessarily.<br />
Lastly, an industrial commodity <strong>org</strong>anization could<br />
be formed that would raise consumer and<br />
industrial awareness of cassava’s attributes and<br />
use, and ensure a minimum level of quality of<br />
product and investment in the production and<br />
future of the industry. More on this will be<br />
discussed in the final section of this report The<br />
Ultimate Way Forward.<br />
17
4 PRICES AND MARG<strong>IN</strong>S<br />
4.1 CURRENT STATUS<br />
The Cassava Handbook contains numerous<br />
tables of historical annual, monthly and state level<br />
price series for cassava roots sold in rural and<br />
urban areas as well as the overall state average.<br />
Prices for gari, chips, flour and starch and<br />
competing maize and yam prices are also<br />
provided.<br />
For this report, an overall impression on the level<br />
and patterns of price movements for these goods<br />
is provided. Detailed examination of prices can be<br />
seen from the Handbook. All state level price data<br />
were collected by the Project Coordinating Unit of<br />
the Federal Ministry of Agricultural and ADPs in<br />
the country.<br />
An overview of cassava root prices is illustrated in<br />
the map below 17 .<br />
Map 4-1 Cassava Tuber Prices by State (N/tonne)<br />
Generally cassava root prices are lowest in the<br />
southern regions of the country. The exceptions<br />
are Bayelsa, Akwa Ibom and Lagos which have<br />
high root prices. The highest cassava root prices<br />
are in the North East and North West.<br />
17<br />
The price data set did not have prices for cassava root for<br />
Benue, Borno and Kebbi.<br />
18<br />
Historical price trends of maize, s<strong>org</strong>hum, yams,<br />
millet, cassava and gari are illustrated in Figure 4-<br />
1. Cassava prices are lowest in this series while<br />
gari and yams are the highest. All except cassava<br />
and yams experienced a severe decline in prices<br />
from 1998 to 2000. Gari prices rebounded<br />
exceeding that of yams in 2001.<br />
Figure 4-1 Historical Price Series<br />
Monthly prices are illustrated in Figure 4-2 from<br />
1993 to 2003 18 for cassava, gari and maize.<br />
Cassava again is the lowest price in this series<br />
while processed gari exceeds the price of maize<br />
except for a period in mid 1998 and again in mid<br />
2000. Other than the occasional month prior to<br />
2001, gari prices closely track maize prices.<br />
Beginning in 2001 gari prices jumped steeply as<br />
did maize but the reason for the magnitude of the<br />
increase is unknown to the authors. An import ban<br />
on maize was lifted in 2000 but import duties<br />
continue to make imports expensive. Cassava<br />
prices rose in mid 2002 exceeding the maize price<br />
in only one month. By early 2003 cassava and<br />
gari prices had fallen while maize prices remained<br />
high and relatively steady throughout.<br />
18 Monthly price data for 1997 and 1999 are missing however.
naira per tonne<br />
90,000<br />
80,000<br />
70,000<br />
60,000<br />
50,000<br />
40,000<br />
30,000<br />
20,000<br />
10,000<br />
0<br />
1993 1<br />
1993 5<br />
1993 9<br />
1994 1<br />
1994 5<br />
1994 9<br />
1995 1<br />
1995 5<br />
1995 9<br />
1996 1<br />
1996 5<br />
1996 9<br />
Figure 4-2 Monthly Prices<br />
Cassava Gari Maize<br />
1998 1<br />
1998 5<br />
1998 9<br />
2000 1<br />
2000 5<br />
2000 9<br />
2001 1<br />
2001 5<br />
2001 9<br />
2002 1<br />
2002 5<br />
2002 9<br />
2003 1<br />
2003 5<br />
Regional gari prices deflated by the US dollar for<br />
this same period from 1993 to the end of 2002 are<br />
illustrated in Figure 4-3. The impression is that<br />
prices move in unison around the country. Other<br />
than some individual months where isolated<br />
peaks and dips appear, regional prices fall within<br />
a relatively narrow band. Prices in the South East<br />
have been relatively higher of late, while prices in<br />
the North Central are shown to be dropping.<br />
US$ per tonne<br />
1,400<br />
1,200<br />
1,000<br />
800<br />
600<br />
400<br />
200<br />
0<br />
1993 1<br />
1994 6<br />
1994 9<br />
1994 12<br />
1995 3<br />
1995 6<br />
1995 9<br />
1995 12<br />
1996 3<br />
1996 6<br />
1996 9<br />
1996 12<br />
1998 3<br />
1998 6<br />
1998 9<br />
1998 12<br />
2000 3<br />
2000 6<br />
2000 9<br />
2000 12<br />
2001 3<br />
2001 6<br />
2001 9<br />
2001 12<br />
2002 3<br />
2002 6<br />
2002 9<br />
2002 12<br />
North Central North East North West South East South South South West<br />
Figure 4-3 Monthly Gari Prices by Zone<br />
Figure 4-4 provides a slightly different approach to<br />
examining regional prices. In this figure gari prices<br />
for each region are averaged for each month over<br />
the time period 1993 to 2002.<br />
The lack of seasonality in gari pricing, other than a<br />
few outliers, confirms the conclusion that the<br />
relatively consistent supply of cassava roots<br />
provides a fairly predictable price throughout the<br />
year and a relatively narrow gari price band<br />
across the country.<br />
19<br />
US$ per tonne<br />
450<br />
400<br />
350<br />
300<br />
250<br />
200<br />
150<br />
100<br />
50<br />
0<br />
January<br />
February<br />
March<br />
April<br />
May<br />
June<br />
July<br />
August<br />
September<br />
October<br />
November<br />
December<br />
North Central North East North West South East South South South West<br />
Figure 4-4 Average Monthly Gari Prices<br />
Cassava has a unique characteristic in that it can<br />
be continuously harvested and marketed<br />
throughout the year. This provides a consistent<br />
supply of product, available for immediate<br />
processing at a fairly predictable price throughout<br />
the year. This could be cassava’s greatest<br />
attribute 19 , relative to competing commodities like<br />
maize.<br />
As illustrated in the following map, gari prices 20<br />
below N20 000 are primarily found in the South<br />
West and North Central. Gari prices are highest in<br />
the South South, North East and North West.<br />
Map 4-2: Gari prices by State (N/tonne)<br />
Data on the cost of cassava production and<br />
processing was not readily available. Costs of<br />
production that were available were often<br />
19<br />
The fact that it is not is indicative of problems unrelated to<br />
this one delightful attribute.<br />
20 Gari prices were not available for Borno and Kebbi.
estrictive in coverage. The best source of data<br />
found was in annual farm management surveys 21<br />
carried out by the Projects Coordinating Unit<br />
(PCU). The following data on costs is summarized<br />
for the most part from the 2000 wet season farm<br />
management survey (Projects Coordinating Unit,<br />
2002) generated through direct contact with<br />
farmers in Bauchi and Jigawa in the North East,<br />
Nasarawa in North Central, Katsina and Kebbi in<br />
the North West and Akwa-Ibom States in the<br />
South South.<br />
In the six surveyed states of the 2000 wet season<br />
farm management survey, the annual average<br />
rental cost of one ha of land for farming ranged<br />
from N656 in Jigawa to N2 088 in Akwa-Ibom.<br />
The outright purchase of land for agricultural<br />
development, although rare 22 , ranged from N11<br />
084 in Katsina to N36 929 Akwa-Ibom. The cost of<br />
land clearing is as follows:<br />
Table 4-1 Cost of Clearing Land in 2000 (N per Ha)<br />
Clearing of North Central South<br />
Old Farmland 300 500 1 000<br />
Fallow for 3-5 seasons 1 000 2 000 4 000<br />
Virgin Forestland 3 000 5 000 10 000<br />
It was reported that one ha of land from land<br />
preparation to harvesting costs approximately N62<br />
000 to maintain. Human labour per man-day is<br />
N400 plus meals. The cost of a woman-day is<br />
N300 plus meal.<br />
Production of one tonne of cassava costs N2500.<br />
The market price should be between N7 000 to<br />
N10 000 a tonne 23 . One tonne of cassava costs<br />
N2 500 to transport.<br />
The average price of cassava planting material is<br />
N100 per bundle. The average quantity of fertilizer<br />
bought by the small scale farmer was six 50 kg<br />
bags (five used and one for future use). On<br />
average, farmers applied three bags of fertilizer<br />
21 Farm Management Survey and Advisory Services (FAMAS)<br />
22<br />
Ownership is typically transferred by inheritance. Under the<br />
Land Use Act of 1978 land is owned by the Government with<br />
cultivated land under tenure by individuals and households<br />
(Department of Agriculture 2000).<br />
23<br />
Conversation with the National Cassava Growers<br />
Association, 13 November 2003.<br />
20<br />
on a hectare of land and supplemented with farm<br />
yard manure where available. Pest and disease if<br />
present were controlled with karate chemical. The<br />
cost of fertilizer is N1 300 from government<br />
sources or N2 600 on the open market.<br />
The average farm gate cassava price was<br />
reported as N8 000 per tonne. The average cost<br />
of a storage structure is N1 500 to store ten bags<br />
Rumbu or N20 500 to store 50 bags in a mud wall<br />
structure.<br />
If the average farm household size is ten, the cost<br />
of feeding the household per year was estimated<br />
in 2000 at N72 196. The cost of household<br />
maintenance (clothing, etc) was N 47 298.<br />
Estimated annual cash income for members was<br />
N67 666.<br />
These are just some estimated production costs<br />
for cassava. Interviews throughout the study<br />
provided other indicators of prices and costs.<br />
However, little can be reported since the<br />
information was not collected in a standardized or<br />
systematic manner. A national agricultural survey<br />
would be better able to capture true costs of<br />
production and processing for cassava and<br />
competing products. One factor in determining the<br />
costs of production vis-à-vis international<br />
standards is reflected in the following statement<br />
by the US report of Nigerian trade barriers.<br />
As Africa's most populous nation with an<br />
estimated 120 million people, Nigeria<br />
potentially offers investors a low-cost labour<br />
pool, abundant natural resources, and the<br />
largest domestic market in sub-Saharan Africa.<br />
However, Nigeria's poorly maintained<br />
infrastructure and difficult bureaucracy<br />
contribute to a very challenging investment<br />
climate. Due to Nigeria's inadequate services<br />
in power supply, telecommunications and other<br />
services, investors must compensate with<br />
additional measures. The "premium" or<br />
additional costs to investors of maintaining<br />
such measures is generally estimated to be<br />
about 25 percent above the total standard cost<br />
of production p.327 (United States Trade<br />
Representative, 2001).<br />
Understanding the true costs of production and<br />
processing is essential to pricing and investment.
Such calculations are used on a daily if not hourly<br />
basis to determine the appropriate mix of inputs<br />
for commercial operators.<br />
It has been said that the price of cassava must<br />
represent 80 percent of the price of maize for it to<br />
be competitive. Other benchmark prices may also<br />
exist but using this one, Figure 4-5 illustrates<br />
those states where cassava is competitive and<br />
those where it is not.<br />
Figure 4-5 Cassava-Maize Price Ratio and Cassava<br />
Production<br />
The dots in this figure represent the cassava price<br />
ratio to maize. The horizontal line represents the<br />
80 percent benchmark. Those states whose dot is<br />
above the line are said to be uncompetitive at the<br />
time of review (using 2000 prices) and those<br />
states whose dot is below the line are said to be<br />
competitive. Coupled with the level of cassava<br />
production in each state (the bars) one can<br />
quickly see those states that have an advantage<br />
in cassava production, processing and utilization.<br />
Cross river, Rivers, Enugu, Imo, Kogi and Kaduna<br />
all appear to be strong contenders barring other<br />
considerations such as resources in land, labour,<br />
water, etc.<br />
4.2 FUTURE TARGETS<br />
There are two future price and margin targets for<br />
Nigeria to strive for. The first is a short-term target<br />
that lowers domestic costs of production and final<br />
prices to remain competitive against internal<br />
competition. The second, a long-term target, that<br />
lowers the costs of production and final prices to<br />
attain international competitiveness.<br />
21<br />
In the case of the first target, it is the impression<br />
that cassava has only been used by industry<br />
when maize or wheat prices were high. Potential<br />
users of cassava do not generally talk of using<br />
cassava because the price is low. There is a need<br />
to achieve lower cassava prices so that cassava<br />
is used because its price is competitive.<br />
In most instances the competitive price for<br />
cassava is the price of imported replaceable<br />
commodities. The primary candidates for<br />
replacement are maize, wheat flour, ethanol and<br />
starch. It is assumed that cassava chips or pellets<br />
could be competitive with maize and it is also<br />
assumed that cassava chips would be produced<br />
in the Thai manner with a 1 to 2.5 ratio of chips to<br />
roots. The conversion factor in this table also<br />
includes the aforementioned 80 percent factor<br />
(3.125=2.5/.80). Cassava flour is assumed to be<br />
the prime commodity to compete with imported<br />
wheat and wheat flour in the bakery, confectionary<br />
and flour milling industries. Fresh cassava is<br />
assumed to be the primary input for the<br />
production of ethanol. Finally, cassava starch<br />
could compete with imported starches.<br />
The following table indicates the range of these<br />
prices (high and low) and converts them to a naira<br />
value (the last column of the table). This value<br />
provides an indication of the target price (roots<br />
plus processing) that would make cassava and<br />
cassava products competitive.<br />
For example, it would appear that cassava chips<br />
or pellets could be competitive with maize if the<br />
cost of cassava roots and processing was in the<br />
range of N6 550 to N12 254. Obviously when<br />
maize prices are low the cost of roots and<br />
processing has to be at the lower price range.<br />
For cassava to be competitive in the ethanol and<br />
starch industries, the cost of cassava roots and<br />
processing should be in the range of N11 213 and<br />
N18 860.<br />
When attempting to identify the relative<br />
importance of these target prices it should be<br />
recalled that the cost of processing cassava<br />
differs greatly between the industries. Ethanol<br />
processing is probably the highest cost industry<br />
followed by starch – at least the production of high<br />
quality modified starch.
Table 4-2 Calculated Cassava Root and Processing Price<br />
Replace crop<br />
commodity<br />
US$/tonne or<br />
litre<br />
Import<br />
Price<br />
US$<br />
Conversion Root<br />
Price<br />
US$<br />
Roots<br />
and<br />
Proces<br />
sing<br />
Price<br />
Naira<br />
Maize (l) 178 3.125 56.96 6 550<br />
Maize (h) 333 3.125 106.56 12 254<br />
Wheat Flour 250 5 50.00 5 750<br />
Wheat Flour 415 5 83.00 9 545<br />
Ethanol 0.65 150 97.50 11 213<br />
Ethanol 0.7 150 105.00 12 075<br />
Starch 540 5 108.00 12 420<br />
Starch 820 5 164.00 18 860<br />
Source: Maize and wheat import prices (<strong>FAO</strong><br />
various years). Ethanol and starch<br />
(Subcommittee, 2002).<br />
A discussion of the second price and margin<br />
target requires a move outside of Nigeria. While<br />
Nigeria dominates in the production of cassava,<br />
Thailand, dominates as the major exporter of<br />
cassava products. In 2002, Thai exports of dried<br />
cassava, cassava starch and tapioca totalled<br />
US$3.6 billion. This represents 81 percent of total<br />
cassava export values in 2002 (US$4.5 billion).<br />
As the world’s largest exporter of cassava chips,<br />
pellets, cassava starch and flour, all other existing<br />
and potential exporters must accept the Thai price<br />
as its world price or ‘price to beat’.<br />
Table 4-3 Thai Exports Value and Quantity 2002<br />
2002<br />
Thailand<br />
Cassava<br />
Dried<br />
Cassava<br />
Starch<br />
Cassava<br />
Tapioca<br />
Cassava<br />
Equivalent<br />
Tonnes 2 904 153 767 420 22 612 11 621 252<br />
‘000 US$ 191 227 135 020 5 520 346 783<br />
Unit Price US$65.84 US$175.94 US$244.11 US$29.84<br />
The export unit prices in Table 4-3 indicate that<br />
competitively priced cassava ranges from<br />
US$65.84 per tonne for dried cassava to<br />
US$244.11 per tonne for cassava tapioca. More<br />
specific price targets can be found from the Thai<br />
Tapioca Trade Association web site, prices are<br />
up-dated twice a month. Super high grade<br />
Tapioca flour/starch is priced at US$175-185 per<br />
tonne. Tapioca Hard Pellets Shipment shipped to<br />
the European Union on 3 December 2003 were<br />
22<br />
priced at US$82-83 per tonne and Tapioca Chips<br />
shipped to China on 4 January 2004 were priced<br />
at US$74-75 per tonne. It should also be noted<br />
that the quantity of dried cassava exports were up<br />
30 percent in 2003.<br />
Figure 4-6 Volume Thai Exports<br />
An examination of recent historical trends in Thai<br />
trade illustrates some interesting changes. The<br />
quantity of exported Thai pellets has declined<br />
since 1999. In contrast Thai chip exports have<br />
risen such that chip/pellet trade has almost<br />
balanced out. Thai starch exports have shown<br />
slow yet steady increases over this same<br />
timeframe.<br />
Figure 4-7 Value Thai Exports<br />
Looking now at the value of Thai exports, it is not<br />
surprising that chips and pellet values have<br />
followed quantity levels. Relatively new to the<br />
scene, starch export values have achieved very<br />
high added values.<br />
Price ratios in Thailand currently range between<br />
2.09 to 2.43 for chips to root and 5.39 to 6.50 for<br />
starch to roots, as of 15 January 2004. On top of<br />
these narrow margins, Thailand’s pelleting<br />
capacity is vast.
Thailand currently has 200 pellet factories with a<br />
total capacity of 10 million tonnes a year. At<br />
present the EU quota is 5 million tonnes a year,<br />
which means Thailand, is working at 50 percent<br />
capacity equivalent to three to four months a year<br />
and is quite ready to increase supply in response<br />
to international demand.<br />
4.3 NEW <strong>IN</strong>ITIATIVES<br />
Returning to the Nigerian domestic market for<br />
food and industrial goods and the farm modelling<br />
exercise, one of the most interesting results<br />
provided by the regional production models is the<br />
estimates of the amount of cassava that could be<br />
marketed as a result of the adoption of improved<br />
production practices and improved varieties.<br />
These results are highlighted in the following chart<br />
and figures.<br />
million tonnes<br />
160.00<br />
140.00<br />
120.00<br />
100.00<br />
80.00<br />
60.00<br />
40.00<br />
20.00<br />
0.00<br />
2ha Only Yield & 2ha 1ha Only Yield 15 Yield 20<br />
NC NE NW SE SS SW<br />
Figure 4-8 Marketable Cassava by Alternative<br />
Scenarios<br />
The model suggests that improvements in<br />
agronomic practices coupled with the use of<br />
improved yields can lead to large increases in the<br />
amount of cassava that could be marketed. This is<br />
consistent with often-repeated statements that the<br />
adoption of mosaic resistant cassava varieties<br />
could lead to large increases in cassava<br />
production.<br />
The increase in marketable cassava changes the<br />
relative importance of other marketable crops as<br />
illustrated in Maps 4-3 and 4-4.<br />
Map 4-3 is the base scenario of the model. It<br />
illustrates that the South East and North Central<br />
are the primary sources of marketable cassava.<br />
The South West is identified as the primary<br />
23<br />
source of marketed yams and the North West as<br />
the primary source of s<strong>org</strong>hum and maize.<br />
Map 4-3 Primary Marketed Crops Base Scenario<br />
The source and amount marketed changes for the<br />
scenario of improved agronomic practices and<br />
yields of 20 tonnes/ha is illustrated in Map 4-4.<br />
All regions except the North East are identified as<br />
potential marketers of cassava. The North Central<br />
is identified as the region with the greatest<br />
marketing potential while the North West, South<br />
East, South South and South West have nearly<br />
equal potential.
Map 4-4 Primary Marketed Crops in 20 tonnes/ha<br />
Scenario<br />
The substantial increase of marketable cassava<br />
does not necessarily imply a decrease in the<br />
marketing of other commodities.<br />
As illustrated in Table 4-4, results of the model<br />
suggest that in many cases increased availability<br />
of marketable cassava is accompanied by<br />
increased availability of marketable quantities of<br />
competing crops.<br />
24<br />
Table 4-4 Marketing Impact of Scenario where Yield<br />
Increase to 20 tonnes/ha<br />
Region Crops Amount<br />
Marketed<br />
North Central Cassava Increased<br />
Maize Increased<br />
Millet Increased<br />
S<strong>org</strong>hum Decreased<br />
Yams Increased<br />
North East Cassava Increased<br />
Maize Increased<br />
Millet Increased<br />
S<strong>org</strong>hum Increased<br />
Yams Increased<br />
North West Cassava Increased<br />
Maize Increased<br />
Millet Decreased<br />
S<strong>org</strong>hum Decreased<br />
Yams Unchanged<br />
South East Cassava Increased<br />
Cocoyam Increased<br />
Maize Decreased<br />
S<strong>org</strong>hum Decreased<br />
Yams Decreased<br />
South South Cassava Increased<br />
Cocoyam Decreased<br />
Maize Increased<br />
S<strong>org</strong>hum Decreased<br />
Yams Increased<br />
South West Cassava Increased<br />
Cocoyam Unchanged<br />
Maize Increased<br />
S<strong>org</strong>hum Decreased<br />
Yams Decreased<br />
In general, the model suggests that the adoption<br />
of improved production practices and improved<br />
cassava varieties can lead to substantial<br />
increases in the production of cassava and the<br />
availability of marketable cassava. This appears<br />
possible while meeting existing food consumption<br />
requirements and within the limits of available<br />
land. It also appears that these changes do not<br />
require large negative changes in the production<br />
and marketing of other crops. The model also<br />
suggests that the proposed improvements could<br />
increase employment opportunities.<br />
It must however be remembered that this is only<br />
the output of a model. A model that operates at a<br />
rather aggregate level and a model that is based<br />
on restricted information. Notwithstanding these
caveats, it can be suggested that the results are<br />
consistent with the conclusions of other<br />
assessments of the potential benefits that could<br />
be derived from adopting improved cassava<br />
production practices and improved cassava<br />
varieties (Implementation by IITA, 2003), (RTEP,<br />
1995).<br />
4.4 THE WAY FORWARD<br />
The Farm Management Survey provides an<br />
invaluable opportunity to quantify the health of the<br />
agricultural industry in Nigeria and the overall<br />
effectiveness of national agricultural programmes<br />
and policies. It also provides advisory information<br />
for extension agents. Typically, agents are<br />
encouraged to use these guides to identify<br />
weaknesses and strengths of like-farms,<br />
identifying areas of over or underutilization of<br />
resources.<br />
These data can also support marginal pricing<br />
analysis to determine true costs of production and<br />
appropriate returns to production and investment.<br />
An essential requirement for the development of<br />
an industrial cassava industry in Nigeria is the<br />
need for industrial cassava to be marketed at<br />
competitive prices. The problem for the private<br />
sector, as illustrated in the case of the missing<br />
cassava, is that if there is not a sufficient supply of<br />
cassava to sustain both industrial and existing<br />
food demands, cassava supplies will drift to the<br />
market offering the highest price. Cassava<br />
intended (and possibly even contracted) for use in<br />
the industrial sector will find its way into the food<br />
sector. To illustrate this point the need for a<br />
‘purple cassava’ has been identified.<br />
The need for a ‘purple cassava’ implies the need<br />
for two separate cassava markets in Nigeria;<br />
cassava produced and processed for the food<br />
market and cassava produced and processed for<br />
the industrial market.<br />
The ‘purple cassava’ solution implies the need for<br />
an easily and identifiable mechanism to prevent<br />
industrial cassava from entering the food market.<br />
Whether breeding can create a cassava variety in<br />
Nigeria that is undesirable for human<br />
consumption, yet desirable for industrial use, is<br />
something that has yet to be seen.<br />
25<br />
As a means of achieving price and margin targets,<br />
it is strongly suggested that improvements must<br />
be made at every stage of the cassava industry’s<br />
supply chain. Established and proven models<br />
exist for describing, assessing, measuring and<br />
improving supply chains. One state-of-the-art<br />
model is called the Supply Chain Operations<br />
Reference (SCOR) Model (Supply-Chain Council,<br />
2004). The model provides a framework that links<br />
business process, metrics, best practices and<br />
technology features into a unified structure to<br />
support communication among supply chain<br />
partners. The objective of SCOR is to improve the<br />
effectiveness of supply chain management and<br />
related supply chain improvement activities.<br />
Figure 4-9 provides an overview of a SCOR<br />
roadmap to improve supply chain operations.<br />
Firstly, competition is analysed, a supply chain is<br />
configured, and performance levels, practices and<br />
systems are aligned and implemented. Feedback<br />
is linked back through the model and specific<br />
metrics are used to measure progress at each<br />
stage of the chain. The SCOR roadmap provides<br />
a convenient way to bring together supply chain<br />
members with a common purpose to improve the<br />
supply chain. The SCOR approach can be<br />
developed with the support of outside agents who<br />
assist the supply chain members as they tackle<br />
the different SCOR levels. Although single firms<br />
most often use this analysis, application to an<br />
entire subsector would be groundbreaking if<br />
accomplished.<br />
Figure 4-9 A Roadmap for Supply Chain Development
5 DEVELOPMENT CLUSTERS<br />
5.1 CURRENT STATUS<br />
One of the more noticeable and highly expressed<br />
prerequisites in developing an efficient Cassava<br />
Industry in Nigeria was the need for better roads<br />
and cheaper transportation.<br />
Throughout the study, access to markets and<br />
transport were found related to the quantity that<br />
producers sold. In the RTEP survey, respondents<br />
located on the road or within 5 km of the market<br />
were more likely to indicate that they sold more<br />
than 50 percent of home consumption compared<br />
with those located more than 5 km away from the<br />
market.<br />
Table 5-1 Marketed Produce and Distances to Markets<br />
State<br />
Percent Sold Percent Sold<br />
Distance to Market<br />
0-50 percent 50-100 percent<br />
Akwa Ibom road and 10km 6.49 8.31<br />
Kaduna road and 10km 6.53 21.44<br />
Lagos road and 10km 2.09 9.27<br />
Nassarawa road and 10km 0.75 4.05<br />
Ogun road and 10km 0.06 0.90<br />
Oyo road and 10km 0.60 6.63<br />
Plateau road and 10km 2.70 8.14<br />
Marketing produce in Nigeria is complicated by<br />
many hidden factors related to supplying produce<br />
to markets. For example, the only available<br />
transport is by truck and highway. Rail service is<br />
virtually non-existent in Nigeria. Reliance on<br />
highway transportation means roads are heavily<br />
travelled and are in need of regular maintenance<br />
and upgrading. Unfortunately good quality roads<br />
are few and maintenance irregular.<br />
27<br />
Breakdowns, accidents, congestion and road<br />
closures all represent a substantial cost for<br />
Nigerians and the economy. Transportation<br />
expenses represent a high percentage of the final<br />
product price. While travelling the study team<br />
interviewed three traders travelling from Ikom in<br />
Calabar. Their 9 11 lorry was faulty and they were<br />
offloading 50 kg bags of gari while the gari trader<br />
was looking for a vehicle to carry them to Uyo.<br />
Their full 9 11 Lorry load of gari was priced by the<br />
trader at N30 000 which must build in the costs<br />
and likelihood that such a breakdown would<br />
occur.<br />
Another example of extraordinary costs to<br />
marketing is the time it takes to hire a vehicle and<br />
roadblocks. Traders on the New Haven Express<br />
reported that it took them from 1630 hours on<br />
Friday 12 December 2003 until 0930 hours the<br />
following day (the time of the interview) waiting<br />
and negotiating with transporters on the cost per<br />
bag for transport. The Enugu traders reported<br />
that transporters were insisting on N70 or N100<br />
per bag of gari while they were negotiating for<br />
N50 per bag of gari. Transporters will typically<br />
charge N10 000-N20 000 for 200 bags of gari (a<br />
full 9 11 lorry) depending on road conditions and<br />
frequency of security checks (road blocks) that<br />
demand money from drivers. An example of the<br />
number of roadblocks, demanding money from<br />
drivers, is listed in Table 5-2. Breakdowns, time<br />
to negotiate with transporters and roadblocks all<br />
add to the cost of food in Nigeria.<br />
Table 5-2 Road Blocks for a Selection of Routes<br />
Route Road conditions<br />
Ibadan-Abeokuta 7-10 Road blocks<br />
Ibadan-Iseyin 6-8 Road blocks<br />
Ibadan-Niger Worst route many road blocks<br />
Ibadan-Ogbomosho 30 Road blocks<br />
Ibadan-Ogbomoso 8-10 Road blocks<br />
Ibadan-Oyo 0-15 Road blocks<br />
Ibadan-Oyo Very difficult for some tribes to pass<br />
Ibadan-Saki 7-10 Road blocks<br />
Ibadan-Sokoto Bad roads, numerous road blocks<br />
Ojoo-Iwo 6 Road blocks<br />
Ojoo-Mokola 7 Road blocks<br />
Figure 5-1 illustrates the cassava price variability<br />
from rural to urban areas by state. These price<br />
differences can be used as a proxy for transaction<br />
costs (which include transportation) between rural
and urban markets. Costs appear highest in the<br />
Northern States.<br />
Figure 5-1 Transaction Costs Between Rural and Urban<br />
Centres<br />
Typically one would expect the price of cassava to<br />
be lower in the rural areas of state production than<br />
in the urban areas of state consumption. Negative<br />
values mean the opposite has occurred, the price<br />
in the rural areas was found to be higher than the<br />
price in urban areas. This can happen if traders<br />
upon entering the urban market find themselves<br />
unable to sell their produce and therefore must<br />
accept a price less than they could have received<br />
in their rural location or else return home with the<br />
produce. This can also happen if the urban area is<br />
able to attract a broad range of sellers (especially<br />
from outside the state) then the price reflects<br />
lower costs of production than that found in the<br />
State’s rural areas.<br />
Another way to examine transportation costs is to<br />
ask transporters their prices and experiences.<br />
Table 5-3 lists the unit price per kilometre and<br />
tonne by route and type of vehicle. Although<br />
restricted to points starting from Ibadan, a range<br />
of destination points are provided. The unit costs<br />
are surprisingly consistent, ranging from N3 per<br />
km per tonne for a distance of 165 km to N8 per<br />
km per tonne for the Owerri-Lagos route.<br />
28<br />
Table 5-3 Transportation Routes and Unit Costs<br />
Route km tonne<br />
Cost per<br />
km and<br />
tonne<br />
Type of<br />
Vehicle<br />
Ibadan-Abeokuta 77 14 3.25 3-Seater Bus<br />
Ibadan-Abeokuta 77 18 3.25 Mazda Bus<br />
Ibadan-Abuja 645 30 5.68 Trailer<br />
Ibadan-Bauchi 1 070 30 4.98 Trailer<br />
Ibadan-Ilorin 162 14 2.47 3-Seater Bus<br />
Ibadan-Ilorin 162 18 2.47 Mazda Bus<br />
Ibadan-Iseyin 75 18 3.33 Mazda Bus<br />
Ibadan-Iseyin 75 14 3.33 3-Seater Bus<br />
Ibadan-Jos 928 30 4.49 Trailer<br />
Ibadan-Kaduna 756 30 4.41 Trailer<br />
Ibadan-Kano 1 005 30 4.64 Trailer<br />
Ibadan-Kano 1 005 30 3.98 Trailer<br />
Ibadan-Katsina 1 065 30 4.07 Trailer<br />
Ibadan-Lagos 141 30 3.55 9 11 Lorry<br />
Ibadan-Maiduguri 1 532 30 3.70 Trailer<br />
Ibadan-Ogbomoso 100 14 3.00 3-Seater Bus<br />
Ibadan-Ogbomoso 100 18 3.00 Mazda Bus<br />
Ibadan-Oyo 42 18 3.57 Mazda Bus<br />
Ibadan-Oyo 42 14 3.57 3-Seater Bus<br />
Ibadan-Saki 165 14 2.73 3-Seater Bus<br />
Ibadan-Saki 165 18 2.73 Mazda Bus<br />
Ibadan-Sokoto 890 30 4.49 Trailer<br />
Ibadan-Yola 1 545 30 3.67 Trailer<br />
Ibadan-Zaria 827 30 4.43 Trailer<br />
Owerri-Lagos 574 15 8.13 9 11 Lorry<br />
Owerri-Lagos 574 15 6.97 9 11 Lorry<br />
In an attempt to identify the location of industrial<br />
users of cassava the Corporate Affairs<br />
Commission, which registers business names and<br />
handles the incorporation of companies, was a<br />
logical first step. Its list of businesses, if available,<br />
would have provided an unbiased list and location<br />
of numerous businesses across Nigeria.<br />
Unfortunately this information was unobtainable.<br />
Even though it has a web site (Corporate Affairs<br />
Commission, 2004) that suggests that a<br />
downloadable CD is available repeated attempts<br />
to contact the head office in Abuja by telephone,<br />
fax and e-mail were fruitless.<br />
A second option was to request a directory of<br />
members from known industrial associations. This<br />
option however had the potential to be biased in<br />
favour of those associations that are more<br />
established and better <strong>org</strong>anized, at least in terms<br />
of listing their members and locations.<br />
The method finally used was to list all potential<br />
users of industrial cassava from the National
Telephone Directory Yellow Pages Section. It was<br />
believed that such a listing of industries would<br />
represent an unbiased cross-section of like<br />
industries, at least in terms of their desire to be<br />
listed in the Yellow Pages telephone directory.<br />
Whether they still exist or not as an industry in<br />
Nigeria was irrelevant to the purpose of getting a<br />
general idea of preferred locations for industrial<br />
cassava production and processing.<br />
The categories used to collect the yellow pages<br />
listings included all possible industries, namely,<br />
Baby Food and Products Manufacturers, Bakers<br />
and Confectioners, Biscuit Manufacturers,<br />
Canned Food Manufacturers, Confectionery Raw<br />
Material Suppliers, Supermarkets and Department<br />
Stores, Explosives, Farmers, Fish Farmers, Flour<br />
Mills, Food Contractors and Foodstuffs Suppliers,<br />
Food Processing Companies, Foods and<br />
Beverage Producers, Gari Processing Industries,<br />
Grinding Mills, Hotels, Restaurants, Livestock<br />
Feed Manufacturers, Mud Products, Newspaper<br />
Manufacturers, Packaging Industries, Paper Bags<br />
Manufacturers, Paper Mills, Converters and<br />
Distributors, Poultry Farms, Poultry Feeds (Feed<br />
Mills), Shipping Companies and Agents, Snack<br />
Stores and Suppliers, Starch Mills, Textile<br />
Manufacturers, Timber Industries, Trade<br />
Organizations, Trade Promotion and<br />
Transporters.<br />
Of the 2 356 firms found, some were obviously<br />
more interesting than others. For example, poultry<br />
farms and feed mills are meaningful because of<br />
the extent to which they could utilize cassava in<br />
their feeds. Food processing industries such as<br />
bakeries and flourmills are also interesting<br />
because of the potential to substitute cassava for<br />
wheat flour. The concentration of supermarkets<br />
and transportation faculties was also interesting in<br />
terms of access to urban markets.<br />
The Cassava Handbook contains numerous maps<br />
similar to the two shown here for textiles and<br />
bakeries. Of note, is the level of concentration<br />
along the main expressways running North South<br />
from Kano to Lagos and East West from Aba to<br />
Lagos.<br />
This type of data is valuable to the selection of<br />
future processing locations and production sites.<br />
29<br />
Map 5-1 Location of Textile Firms<br />
Map 5-2 Location of Bakeries<br />
5.2 FUTURE TARGETS<br />
Data from the Handbook provides information on<br />
the number of small, medium, large or<br />
international size plants that would be required to<br />
process the additional demand that was described<br />
earlier in the processing and utilization section.<br />
It is clear that the number of small and cottage<br />
scale industries necessary to meet potential<br />
demand is very large (Table 5-4). The implication<br />
being that the realization of this size of potential<br />
market opportunities will need to be coupled with<br />
the development of larger scale processing<br />
facilities.
Table 5-4 Number of Plants Required to Meet<br />
Estimated Demand<br />
Scale of Operation<br />
Market Small Medium Large World<br />
Food for urban 96 969 - - -<br />
Food for rural 29 992 - - -<br />
Food for export 12 500 - - -<br />
Food as flour 12 823 - - -<br />
Livestock chips 4 623 2 312 - -<br />
Livestock pellets - - 39 12<br />
Starch 4 589 - - 92<br />
Ethanol 1 145 57 29 2<br />
For the supply-chain to develop and survive there<br />
is a need to get the members of the supply chain<br />
to work together to assure that production,<br />
collection, delivery and processing activities are<br />
scheduled to work together. If key components of<br />
supply are ahead or behind schedule it is quite<br />
possible that the supply chain will fail.<br />
The number of small and medium processing<br />
plants is great and will likely be scattered across<br />
the country. The estimate for large and world<br />
scale processing plants is more manageable to<br />
fathom and it is for these plants that the following<br />
selection criteria was formulated.<br />
5.3 NEW <strong>IN</strong>ITIATIVES<br />
Suggesting the best production locations or best<br />
locations to set up a plant is a difficult task and the<br />
answer will change depending on the objectives<br />
and situations facing the person, persons or<br />
institution desiring to know the best location. A<br />
number of conditions are necessary for selecting<br />
production and/or processing areas. The main<br />
one being proximity to the user.<br />
Owing to data limitations, recommendations on<br />
the best site must be primarily limited to state<br />
recommendations. An approach is suggested<br />
which can be modified and adapted to different<br />
levels of aggregation.<br />
It is suggested that the selection of best cassava<br />
production sites are not necessarily the best sites<br />
for production. However, owing to the bulkiness of<br />
cassava and the need, at times, to process freshly<br />
harvested cassava, the distance between<br />
30<br />
production and processing sites may become a<br />
critical decision factor.<br />
The selection approach demonstrated is based on<br />
selected data contained in the Handbook. The<br />
selected data are considered to be indicators of<br />
the suitability of each state as a cassava<br />
production or processing site. Individuals can<br />
select their preferred indicators.<br />
For this study the following Table contains the<br />
indicators and the measures that were considered<br />
positive for production and processing sites.<br />
Table 5-5 Site Selection Variables and Related<br />
Indicators<br />
Production Positive<br />
Indicator<br />
Processing<br />
Positive<br />
Indicator<br />
Population<br />
Density<br />
Low, MLow<br />
Cassava<br />
Root Price<br />
Production and price variables were also<br />
considered in the selection process. It is<br />
suggested that states with higher than average<br />
yields (greater than 12 tonnes/ha) were better<br />
locations for increasing cassava production. Low<br />
absolute root prices (less than N8 000) and root<br />
prices below the 80 percent maize threshold price<br />
were also interpreted as indicators of<br />
competitively priced cassava and good producing<br />
states.<br />
The selection of potential processing industrial<br />
sites follows the process associated with the<br />
selection of potential production sites. It is argued<br />
that the prices of cassava roots, gari and ratio of<br />
cassava to maize prices are all relevant. Low<br />
priced cassava roots are an obvious benefit to<br />
processing industries. Low gari prices (less than<br />
N20 000) are also beneficial. If the price of gari is<br />
high there could be a tendency to divert cassava<br />
roots from new industries to the gari market.<br />
Similarly, a low cassava to maize price ratio again<br />
is taken as an indicator that cassava is<br />
competitively priced.<br />
The availability of expressways is taken as being<br />
beneficial to new industries, both in terms of their<br />
sourcing of raw material and their ability to move<br />
their products to markets.<br />
Finally the existence of industries that are<br />
potential cassava users (animal feed, flour and<br />
starch) was taken as a positive indicator.<br />
The number of positive indicators was counted<br />
and used as a gauge of the suitability of the state<br />
for expanded cassava and industrial processing of<br />
cassava. The following Table 5-6 lists the results<br />
of the selection process.<br />
31<br />
Table 5-6 Results of Site Selection Criteria<br />
Zone State<br />
High<br />
Production<br />
Potential<br />
High<br />
Processing<br />
Potential<br />
NC Kogi <br />
NC Kwara <br />
SS Edo <br />
SW Ogun <br />
SW Ondo <br />
SW Oyo <br />
NC Benue - <br />
NC Nassarawa - <br />
NW Kano - <br />
NW Niger - <br />
SE Abia - <br />
SE Anambra - <br />
SE Enugu - <br />
SS Delta - <br />
SS Rivers - <br />
SW Lagos - <br />
NC Abuja - -<br />
NC Plateau - -<br />
NE Adamawa - -<br />
NE Bauchi - -<br />
NE Borno - -<br />
NE Gombe - -<br />
NE Jigawa - -<br />
NE Lake Chad - -<br />
NE Taraba - -<br />
NE Yobe - -<br />
NW Kaduna - -<br />
NW Katsina - -<br />
NW Kebbi - -<br />
NW Sokoto - -<br />
NW Zamfara - -<br />
SE Ebonyi - -<br />
SE Imo - -<br />
SS Akwa Ibom - -<br />
SS Bayelsa - -<br />
SS Cross River - -<br />
SW Ekiti - -<br />
SW Osun -<br />
Six states are identified as exhibiting potential for<br />
expanded production (Map 5-3). Sixteen states<br />
were identified as exhibiting potential for<br />
processing cassava on a large scale (Map 5-4).
Map 5-3 States Identified for Expanded Cassava<br />
Production<br />
The six states identified for production were also<br />
identified as potential processing sites. The<br />
selected states cover the zones North Central,<br />
South South and South West.<br />
Map 5-4 States Identified for Expanded Industrial<br />
Cassava Processing<br />
The results of the preceding analysis need to be<br />
assessed in light of data limitations and the fact<br />
that a different set of variables or cut-off levels<br />
would greatly alter the results.<br />
32<br />
Nevertheless it is hoped that the approach may be<br />
useful to those trying to identify the best cassava<br />
growing areas or best cassava processing areas.<br />
The addition of intra-state data can assist with the<br />
selection of production or processing data. The<br />
following Map 5-5 illustrates the LGAs that ADP<br />
staff members identified as their best cassava<br />
LGAs.<br />
Map 5-5 LGAs identified by ADP Staff as Best for<br />
Cassava Development<br />
What is interesting to note is that the best LGAs in<br />
Kogi, Enugu and Benue almost constitute one<br />
large area that is rated as being very good for<br />
cassava production.<br />
5.4 THE WAY FORWARD<br />
The Nigerian Cassava Growers of Ogun State<br />
identified the need to reduce the distance required<br />
to move product to processing centres and<br />
markets. They suggested less than a 70 km<br />
radius or maximum of 200 km radius 24 . The<br />
supply of public goods such as electricity, portable<br />
water and a good road system was also frequently<br />
identified as necessary improvements in Nigeria<br />
by those interviewed.<br />
Four ways to reduce transportation costs caused<br />
by road blocks include the elimination of such<br />
blockages, the legalization and regulation of<br />
blockages, the preferred (free) passage of<br />
transport carrying cassava, cassava processed<br />
24 Personal interview 11 November, 2003
and cassava using products (with complaints to a<br />
cassava ombudsman or private police force) and<br />
a government refund of the charges imposed by<br />
such blockages.<br />
Much is required to lower cassava production,<br />
processing and marketing costs in Nigeria.<br />
Perhaps a first step would be to provide a<br />
structure and <strong>org</strong>anization to the industry. The<br />
Handbook is a beginning; an association and<br />
application of supply chain management would<br />
also help.<br />
33
6 THE ULTIMATE WAY FORWARD<br />
The task to be faced now is to how to develop<br />
successful long-term relationships between<br />
members of the cassava supply chain (farmers to<br />
agribusiness entrepreneurs) to address and<br />
resolve the problems faced by everyone from<br />
ineffectual markets, low levels of technology use,<br />
and inadequate policy and regulatory systems.<br />
There is no shortage of recommendations. The<br />
team while undertaking this study identified no<br />
less than 300 recommendations 25 . Each one was<br />
suggested as a means for addressing a genuine<br />
problem or concern. Rather than listing them here<br />
(although it is strongly recommended that one<br />
should review them for future consideration) it was<br />
preferred to suggest a process or way forward to<br />
building a legitimate and respected cassava<br />
industry in Nigeria that may activate its own<br />
solutions.<br />
To date cassava remains, in the eyes of most<br />
Nigerians, a food security or self-sufficiency crop.<br />
Although their consumption of cassava in the form<br />
of processed gari and fufu suggests otherwise,<br />
the perception remains strong. It is not thought of<br />
as an agrifood industry capable of moving the<br />
Nigerian economy forward. It is not thought of as<br />
able to provide a marketable convenience food to<br />
a growing urban market nor as an export-earning<br />
provider. It is not known by the general population<br />
that it is capable of providing high quality flour,<br />
starch, animal feed and ethanol energy. These<br />
are just some of the knowledge gaps, attitudes<br />
and mind-sets that must change and if changed,<br />
will stimulate cassava’s role and importance in<br />
Nigeria’s agricultural economy and overall<br />
development.<br />
6.1 THE OBJECTIVE<br />
This will entail support from champions outside<br />
and inside the industry. In the early years of<br />
change this will most likely be initiated through<br />
small-scale processing chains and vertical<br />
integration in selected industries. To get there<br />
cassava partners must start to think bigger.<br />
25 The list is available upon request.<br />
35<br />
Thinking bigger in this context means partners<br />
must begin thinking beyond one’s own enterprise;<br />
thinking beyond their operations; thinking<br />
backwards by forming strong and trusted linkages<br />
with one’s suppliers of raw material and thinking<br />
forwards by forming strong and trusted linkages<br />
with one’s customers.<br />
Thinking bigger is not about thinking of bigger<br />
profit margins or bigger outputs and capacities.<br />
Thinking bigger is first thinking about ensuring that<br />
contracts are fulfilled and high levels of quality<br />
and service are maintained throughout the supply<br />
chain all the way to final consumer satisfaction.<br />
Final and intermediate consumer satisfaction will<br />
ensure the success of the cassava industry. Small<br />
firm level successes will eventually lead to bigger<br />
successes and ultimately the success of a larger<br />
industry.<br />
6.2 BENEFICIARIES<br />
The anticipated beneficiaries of a successful<br />
cassava supply chain are the producers,<br />
processors, traders, transporters and consumers<br />
of cassava today and in the future. Cassava,<br />
presently and accurately is described as an<br />
orphaned commodity without institutional,<br />
<strong>org</strong>anizational and policy support. The number of<br />
intended beneficiaries can be thought of as the<br />
sand in an hourglass: a large number of<br />
smallholder producers feeding into a narrow<br />
opening of traders, processors and final product<br />
distributors, opening again to a large number of<br />
low-income consumers of the final product.<br />
6.3 THE PROCESS<br />
The process for change must be demand driven.<br />
In this analysis untapped value added product<br />
opportunities for cassava were identified in urban<br />
convenience foods such as ready to eat or serve<br />
gari and fufu, breads and snacks to name just a<br />
few. Cassava crop expansion was identified as<br />
willing and able. The constraints that prevent<br />
production from meeting its demand potential are<br />
vast, as evident from interviews with industrialists,<br />
producer groups, state extension officers,<br />
previous reports (NAPA, etc) and the list of<br />
recommendations. Yet, given these vast<br />
constraints there remains hope and optimism that<br />
these constraints can be overcome if the industry<br />
is able to find a way to work together for its
greater good, set for itself well defined indicators<br />
of progress and a mechanism to monitor, detect<br />
and solve subsequent foreseen and unforeseen<br />
problems.<br />
The process begins with the identification of a<br />
group of interested enthusiasts that will act as<br />
catalysts, and hopefully champions, for the<br />
Nigerian Cassava Industry. This means catalysts<br />
and champions not only for the industry itself but<br />
catalysts and champions representing each link in<br />
that chain from production to processing to final<br />
consumption.<br />
These catalysts and champions, if serious, would<br />
be willing to put their time and energies into<br />
<strong>org</strong>anizing events and activities that will give input<br />
and ideas to the development of the industry.<br />
Legitimate activities of such a group would be to<br />
identify the constraints limiting the exploitation of<br />
opportunities, ways of overcoming the constraints<br />
and modalities for proceeding.<br />
When agreement is reached, action can proceed.<br />
In simple terms this means a concerted effort to<br />
overcoming identified market imperfections with<br />
the anticipated outcome that the supply chain is<br />
improved, or minimally begins to exist.<br />
An on-going programme of data collection is a<br />
prerequisite for this process to succeed. Without<br />
reliable data generating an accurate knowledge<br />
base, simulating new ideas and future directions,<br />
and providing planning and performance<br />
evaluation advice, little can be reasonably<br />
expected. Data and evaluations provide a guide<br />
for improving, modifying and introducing new<br />
activities.<br />
Capacity building is also a prerequisite for this<br />
process to succeed. The skills and attributes<br />
required for this process include data base<br />
management, <strong>org</strong>anizational behaviour, problem<br />
solving, negotiation and facilitation, benevolent<br />
leadership and unrelenting patience.<br />
6.4 OUTCOMES AND ACTIVITIES<br />
The overriding goal of this process is to contribute<br />
to the development and maintenance of a well<br />
functioning market for Nigerian cassava and<br />
cassava products. To do this, a series of<br />
36<br />
outcomes and activities are suggested to remove<br />
barriers to progress.<br />
As each barrier is removed, it is anticipated that<br />
new efficiencies are gained, economic incentives<br />
are identified, opportunities for product<br />
development and product utilization are realized<br />
and industrial growth occurs.<br />
It is already known from interviews throughout the<br />
country and industrial reports that linkages<br />
between suppliers and users of cassava products<br />
are weak and damaged; that in the industrial<br />
market, cassava supplies are uncompetitive at<br />
current prices and unstable at competitive prices;<br />
and that traditional markets of processed foods<br />
such as gari and fufu are by and large untapped<br />
to date. These facts illustrate both promise and<br />
room for improvement. However, barriers such as<br />
mistrust, impatience and inaction coupled with<br />
exceptional costs, market imbalances, hidden<br />
information, barriers to new entrants and unequal<br />
quality of products, inhibit growth potential.<br />
Outcome 1: Industrial Cooperation and Trust<br />
Presently players and potential players in the<br />
cassava marketplace are guarded and distrustful<br />
of each other. Many have strong and legitimate<br />
complaints as discussed in the previous sections<br />
of this report. Producers and processors distrust<br />
traders and middlepersons, traders and<br />
middlepersons distrust transporters and end<br />
users.<br />
Therefore, before filling a room with market<br />
stakeholders expecting them to immediately work<br />
together to identify and solve problems within the<br />
supply chain, an environment of trust, confidence<br />
and cooperation must be established. An event, a<br />
reason, a purpose must be invented that will draw<br />
them together devoid of adversarial agendas.<br />
A positive environment that encourages changing<br />
attitudes needs to be created. Trust, honesty,<br />
cooperation, problem solving and building lasting<br />
relationships (if not friendships) are requirements.<br />
From this changed position, each subsequent<br />
activity of the industry stakeholders is more likely<br />
to succeed.<br />
One event under which such an environment<br />
might be immediately created is the planning and
<strong>org</strong>anization of a National Cassava Fair. Different<br />
than the International Cassava Trade Show<br />
(currently underway for 2004), but possibly linked<br />
to the timing and excitement of that show, this fair<br />
would be targeted to domestic producers,<br />
processors, consumers and potential users of<br />
cassava nationally. The objective of the fair is to<br />
engage industrial stakeholders in a tangible<br />
activity that is positive, exciting, different and<br />
hopefully fun.<br />
The long-term outcome of such an event includes:<br />
stronger networks and improved<br />
linkages throughout the marketing<br />
chain;<br />
greater trust and understanding of<br />
the interdependency among<br />
industry participants;<br />
excellence within all aspects of<br />
the cassava industry;<br />
pride in the accomplishments<br />
achieved by the industry;<br />
heightened profile of the<br />
importance of and potential within<br />
the cassava industry;<br />
improved consumer and retailer<br />
attitudes toward cassava and<br />
cassava based products;<br />
Measurable outcomes in terms of<br />
attendance, consumer awareness<br />
and ownership.<br />
Outcome 2: Ownership and Leadership<br />
The second outcome required for the Nigerian<br />
Cassava Industry is a sense of ownership and<br />
leadership. The cassava industry throughout<br />
Nigeria has long been neglected as a valued and<br />
respected contributor to modern agriculture. Yet<br />
cassava production is greater than the ‘more<br />
respected’ and ‘more <strong>org</strong>anized’ commodities in<br />
Nigeria. For the cassava industry to mature in<br />
Nigeria it too must <strong>org</strong>anize itself in such a way<br />
that it can provide leadership to initiate, propel<br />
and activate desirable and needed changes.<br />
37<br />
Without ownership, change is meaningless.<br />
Without leadership, change will not happen.<br />
One mechanism used to provide ownership and<br />
leadership to stakeholders of an industry is to<br />
form an association. In today’s society of political<br />
lobbying and global competition the formation of<br />
industry commodity associations, is almost<br />
mandatory. In North America is it common to see<br />
an association formed to represent even the<br />
smallest agricultural niche market let alone an<br />
industry the size of cassava in Nigeria. The<br />
specific objectives of a Nigerian cassava industry<br />
association could be to:<br />
foster cooperation among industry<br />
participants along the supply<br />
chain from suppliers of raw<br />
material to the final end users;<br />
lobby state and federal<br />
governments for improvement in<br />
transportation, infrastructure, data<br />
collection and conducive policy;<br />
promote the attributes of cassava<br />
and encourage greater utilization;<br />
encourage excellence and use of<br />
high quality raw material and final<br />
product development;<br />
educate the public, policy-makers,<br />
investors, and members in the<br />
production and marketing of<br />
cassava and cassava products by<br />
updating and distributing the<br />
Cassava Statistical Handbook;<br />
exchange information on local,<br />
national and regional demands,<br />
supplies and prices;<br />
disseminate timely market<br />
information, of interest to all<br />
industry participants;<br />
Assist in the provision of<br />
crosscutting services such as<br />
insurance, transportation,<br />
storage.
Providing a more <strong>org</strong>anized, more efficient and<br />
more relevant cassava industry encourages<br />
ownership and leadership. An improved cassava<br />
industry could significantly advance the<br />
commercialization of smallholder agricultural<br />
production, the economic welfare of members<br />
within the cassava supply chain, their rural<br />
communities and urban consumers.<br />
It is strongly recommended that the association<br />
seek the active membership or at least the<br />
observing representation of publicly respected<br />
consumers. Membership might include<br />
representatives from the teachers or nurses<br />
unions. Representation by either would provide<br />
reassurance to the general public that their<br />
concerns and opinions were being heard,<br />
especially if awareness campaigns were initiated<br />
by the industry. It would also provide an all<br />
important dialogue between producers,<br />
processors and consumers of cassava and<br />
cassava products. A two way educational process<br />
is necessary if industrial and consumer biases are<br />
to change.<br />
For those public goods that cannot be provided<br />
through industrial <strong>org</strong>anization or associations,<br />
such as improved transportation, highways,<br />
communications and security, the newly formed<br />
cassava associations can begin lobbying<br />
respective governments of the importance of such<br />
needed and justifiable services.<br />
Outcome 3: Quality of Product and Profit<br />
Once the industry has been able to achieve a<br />
sense of cooperation and trust, ownership and<br />
leadership, members should feel empowered to<br />
make the necessary changes that ensure the<br />
production of quality products and profit.<br />
Without trust, without honesty, without selfregulating<br />
quality assurance, without meeting<br />
commitments, advances cannot be made in the<br />
commercialization of cassava in Nigeria. Without<br />
these things, purchases sight unseen cannot be<br />
made; contracts guaranteeing supply and price<br />
cannot be trusted; and product users cannot<br />
predict the outcome of their efforts. These traits<br />
(trust, honesty, quality and commitment) form the<br />
basis (or back bone) of all successful market<br />
economies. Without them Nigeria’s entry into a<br />
38<br />
global marketplace will not happen and if it does it<br />
will not be sustained.<br />
Although these traits originate from one’s own<br />
individual character, an industry can encourage<br />
and reward these traits in numerous ways. Firstly,<br />
by setting an example and a standard by which to<br />
follow. For example, leaders of the Cassava<br />
Industry Association can exemplify transparency<br />
at all costs. Meaning that their personal accounts<br />
(records and bookkeeping) and that of the<br />
association are open to public scrutiny and<br />
inquiry, their participation in illegal activities is<br />
strictly prohibited and that checks and balances of<br />
power within the association are assured.<br />
Only when the association and its leadership itself<br />
are shown to be honest, trustworthy, and<br />
dependable and committed stewards for the<br />
industry can it assist and encourage its<br />
membership to maintain a quality of product that<br />
is profitable.<br />
Homogeneous and substitutable cassava<br />
products according to quality and grade improve<br />
price determination and marketing conditions.<br />
Transaction costs are lowered as contracts can<br />
now be articulated and enforced. Products can be<br />
handled in greater volume and travel greater<br />
distances if grades and standards convey<br />
accurate information about the product. This helps<br />
to determine prices and helps to define contracts<br />
of delivery. This leads to lower transaction costs,<br />
the ability to bulk product keeping prices and<br />
transportation costs low, improved efficiency of<br />
markets, more transparency, and the identification<br />
of market niches. The ability to provide a standard<br />
and uniform product will provide those sellers with<br />
a premium price because such changes provide<br />
savings further along the supply chain.<br />
In addition to the premium prices that will be<br />
received by those that meet their quality and<br />
timely commitments to buyers, industrial rewards<br />
may also be awarded in terms of peer respect and<br />
esteem. ‘Awards of excellence’ as defined and<br />
described throughout the industrial supply chain<br />
can be bestowed upon ‘the best of the best’ in the<br />
industry.<br />
Quality encouraging projects can also be initiated<br />
by the industry for children and youth within and<br />
outside the school system. This will ensure a
continuous supply of high quality, highly educated<br />
and motivated cassava producers and<br />
industrialists for the future. Members of the<br />
Teachers and Nurses Union could help to<br />
facilitate such educational programmes and<br />
rewards. Large industrial users of cassava may<br />
also see the advantages to their companies to be<br />
seen funding and promoting such programmes in<br />
Nigeria.<br />
Membership within such a highly regarded<br />
Cassava Industrial Association may also exact a<br />
cost in terms of maintaining and sustaining the<br />
minimum standard of product quality. For the<br />
betterment of the industry the Association may<br />
choose to insist and enforce a minimum level of<br />
product quality on its members to complement<br />
generic advertising campaigns. When running an<br />
expensive advertising campaign, quality and<br />
delivery of product is all important. If the quality is<br />
not as advertised or not on the shelf as promised,<br />
the costly advertising has been for nothing. A<br />
generic advertising campaign requires sufficient<br />
supplies of the advertising quality of product to<br />
meet anticipated demand. This is particularly<br />
difficult with a highly perishable commodity such<br />
as cassava in the food market. That said if the<br />
product is available and meets its advertised<br />
quality the returns to a generic advertising<br />
campaign is very rewarding.<br />
Outcome 4: Information and Planning<br />
The final outcome suggested from this study is<br />
that of information and planning. Information is the<br />
basis of successful planning. Planning forms the<br />
basis of successful outcomes. Thus a full circle<br />
turn has been made. All the above-mentioned<br />
outcomes must be based on informed decisionmaking<br />
and planning. Planning implies<br />
<strong>org</strong>anization. It implies thinking ahead of what is<br />
needed to be done now to be prepared for the<br />
future. This is what research provides. To many<br />
industrialists, research has little meaning yet they<br />
themselves undertake research (or information<br />
seeking) every day when they plan and make their<br />
decisions about future activities.<br />
As an industry, a minimum amount of respect and<br />
attention must be given to the results and<br />
suggestions from applied research in production,<br />
processing, distribution mechanisms, market<br />
research and product development. Competitive<br />
39<br />
funding in support of excellence and innovation<br />
within the cassava industry should be given<br />
priority. The purpose of such funds is to target the<br />
advancement of small, medium and large scale<br />
agricultural activities in cassava production,<br />
marketing and product and human resource<br />
development. The outcome of these funds is to:<br />
increase the sale of locally grown<br />
or processed cassava products;<br />
develop and commercialize<br />
innovative cassava technologies;<br />
develop new uses for cassava;<br />
contribute to the long-term<br />
economic health of cassava<br />
growing communities;<br />
create partnerships within the<br />
cassava subsector and across<br />
sectors;<br />
lead to the long-term<br />
competitiveness of the cassava<br />
industry;<br />
Enhance international and/or<br />
cross-border trade.<br />
The anticipated use of these funds is to support<br />
and encourage market participants and<br />
stakeholders to address and resolve both<br />
anticipated and unanticipated problems as they<br />
arise.<br />
Conclusion<br />
The overriding objective of this study and these<br />
outcomes is to encourage an environment where<br />
industry agents initiate and activate the market<br />
corrections within their power. Each outcome and<br />
activity is suggested in the spirit of providing<br />
positive support to a deserving cassava industry.<br />
By rewarding innovation, efficiency and<br />
excellence in the New Nigerian Cassava Industry,<br />
it is strongly believed that both the human spirit<br />
and domestic economy will be advanced.<br />
Sustainability demands a participatory process,<br />
transparency, relevancy and cost recovery. It is<br />
suggested that each activity follows its own path
starting with small modest objectives and budgets,<br />
growing only as cost recovering resources allow.<br />
Sustainability also demands ownership of change.<br />
It means participating fully and being rewarded for<br />
that participation. It means taking ownership of the<br />
problems and difficulties arising from change.<br />
Changing attitudes, consumer perception, and<br />
business practices are not easy and require<br />
patience and time and initiation from within.<br />
40
REFERENCES<br />
1. Angar, Boma, 2004. Large Scale Cassava Production. Unpublished handout.<br />
2. Central Bank of Nigeria.<br />
3. Corporate Affairs Commission. "CAMA." Web page, [accessed 15 January 2004]. Available at<br />
www.cac.gov.ng.<br />
4. Department of Agriculture, Federal Ministry of Agriculture and Natural Resources Nigeria. 2000.<br />
Cassava Development in Nigeria: A Country Case Study Towards a Global Strategy for<br />
Cassava Development. Rome, Italy: <strong>FAO</strong>.<br />
5. <strong>FAO</strong>. 2004a. Online Statistical Database. Rome, Italy: Food and Agriculture Organization of the<br />
United Nations, Web Site www.fao.<strong>org</strong>.<br />
6. <strong>FAO</strong>. "Trends in Cassava Production." Web page, [accessed 2004b].<br />
7. <strong>FAO</strong>. Various years. <strong>FAO</strong> Trade Statistics. Rome, Italy: <strong>FAO</strong>.<br />
8. Federal Office of Statistics. 2001. Nigerian Foreign Trade Summary, January - December 2001.<br />
Abuja, Nigeria: Federal Office of Statistics.<br />
9. FMANR, Department of Planning, Research and Statistics. 1997. Nigerian Agricultural Statistics.<br />
10. IITA. 2002. Competitiveness workshop. Opportunities for Cassava in Nigeria. Bokanga, IITA-<br />
Ibadan.<br />
11. IITA. 2004. Nigerian's Cassava Industry: Statistical Handbook.<br />
12. Imo State Agricultural Development Programme (ADP). 2003. Report on the State Agro-Processing<br />
and Market Expansion Group (SAMEG).<br />
13. Implementation by IITA. 2003. Assessment of Nigeria's Agricultural Policy, USAID - Nigeria.<br />
14. Knipscheer, Henk. 2003. Opportunities in the Industrial Cassava Market in Nigeria, IITA, Ibadan.<br />
15. Kormawa, P. & Akoroda, M.O. 2003. Cassava Supply Chain Arrangements for Industrial Utilization<br />
in Nigeria. Ibadan: IITA.<br />
16. Nigerian Ministry of Health and Nutrition. 2004. National Consumption Survey.<br />
17. PCU. 2002. Field Situation Assessment of 2001 Wet Season Agricultural Production in Nigeria.<br />
18. PCU. 2003. Crop Area Yield Survey. Abuja, Nigeria: Federal Ministry of Agriculture and Rural<br />
Development: Project Coordinating Unit.<br />
19. Projects Coordinating Unit. 2002. Advisory Handbook 2000/2001. Abuja, Nigeria: Federal Ministry<br />
of Agriculture and Rural Development.<br />
20. RTEP. 1995. Roots and Tubers Expansion Programme: Formulation Report (Vol. 2), 91/95 IFAD-<br />
NIR 64. IFAD, Rome.<br />
41
21. RTEP. 2001. Baseline Survey.<br />
22. Scott, G.J., Rosegrant, M.W. & Ringler, C. 2000. Roots and tubers for the 21st Century: Trends,<br />
projections, and policy for developing countries. Washington, D.C.: IFPRI.<br />
23. Shaib, Bukar, Adamu Aliyu, & Bakshi, J.S. 1997. Nigeria National Agricultural Research Strategy<br />
Plan: 1996-2010. Ibadan, Nigeria: Intec Printers Limited.<br />
24. Subcommittee. 2002. Report of the President's Committee on Cassava Production and Export.<br />
25. Supply-Chain Council. Web page [accessed 2004]. Available at www.supply-chain.<strong>org</strong>.<br />
26. United States Trade Representative, Office of 2001. "National Trade Estimate Report on Foreign<br />
Trade Barriers: Nigeria." Web page.<br />
27. World Bank. 2004. ICT at a Glance Tables. Washington, D.C.: World Bank web site.<br />
42
APPENDIX A<br />
Cassava Market Opportunity and sub Sector Analysis<br />
IITA, Ibadan<br />
Nigeria is the largest producer of cassava in the world. Its production is currently put at about 34 million<br />
metric tonnes a year (<strong>FAO</strong>, 2002). Total area harvested of the crop in 2001 was 3.125 million ha with an<br />
average yield of 10.83 tonnes per ha. Presently, cassava is primarily produced for food especially in the<br />
form of gari, lafun and fufu with little or no use in the agribusiness sector as an industrial raw material. But<br />
the crop can be processed into several secondary products of industrial market value. These products<br />
include chips, pellets, flour, adhesives, alcohol, and starch, which are vital raw materials in the livestock,<br />
feed, alcohol/ethanol, textile, confectionery, wood, food and soft drinks industries. They are also tradable<br />
in the international market.<br />
In 2002, the President of Nigeria announced an initiative to use cassava as a foreign revenue earner of<br />
five billion naira annually three years hence. To achieve this, there is need to develop the domestic<br />
market, diversify the use of cassava in industries, curtail the threat of the virulent form of the cassava<br />
mosaic virus and entrench national policies that will leverage cassava development in the country<br />
(Cassava Competitiveness workshop, 2002). Unfortunately, no supply chain structures exist for the<br />
commercialisation of secondary cassava products as primary source of raw materials for agro industries<br />
(Ezedinma et al, 2002). At the farm level, production costs for cassava are high relative to other countries.<br />
Production is not oriented towards commercialisation but instead farmers produce and process cassava<br />
as a subsistence crop (Dixon, 2002). The current status and potential demand for cassava and its<br />
secondary products as industrial raw material in Nigeria is neither unknown nor documented. To guide<br />
the commercialisation of cassava such documents are important. The absence of a commercial approach<br />
to cassava production and marketing in Nigeria justifies a synchronised approach involving several<br />
partners in the development of the sector. It has become imperative to provide data that will inform<br />
investment on the industrial development of the cassava sub sector. The development of the sector will<br />
also require initial activities in capacity building, product development, fabrication and transfer of<br />
processing technologies to target beneficiaries and development of clusters to supply identified markets.<br />
Processing Problems and Issues<br />
Cassava tubers consist of 60 to 70 percent water and have a shelf life of 2 to 3 days. Once harvested, the<br />
tubers have to be processed or consumed immediately otherwise the tubers begin to deteriorate.<br />
Transportation of fresh tubers from farm to processing sites therefore becomes critical for quality and cost<br />
reasons; such that transportation is a major cost component in cassava processing. The need for<br />
processing arises to stabilise the crop for storage purposes and price stability guaranteeing higher prices<br />
for farmers. However, the cost of acquiring simple processing machines is prohibitive for the small farmer<br />
and in the more humid cassava producing areas, the use of dryers is critical. There is also a need to<br />
ascertain accurately the effect of processing costs on the final price of the cassava products. This will<br />
also influence investment decisions especially for emerging agro industries. Unfortunately, credit on<br />
capital investments even for small processing plants is difficult to obtain due to risks and past experiences<br />
of banks with poor business ethics of clients.<br />
Against this background, the challenge for cassava industrialisation lies with the reduction in the cost of<br />
production and transformation to enable the supply of cheaper processed products of desired quality and<br />
standards to markets including potential agro industries. This involves the identification of market<br />
opportunities, the <strong>org</strong>anisation and training of clients, including farmers, processors, and traders to<br />
43
espond to the demands of existing and potential market opportunities to enhance effective farm<br />
agribusiness linkages and agricultural trade.<br />
Objectives<br />
The general objective of this survey is to provide comprehensive information that will guide investment<br />
decisions in the cassava sub sector. The specific objectives are grouped under several headings namely:<br />
production, processing and equipments, transportation and cluster development, products and products<br />
development, market competitiveness and export.<br />
The specific objectives are as follows<br />
1. Identify the technical, institutional, socio-economic and policy opportunities and constraints for<br />
promoting the cassava sub sector<br />
2. Assess the domestic market opportunity for cassava products (chips pellets, flour, starch, ethanol and<br />
so on) in Nigeria and suggest how this potential could be realised<br />
3. Evaluate the economics of cassava production and processing costs structures (and profitability) of<br />
value adding cassava enterprises and suggest reduction strategy<br />
4. Determine optimal locations of processing plants based on identical markets for various cassava<br />
products with markets<br />
5. Provide information on marketing cost structure from rural to urban areas for cassava and its products<br />
and determine the break-even distance and volume for cassava transportation<br />
6. Make recommendations on how to make cassava and cassava products competitive within the<br />
domestic and export markets<br />
Activities<br />
The analysis will follow a vertical agribusiness perspective in which we assume that the cassava sub<br />
sector is segmented into four categories were cassava is produced at the farm level by farmers,<br />
processed into chips, flour and pellets by processors, and used by agro industries to produce other<br />
products like ethanol, dextrin/adhesives, native and modified starch, etc for the other industrial (e.g.<br />
textiles, paper, wood, etc) and consumer (food and beverage) markets.<br />
Production<br />
1. Provide information on the production cost for cassava per ha in the cassava producing states in<br />
Nigeria<br />
2. Ascertain the cassava varieties available and their actual and potential yield<br />
Processing and Equipments<br />
3. Evaluate the economics of existing cassava processing equipments and new equipment such as flash<br />
dryers, solar dryers, centrifuge, washing machine, peeling machine etc.<br />
4. Ascertain the current status of processing technology, and local maintenance capacity in Nigeria<br />
5. Ascertain and evaluate the conversion ratios for different cassava products<br />
44
Transportation and Cluster Development<br />
6. Provide information on transportation costs from rural to urban areas for cassava tubers, gari, etc on<br />
kilometre per tonne basis for 30 km, 60 km and 90 km radius<br />
7. Describe the supply chain requirements and identify preliminary logistic framework for cluster<br />
development in the SE, SW, and middle belt of Nigeria<br />
Products and Products Market<br />
8. Provide information on price trends for cassava and cassava-based products relative to other dry grain<br />
products like maize, s<strong>org</strong>hum, and rice<br />
9. Determine the availability and existing use of secondary cassava products and the key agribusiness<br />
firms as well as their supply chain structure (e.g. farmer groups, processor groups, etc)<br />
10. Identify and assess the status of existing and potential industries (e.g. food, animal feed, textile,<br />
paper, plywood, glue, pharmaceuticals, starch, alcohol and so on) that use or can potentially use cassava<br />
products<br />
11. Ascertain the market share and size of use of cassava as raw material in these identified industries in<br />
Nigeria<br />
12. Identify existing and potential volumes, prices, quality standards, and delivery schedules for cassava<br />
based products used by the various industries in Nigeria<br />
Competitiveness and Export<br />
13. Using Private cost ratio, domestic resource costs, nominal protection coefficient for output and<br />
profitability coefficient ascertain the degree of cassava competitiveness in Nigeria<br />
14. Provide information on export quality requirements, delivery schedule, shipping costs and<br />
requirements, international prices for cassava based products, and niche markets for Nigerian cassava<br />
(e.g. composite pellets, etc)<br />
Other information<br />
15. Provide any other information and recommendations that will guide investment decisions in the<br />
cassava sub sector<br />
Methodology of the market investment Survey<br />
The market and sub sector study will be carried out through a review of existing documents and surveys.<br />
A sub sector is a vertical slice in the commodity chain from input supply to consumption showing all the<br />
stages and key players in the chain. In the cassava chain the study will focus on cassava producers,<br />
processors and traders as well as banks, input dealers and extension institutions. The study will cover all<br />
the major sectors where the cassava and cassava products are (potentially) utilised. These include the<br />
food, feed and industrial sectors.<br />
Data will be collected in three stages: first wherever available, published data would be used to establish<br />
the structure, conduct and performance of cassava sub-sector. Secondly, a rapid appraisal survey will be<br />
conducted using focussed group interviews and key informants to obtain information on trading patterns,<br />
transportation facilities, processing costs and marketing systems. The third stage of the study will focus<br />
on the captains of industry that use or are potential users of cassava. This industrial survey will among<br />
45
other things focus on the size and volume of different cassava commodities required in the domestic<br />
market.<br />
The study will require extensive travels to institutions, industries, and various States of the federation<br />
especially the south-south and south east zones of Nigeria. Visits will be made to the Projects<br />
Coordinating Unit, of the Federal Ministry of Agriculture and Rural Development located at Abuja, the<br />
National Root Crops Research Institute, Umudike, the State Agricultural Development Projects, reputable<br />
cassava fabrication centres such as IITA, ARCEDEM, PRODA, Adis Engineering Lagos, Nova<br />
Technologies, the Export Processing Zone Calabar, and Chambers of Commerce and so on. Apart from<br />
Abuja, various agribusiness firms located in the major industrial areas of Nigeria and particularly the<br />
south-south and south east zones the will be visited. These include industries located in Lagos, Ibadan,<br />
Kaduna, Kano, Port Harcourt, Onitsha, Nnewi. Aba, Calabar, and so on.<br />
Information to be collected will include production and price data for cassava tuber, cassava based<br />
products (gari, chips, flour, starch, etc), and grains such as maize, s<strong>org</strong>hum, soybean, and rice;<br />
availability and cost of cassava processing technology, maintenance capacity, and location of reputable<br />
fabricators and large scale processing industries in Nigeria; availability of improved cassava varieties,<br />
yield per ha, and suitability for different cassava based products; supply chain requirements, structure for<br />
commercialisation and development, market size, segments by product and prices, export limitations,<br />
opportunities and incentives, tariffs and barriers and so on.<br />
Team Composition<br />
This study will require a team of three (3) persons (Agricultural economist, Agronomist and post-harvest<br />
specialist). An agricultural economist will lead the team and will also collate and document a draft report<br />
for the study.<br />
Team Composition<br />
The duration of the survey will be two months while another month will be required to write up a draft of<br />
the sub sector survey.<br />
Expected Output<br />
Information on the production cost for cassava per ha in the cassava producing states in Nigeria provided<br />
Information on available cassava varieties and their actual and potential yield provided<br />
The economics of existing cassava processing equipments and new equipment such as flash dryers,<br />
solar dryers, centrifuge, washing machine, peeling machine etc evaluated<br />
Information on the current status of processing technology, and local maintenance capacity in Nigeria<br />
provided<br />
The conversion ratios for different cassava products evaluated<br />
Information on transportation costs from rural to urban areas for cassava tubers, gari, etc on kilometre per<br />
tonne basis for 30 km, 60 km and 90 km radius provided<br />
The supply chain requirements and preliminary logistic framework for cluster development in the SE, SW,<br />
and middle belt of Nigeria identified<br />
Information on price trends for cassava and cassava-based products relative to other dry grain products<br />
like maize, s<strong>org</strong>hum, and rice provided<br />
46
Information on the availability and current use of secondary cassava products and the key agribusiness<br />
firms as well as their supply chain structure (e.g. farmer groups, processor groups, etc) provided<br />
Information on existing and potential volumes, prices, quality standards, and delivery schedules for<br />
cassava-based products used by various industries in Nigeria provided<br />
Information on the degree of cassava competitiveness in Nigeria using private cost ratio, domestic<br />
resource costs, nominal protection coefficient for output and profitability coefficient provided<br />
Information on exports quality requirements, delivery schedule, international prices for cassava-based<br />
products, and niche markets for Nigerian cassava (e.g. composite pellets, etc) provided<br />
Selection of the most lucrative investments for detailed analysis based on the initial evaluation<br />
Any other information and recommendations that will guide investment decisions in the cassava sub<br />
sector provided such as identification of target communities (producers), processors, middlemen,<br />
fabricators, and other key stakeholders, using criteria set in the project focus (market access, supporting<br />
services, high probability of success, etc).<br />
47
APPENDIX B<br />
Data Adjustments for Model Development<br />
Model development began with the identification of enterprise budgets that were consistent with those<br />
found in each of the regions (PCU, 2002), Table 2). For example s<strong>org</strong>hum/millet/cowpea enterprise<br />
budgets were included in the North West and North East regional models, but not in the models of the<br />
North Central, South East, South South and South West.<br />
The resulting regional enterprise budgets had to be adjusted to reflect regional differences. For example,<br />
enterprise budget labour costs were adjusted by an index of regional labour costs. We calculated these<br />
latter indices. Data on published labour rates for different agricultural activities for each state (PCU,<br />
2002), Table 22) were averaged for each region and then expressed as an index of the calculated<br />
national average labour cost.<br />
Enterprise budget crop yields and selling price were replaced by the calculated regional crop yields and<br />
selling prices. Regional crop yields were calculated from data obtained while visiting PCU. Regional<br />
prices were calculated from data provided by IITA’s Rural Sector Enhancement Programme (RUSEP).<br />
The above-mentioned formed the core technical and objective coefficients for the regional models.<br />
Regional land constraints were determined as the average of land normally devoted to the crops in the<br />
regional models. The regional land constraint was calculated from the data used to calculate regional<br />
crop yields. Regional producer food consumption was calculated from multiplying estimates of the<br />
percentage of farm production consumed on the farm (RTEP, 1995) by the regional estimate of regional<br />
production.<br />
48
This publication presents an analysis of the actual and potential size of the market for cassava and<br />
cassava-based products in Nigeria and reviews what is required in terms of economic, social and physical<br />
investments to develop an efficient cassava industrial sector. It aims at guiding investment decisions for<br />
donors, banks and policy-makers in the Nigerian cassava subsector.<br />
The outcome of the study works on encouraging an environment whereby the industry agents initiate and<br />
activate the market corrections within their power. They are not a set of static rules; on the contrary, they<br />
encourage ownership of the problems and difficulties arising from change as well as modifications in<br />
order to address local needs and circumstances in a participatory process involving different partners in<br />
the new Nigerian cassava industry. The study will interest a wide range of readers including cassava<br />
producers, policy-makers, donors and banks, scientists and technicians, non-governmental <strong>org</strong>anizations<br />
and the private sector.<br />
49