FINANCIAL STATEMENTS 2010 - Finnlines
FINANCIAL STATEMENTS 2010 - Finnlines
FINANCIAL STATEMENTS 2010 - Finnlines

Create successful ePaper yourself
Turn your PDF publications into a flip-book with our unique Google optimized e-Paper software.
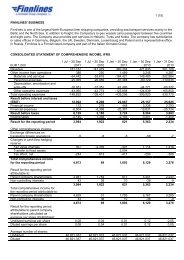
8. PERSONNEL EXPENSES<br />
EUR 1,000 <strong>2010</strong> 2009 2008<br />
Employee benefit expenses<br />
Salaries -99,046 -96,770 -110,937<br />
Other social costs -16,399 -16,007 -17,002<br />
Pension expenses – defined contribution plans -14,416 -12,849 -15,111<br />
Pension expenses – defined benefit plans -202 32 -1,145<br />
Government grants for shipping companies 19,429 16,831 20,172<br />
-110,635 -108,763 -124,023<br />
Average number of Group employees<br />
Shipping and Sea Transport Services 1,392 1,408 1,430<br />
Port Operations 703 642 1,006<br />
2,096 2,050 2,436<br />
The average number of employees has been calculated by converting the regular working hours performed during the reporting period<br />
to correspond to a full-time employee. The average number of employees was recalculated accordingly for 2009.<br />
Based on Finnish and Swedish legislation, <strong>Finnlines</strong> has received EUR 19.4 million government grants for personnel expenses in order<br />
to improve competitiveness for merchant vessels. In Finland the amount corresponds to the tax witheld in advance of seamen's income,<br />
the amount paid by the employer for the seamen in social security fees, pension fees and employee’s insurance fees. In Sweden the<br />
state subsidy corresponds to tax witheld in advance of seamen's income and the amount paid by the employer for the seamen in em-<br />
ployer’s social fees.<br />
Based on the terms of the grants, if the subsidies have been granted on false premises the authorities in each country can claim back<br />
the subsidies. <strong>Finnlines</strong> is not aware of any such risks.<br />
9. DEPRECIATION, AMORTISATION AND OTHER WRITE-OFFS<br />
EUR 1,000 <strong>2010</strong> 2009<br />
Depreciation of tangible assets<br />
Buildings -2,835 -3,113<br />
Machinery and equipment -6,207 -7,320<br />
Vessels and ship shares -48,585 -48,003<br />
Amortisation of intangible assets -2,493 -2,573<br />
Depreciation of investment properties -2 -4<br />
Impairment on other capitalised expenditures -200<br />
Total depreciation and amortisation -60,322 -61,012<br />
<strong>Finnlines</strong> subsidiary in Germany has booked EUR 0.2 million as impairment loss for its shares in a company not listed.<br />
10. OTHER OPERATING EXPENSES<br />
EUR 1,000 <strong>2010</strong> 2009<br />
Port expenses, equipment and other voyage related costs -60,368 -65,113<br />
Leases -43,112 -70,931<br />
Manning service costs and other non-obligatory personnel costs -7,970 -8,000<br />
Vessel insurances, repairs and maintenance costs -25,054 -24,651<br />
Catering costs -9,801 -10,585<br />
IT costs -2,931 -3,237<br />
Sales and marketing costs -3,397 -3,055<br />
Real estate costs excluding rents and leases -4,284 -4,945<br />
Other costs -8,933 -8,595<br />
-165,850 -199,113<br />
Manning service costs and other non-obligatory personnel costs are net of German government grants relating to shipping<br />
personnel being a fixed sum per employee depending on which level the employee is working.<br />
(figures in EUR thousand, if not stated otherwise)<br />
FINNLINES PLC Financial Statements <strong>2010</strong><br />
21