annual business survey of economic impact 2008 appendix - Forfás
annual business survey of economic impact 2008 appendix - Forfás
annual business survey of economic impact 2008 appendix - Forfás

You also want an ePaper? Increase the reach of your titles
YUMPU automatically turns print PDFs into web optimized ePapers that Google loves.
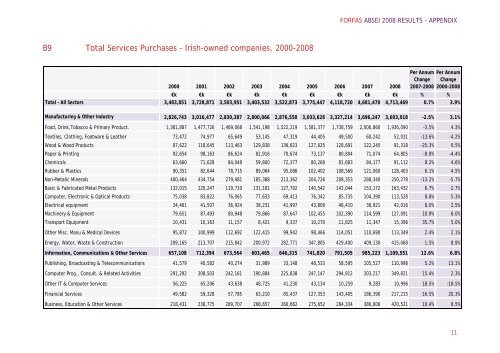
B9 Total Services Purchases – Irish-owned companies, 2000-<strong>2008</strong><br />
FORFÁS ABSEI <strong>2008</strong> RESULTS - APPENDIX<br />
Per Annum Per Annum<br />
Change Change<br />
2000 2001 2002 2003 2004 2005 2006 2007 <strong>2008</strong> 2007-<strong>2008</strong> 2000-<strong>2008</strong><br />
€k €k €k €k €k €k €k €k €k % %<br />
Total - All Sectors 3,483,851 3,728,871 3,503,951 3,403,532 3,522,873 3,775,447 4,118,720 4,681,470 4,713,469 0.7% 3.9%<br />
Manufacturing & Other Industry 2,826,743 3,016,477 2,830,387 2,800,066 2,876,558 3,033,628 3,327,214 3,696,247 3,603,918 -2.5% 3.1%<br />
Food, Drink,Tobacco & Primary Product. 1,381,887 1,477,726 1,469,068 1,541,198 1,522,219 1,581,377 1,738,759 2,006,860 1,936,090 -3.5% 4.3%<br />
Textiles, Clothing, Footware & Leather 73,472 74,977 65,649 53,145 47,319 44,405 49,500 60,242 52,031 -13.6% -4.2%<br />
Wood & Wood Products 87,622 118,645 113,463 129,838 136,623 127,625 128,691 122,245 91,318 -25.3% 0.5%<br />
Paper & Printing 92,654 98,163 86,624 82,916 70,674 73,137 80,804 71,074 64,805 -8.8% -4.4%<br />
Chemicals 63,660 71,628 84,048 59,800 72,377 80,268 81,683 84,177 91,112 8.2% 4.6%<br />
Rubber & Plastics 90,351 82,644 78,715 89,064 95,086 102,402 108,569 121,060 128,403 6.1% 4.5%<br />
Non-Metalic Minerals 400,464 434,754 279,481 185,388 213,362 204,726 208,353 288,340 250,278 -13.2% -5.7%<br />
Basic & Fabricated Metal Products 132,015 120,247 119,710 131,181 127,792 140,542 141,044 153,172 163,432 6.7% 2.7%<br />
Computer, Electronic & Optical Products 75,038 83,822 76,065 77,633 69,413 76,342 85,735 104,390 113,528 8.8% 5.3%<br />
Electrical equipment 34,461 41,507 36,924 38,231 41,997 43,808 46,410 38,921 42,016 8.0% 2.5%<br />
Machinery & Equipment 79,651 87,493 80,948 79,866 87,647 102,455 102,390 114,599 127,091 10.9% 6.0%<br />
Transport Equipment 10,431 10,163 11,157 8,421 9,337 10,270 11,825 11,347 15,396 35.7% 5.0%<br />
Other Misc. Manu & Medical Devices 95,872 100,999 112,692 122,415 99,942 98,466 114,051 110,690 113,349 2.4% 2.1%<br />
Energy, Water, Waste & Construction 209,165 213,707 215,842 200,972 282,771 347,805 429,400 409,130 415,068 1.5% 8.9%<br />
Information, Communications & Other Services 657,108 712,394 673,564 603,465 646,315 741,820 791,505 985,223 1,109,551 12.6% 6.8%<br />
Publishing, Broadcasting & Telecommunications 41,579 40,582 40,274 31,989 33,148 48,533 58,595 105,527 110,998 5.2% 13.1%<br />
Computer Prog., Consult. & Related Activities 291,292 308,503 242,161 190,884 225,838 247,147 294,912 303,217 349,821 15.4% 2.3%<br />
Other IT & Computer Services 56,225 65,206 43,638 48,725 41,230 43,134 10,259 9,283 10,996 18.5% -18.5%<br />
Financial Services 49,582 59,328 57,785 63,210 85,437 127,353 143,405 186,390 217,215 16.5% 20.3%<br />
Business, Education & Other Services 218,431 238,775 289,707 268,657 260,662 275,652 284,334 380,806 420,521 10.4% 8.5%<br />
11