annual business survey of economic impact 2008 appendix - Forfás
annual business survey of economic impact 2008 appendix - Forfás
annual business survey of economic impact 2008 appendix - Forfás

Create successful ePaper yourself
Turn your PDF publications into a flip-book with our unique Google optimized e-Paper software.
FORFÁS ABSEI <strong>2008</strong> RESULTS - APPENDIX<br />
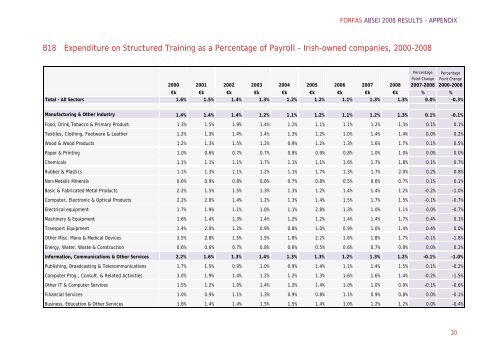
B18 Expenditure on Structured Training as a Percentage <strong>of</strong> Payroll - Irish-owned companies, 2000-<strong>2008</strong><br />
2000 2001 2002 2003 2004 2005 2006 2007 <strong>2008</strong><br />
Percentage<br />
Point Change<br />
2007-<strong>2008</strong><br />
Percentage<br />
Point Change<br />
2000-<strong>2008</strong><br />
€k €k €k €k €k €k €k €k €k % %<br />
Total - All Sectors 1.6% 1.5% 1.4% 1.3% 1.2% 1.2% 1.1% 1.3% 1.3% 0.0% -0.3%<br />
Manufacturing & Other Industry 1.4% 1.4% 1.4% 1.2% 1.1% 1.2% 1.1% 1.2% 1.3% 0.1% -0.1%<br />
Food, Drink,Tobacco & Primary Product. 1.3% 1.5% 1.9% 1.4% 1.2% 1.1% 1.1% 1.2% 1.3% 0.1% 0.1%<br />
Textiles, Clothing, Footware & Leather 1.2% 1.3% 1.4% 1.4% 1.3% 1.2% 1.0% 1.4% 1.4% 0.0% 0.2%<br />
Wood & Wood Products 1.2% 1.3% 1.5% 1.2% 0.9% 1.2% 1.3% 1.6% 1.7% 0.1% 0.5%<br />
Paper & Printing 1.0% 0.6% 0.7% 0.7% 0.8% 0.9% 0.8% 1.0% 1.0% 0.0% 0.0%<br />
Chemicals 1.1% 1.1% 1.1% 1.7% 1.1% 1.1% 1.6% 1.7% 1.8% 0.1% 0.7%<br />
Rubber & Plastics 1.1% 1.3% 1.1% 1.2% 1.1% 1.7% 1.3% 1.7% 2.0% 0.2% 0.8%<br />
Non-Metalic Minerals 0.6% 0.9% 0.8% 0.8% 0.7% 0.8% 0.5% 0.6% 0.7% 0.1% 0.1%<br />
Basic & Fabricated Metal Products 2.2% 1.5% 1.5% 1.3% 1.3% 1.2% 1.4% 1.4% 1.2% -0.2% -1.0%<br />
Computer, Electronic & Optical Products 2.2% 2.0% 1.4% 1.2% 1.3% 1.4% 1.5% 1.7% 1.5% -0.1% -0.7%<br />
Electrical equipment 1.7% 1.9% 1.1% 1.0% 1.1% 2.8% 1.3% 1.0% 1.1% 0.0% -0.7%<br />
Machinery & Equipment 1.6% 1.4% 1.3% 1.4% 1.2% 1.2% 1.4% 1.4% 1.7% 0.4% 0.1%<br />
Transport Equipment 1.4% 2.0% 1.2% 0.9% 0.8% 1.0% 0.9% 1.0% 1.4% 0.4% 0.0%<br />
Other Misc. Manu & Medical Devices 3.5% 2.8% 1.5% 1.5% 1.8% 2.2% 1.6% 1.8% 1.7% -0.1% -1.8%<br />
Energy, Water, Waste & Construction 0.6% 0.6% 0.7% 0.8% 0.6% 0.5% 0.6% 0.7% 0.8% 0.0% 0.2%<br />
Information, Communications & Other Services 2.2% 1.6% 1.3% 1.4% 1.3% 1.3% 1.2% 1.3% 1.2% -0.1% -1.0%<br />
Publishing, Broadcasting & Telecommunications 1.7% 1.5% 0.9% 1.0% 0.9% 1.4% 1.1% 1.4% 1.5% 0.1% -0.2%<br />
Computer Prog., Consult. & Related Activities 3.0% 1.9% 1.4% 1.2% 1.2% 1.3% 1.6% 1.6% 1.4% -0.2% -1.5%<br />
Other IT & Computer Services 1.5% 1.2% 1.0% 1.4% 1.2% 1.4% 1.0% 1.0% 0.9% -0.1% -0.6%<br />
Financial Services 1.0% 0.9% 1.1% 1.3% 0.9% 0.8% 1.1% 0.9% 0.8% 0.0% -0.1%<br />
Business, Education & Other Services 1.6% 1.4% 1.4% 1.5% 1.5% 1.4% 1.0% 1.2% 1.2% 0.0% -0.4%<br />
20