annual business survey of economic impact 2008 appendix - Forfás
annual business survey of economic impact 2008 appendix - Forfás
annual business survey of economic impact 2008 appendix - Forfás

Create successful ePaper yourself
Turn your PDF publications into a flip-book with our unique Google optimized e-Paper software.
FORFÁS ABSEI <strong>2008</strong> RESULTS - APPENDIX<br />
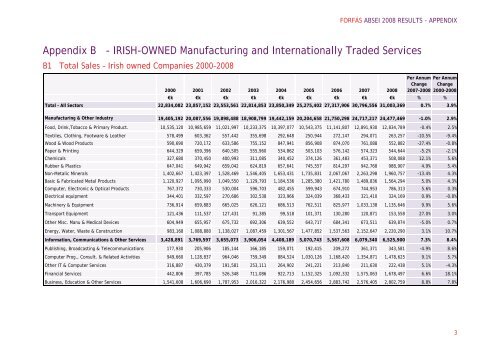
Appendix B - IRISH-OWNED Manufacturing and Internationally Traded Services<br />
B1 Total Sales – Irish owned Companies 2000-<strong>2008</strong><br />
Per Annum Per Annum<br />
Change Change<br />
2000 2001 2002 2003 2004 2005 2006 2007 <strong>2008</strong> 2007-<strong>2008</strong> 2000-<strong>2008</strong><br />
€k €k €k €k €k €k €k €k €k % %<br />
Total - All Sectors 22,834,082 23,857,152 23,553,561 22,814,853 23,850,349 25,275,402 27,317,906 30,796,556 31,003,369 0.7% 3.9%<br />
Manufacturing & Other Industry 19,405,192 20,087,556 19,898,488 18,908,799 19,442,159 20,204,658 21,750,298 24,717,217 24,477,469 -1.0% 2.9%<br />
Food, Drink,Tobacco & Primary Product. 10,535,120 10,985,659 11,021,997 10,233,375 10,397,077 10,543,375 11,141,807 12,891,930 12,834,789 -0.4% 2.5%<br />
Textiles, Clothing, Footware & Leather 578,499 603,362 557,442 355,698 292,648 250,944 272,147 294,071 263,257 -10.5% -9.4%<br />
Wood & Wood Products 590,690 720,172 633,586 755,152 847,941 856,908 874,070 761,088 552,882 -27.4% -0.8%<br />
Paper & Printing 644,329 659,396 640,505 555,960 534,862 503,103 576,142 574,323 544,644 -5.2% -2.1%<br />
Chemicals 327,680 370,450 400,993 311,085 340,452 374,126 361,483 453,371 508,088 12.1% 5.6%<br />
Rubber & Plastics 647,041 649,942 659,042 624,819 657,641 745,557 814,297 942,768 988,907 4.9% 5.4%<br />
Non-Metalic Minerals 1,402,667 1,423,397 1,528,469 1,546,405 1,653,431 1,735,831 2,067,067 2,263,298 1,960,757 -13.4% 4.3%<br />
Basic & Fabricated Metal Products 1,120,927 1,095,990 1,049,550 1,129,793 1,184,536 1,285,380 1,421,780 1,489,836 1,564,294 5.0% 4.3%<br />
Computer, Electronic & Optical Products 767,372 730,333 530,004 596,703 482,455 599,943 674,910 744,953 786,313 5.6% 0.3%<br />
Electrical equipment 344,401 332,597 270,686 302,538 323,966 324,039 368,433 321,410 324,169 0.9% -0.8%<br />
Machinery & Equipment 736,914 659,883 665,025 626,121 686,513 762,511 825,977 1,033,138 1,135,646 9.9% 5.6%<br />
Transport Equipment 121,436 111,537 127,431 91,385 99,518 101,371 130,280 120,871 153,558 27.0% 3.0%<br />
Other Misc. Manu & Medical Devices 604,949 655,957 675,732 692,306 639,552 643,717 684,341 673,511 639,874 -5.0% 0.7%<br />
Energy, Water, Waste & Construction 983,168 1,088,880 1,138,027 1,087,459 1,301,567 1,477,852 1,537,563 2,152,647 2,220,290 3.1% 10.7%<br />
Information, Communications & Other Services 3,428,891 3,769,597 3,655,073 3,906,054 4,408,189 5,070,743 5,567,608 6,079,340 6,525,900 7.3% 8.4%<br />
Publishing, Broadcasting & Telecommunications 177,930 205,906 185,144 166,185 159,071 192,415 209,272 361,371 343,581 -4.9% 8.6%<br />
Computer Prog., Consult. & Related Activities 949,660 1,128,837 964,046 759,349 884,524 1,030,126 1,168,420 1,354,871 1,478,625 9.1% 5.7%<br />
Other IT & Computer Services 316,887 430,379 191,581 253,111 264,902 241,221 213,840 211,630 222,438 5.1% -4.3%<br />
Financial Services 442,806 397,785 526,348 711,086 922,713 1,152,325 1,092,332 1,575,063 1,678,497 6.6% 18.1%<br />
Business, Education & Other Services 1,541,608 1,606,690 1,787,953 2,016,322 2,176,980 2,454,656 2,883,742 2,576,405 2,802,759 8.8% 7.8%<br />
3