annual business survey of economic impact 2008 appendix - Forfás
annual business survey of economic impact 2008 appendix - Forfás
annual business survey of economic impact 2008 appendix - Forfás

Create successful ePaper yourself
Turn your PDF publications into a flip-book with our unique Google optimized e-Paper software.
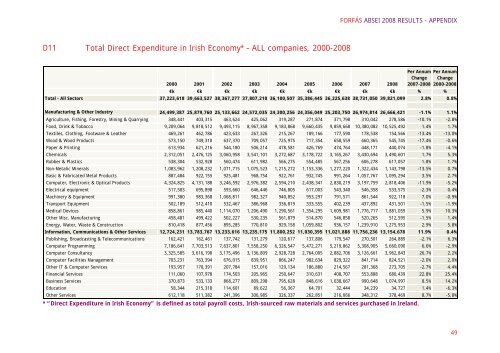
D11 Total Direct Expenditure in Irish Economy* – ALL companies, 2000-<strong>2008</strong><br />
FORFÁS ABSEI <strong>2008</strong> RESULTS - APPENDIX<br />
Per Annum Per Annum<br />
Change Change<br />
2000 2001 2002 2003 2004 2005 2006 2007 <strong>2008</strong> 2007-<strong>2008</strong> 2000-<strong>2008</strong><br />
€k €k €k €k €k €k €k €k €k % %<br />
Total - All Sectors 37,223,618 39,663,527 38,367,277 37,807,210 36,100,507 35,386,445 36,225,638 38,731,050 39,821,099 2.8% 0.8%<br />
Manufacturing & Other Industry 24,499,387 25,879,760 25,133,662 24,572,035 24,300,256 24,356,049 25,203,750 26,974,814 26,666,421 -1.1% 1.1%<br />
Agriculture, Fishing, Forestry, Mining & Quarrying 348,441 403,315 463,624 425,062 319,287 271,874 371,798 310,042 278,586 -10.1% -2.8%<br />
Food, Drink & Tobacco 9,209,064 9,818,512 9,493,115 8,967,358 9,183,868 9,660,435 9,859,668 10,380,082 10,525,492 1.4% 1.7%<br />
Textiles, Clothing, Footware & Leather 469,261 462,786 423,633 267,326 215,267 189,166 177,590 178,538 154,566 -13.4% -13.0%<br />
Wood & Wood Products 573,150 749,310 637,370 709,057 725,975 717,354 658,559 660,365 545,745 -17.4% -0.6%<br />
Paper & Printing 613,934 621,216 544,180 506,214 478,581 426,769 474,764 448,171 440,074 -1.8% -4.1%<br />
Chemicals 2,312,051 2,476,125 3,060,958 3,541,101 3,272,687 3,178,722 3,165,267 3,430,694 3,490,601 1.7% 5.3%<br />
Rubber & Plastics 538,304 532,928 560,474 611,982 566,275 554,485 567,256 606,278 617,057 1.8% 1.7%<br />
Non-Metalic Minerals 1,083,962 1,208,232 1,071,715 1,075,523 1,215,272 1,153,336 1,277,220 1,322,434 1,143,798 -13.5% 0.7%<br />
Basic & Fabricated Metal Products 887,484 922,155 925,481 968,754 922,761 932,745 991,264 1,057,767 1,095,294 3.5% 2.7%<br />
Computer, Electronic & Optical Products 4,324,825 4,131,188 3,246,592 2,976,382 2,594,210 2,438,341 2,830,219 3,197,759 2,818,406 -11.9% -5.2%<br />
Electrical equipment 517,583 695,898 593,660 646,446 746,805 617,003 543,340 546,358 533,575 -2.3% 0.4%<br />
Machinery & Equipment 991,380 983,368 1,068,811 982,327 940,852 953,297 791,571 861,544 922,118 7.0% -0.9%<br />
Transport Equipment 502,189 512,410 532,467 386,968 336,819 333,555 402,239 437,892 431,501 -1.5% -1.9%<br />
Medical Devices 858,861 985,440 1,114,070 1,206,490 1,290,561 1,354,295 1,609,981 1,776,717 1,881,059 5.9% 10.3%<br />
Other Misc. Manufacturing 458,481 499,422 502,227 530,235 561,879 514,870 546,858 520,265 512,595 -1.5% 1.4%<br />
Energy, Water, Waste & Construction 810,418 877,456 895,285 770,810 929,158 1,059,802 936,157 1,239,910 1,275,953 2.9% 5.8%<br />
Information, Communications & Other Services 12,724,231 13,783,767 13,233,616 13,235,175 11,800,252 11,030,395 11,021,888 11,756,236 13,154,678 11.9% 0.4%<br />
Publishing, Broadcasting & Telecommunications 162,421 162,461 137,742 131,279 120,617 137,806 179,547 270,501 264,889 -2.1% 6.3%<br />
Computer Programming 7,186,641 7,703,513 7,637,801 7,558,250 6,326,547 5,472,271 5,219,862 5,308,905 5,660,090 6.6% -2.9%<br />
Computer Consultancy 3,325,585 3,616,198 3,175,496 3,136,809 2,928,728 2,764,005 2,882,706 3,126,661 3,962,843 26.7% 2.2%<br />
Computer Facilities Management 703,231 763,394 676,015 839,951 866,247 982,634 829,322 841,714 824,521 -2.0% 2.0%<br />
Other IT & Computer Services 193,957 170,391 207,784 157,016 129,134 186,880 214,567 281,368 273,705 -2.7% 4.4%<br />
Financial Services 111,060 107,978 174,503 205,965 250,647 310,631 408,707 553,888 680,439 22.8% 25.4%<br />
Business Services 370,873 533,133 868,277 809,298 795,628 848,616 1,038,667 990,648 1,074,997 8.5% 14.2%<br />
Education 58,344 215,318 114,601 89,622 56,367 64,701 32,444 34,239 34,727 1.4% -6.3%<br />
Other Services 612,118 511,382 241,396 306,985 326,337 262,851 216,066 348,312 378,469 8.7% -5.8%<br />
* “Direct Expenditure in Irish Economy” is defined as total payroll costs, Irish-sourced raw materials and services purchased in Ireland.<br />
49