annual business survey of economic impact 2008 appendix - Forfás
annual business survey of economic impact 2008 appendix - Forfás
annual business survey of economic impact 2008 appendix - Forfás

You also want an ePaper? Increase the reach of your titles
YUMPU automatically turns print PDFs into web optimized ePapers that Google loves.
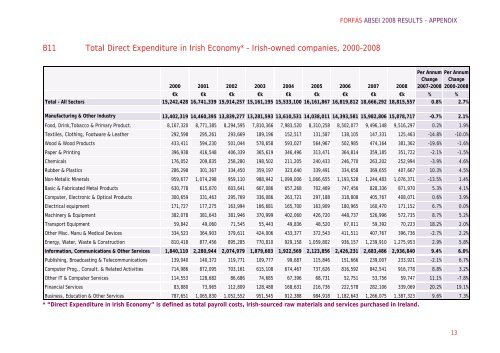
B11 Total Direct Expenditure in Irish Economy* – Irish-owned companies, 2000-<strong>2008</strong><br />
FORFÁS ABSEI <strong>2008</strong> RESULTS - APPENDIX<br />
2000 2001 2002 2003 2004 2005 2006 2007 <strong>2008</strong><br />
Per Annum<br />
Change<br />
2007-<strong>2008</strong><br />
Per Annum<br />
Change<br />
2000-<strong>2008</strong><br />
€k €k €k €k €k €k €k €k €k % %<br />
Total - All Sectors 15,242,428 16,741,339 15,914,257 15,161,195 15,533,100 16,161,867 16,819,812 18,666,292 18,815,557 0.8% 2.7%<br />
Manufacturing & Other Industry 13,402,319 14,460,395 13,839,277 13,281,593 13,610,531 14,038,011 14,393,581 15,982,806 15,878,717 -0.7% 2.1%<br />
Food, Drink,Tobacco & Primary Product. 8,167,320 8,771,385 8,294,595 7,810,366 7,983,520 8,310,258 8,502,077 9,496,148 9,516,297 0.2% 1.9%<br />
Textiles, Clothing, Footware & Leather 292,598 295,261 293,669 189,196 152,517 131,587 138,105 147,331 125,463 -14.8% -10.0%<br />
Wood & Wood Products 433,411 594,230 501,044 578,658 593,027 564,967 502,985 474,164 381,362 -19.6% -1.6%<br />
Paper & Printing 396,938 416,548 406,339 365,619 346,496 313,471 364,814 359,185 351,722 -2.1% -1.5%<br />
Chemicals 176,052 209,835 258,280 198,502 211,205 240,433 246,770 263,202 252,994 -3.9% 4.6%<br />
Rubber & Plastics 286,298 301,367 334,450 359,197 323,640 339,491 334,658 369,655 407,667 10.3% 4.5%<br />
Non-Metalic Minerals 959,677 1,074,298 959,110 988,942 1,099,006 1,066,655 1,193,528 1,244,483 1,076,371 -13.5% 1.4%<br />
Basic & Fabricated Metal Products 630,778 615,670 603,641 667,086 657,268 702,469 747,456 828,336 871,970 5.3% 4.1%<br />
Computer, Electronic & Optical Products 300,659 331,463 295,769 336,086 263,721 297,188 318,808 405,767 408,071 0.6% 3.9%<br />
Electrical equipment 171,727 177,275 163,994 166,681 165,700 163,909 180,965 160,470 171,152 6.7% 0.0%<br />
Machinery & Equipment 382,078 381,643 381,946 370,999 402,060 426,720 448,737 526,996 572,735 8.7% 5.2%<br />
Transport Equipment 59,842 49,060 71,545 55,443 49,836 48,520 67,011 59,392 70,223 18.2% 2.0%<br />
Other Misc. Manu & Medical Devices 334,523 364,903 379,611 424,006 433,377 372,543 411,511 407,767 396,736 -2.7% 2.2%<br />
Energy, Water, Waste & Construction 810,418 877,456 895,285 770,810 929,158 1,059,802 936,157 1,239,910 1,275,953 2.9% 5.8%<br />
Information, Communications & Other Services 1,840,110 2,280,944 2,074,979 1,879,603 1,922,569 2,123,856 2,426,231 2,683,486 2,936,840 9.4% 6.0%<br />
Publishing, Broadcasting & Telecommunications 139,040 140,372 119,771 109,777 99,687 115,846 151,666 239,007 233,921 -2.1% 6.7%<br />
Computer Prog., Consult. & Related Activities 714,986 872,095 703,161 615,108 674,467 737,626 816,592 842,541 916,778 8.8% 3.2%<br />
Other IT & Computer Services 114,553 128,682 86,686 74,685 67,396 68,731 52,751 53,756 59,747 11.1% -7.8%<br />
Financial Services 83,880 73,965 112,809 128,488 168,631 216,736 222,578 282,106 339,069 20.2% 19.1%<br />
Business, Education & Other Services 787,651 1,065,830 1,052,552 951,545 912,388 984,918 1,182,643 1,266,075 1,387,323 9.6% 7.3%<br />
* “Direct Expenditure in Irish Economy” is defined as total payroll costs, Irish-sourced raw materials and services purchased in Ireland.<br />
13