annual business survey of economic impact 2008 appendix - Forfás
annual business survey of economic impact 2008 appendix - Forfás
annual business survey of economic impact 2008 appendix - Forfás

Create successful ePaper yourself
Turn your PDF publications into a flip-book with our unique Google optimized e-Paper software.
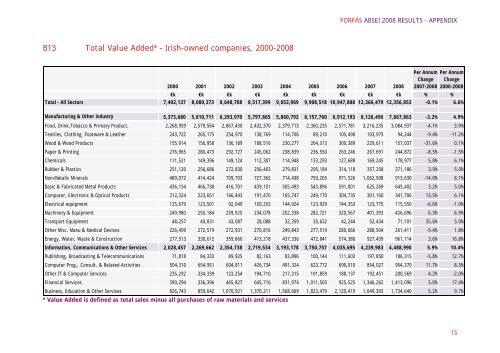
B13 Total Value Added* – Irish-owned companies, 2000-<strong>2008</strong><br />
FORFÁS ABSEI <strong>2008</strong> RESULTS - APPENDIX<br />
Per Annum Per Annum<br />
Change Change<br />
2000 2001 2002 2003 2004 2005 2006 2007 <strong>2008</strong> 2007-<strong>2008</strong> 2000-<strong>2008</strong><br />
€k €k €k €k €k €k €k €k €k % %<br />
Total - All Sectors 7,402,137 8,080,373 8,648,708 8,517,399 9,053,969 9,908,518 10,947,888 12,366,479 12,356,853 -0.1% 6.6%<br />
Manufacturing & Other Industry 5,373,680 5,810,711 6,293,970 5,797,865 5,860,792 6,157,760 6,912,193 8,126,496 7,867,863 -3.2% 4.9%<br />
Food, Drink,Tobacco & Primary Product. 2,268,959 2,579,564 2,867,430 2,432,370 2,379,713 2,360,235 2,571,781 3,216,235 3,084,937 -4.1% 3.9%<br />
Textiles, Clothing, Footware & Leather 243,722 265,175 254,970 138,769 114,706 89,210 105,498 103,975 94,244 -9.4% -11.2%<br />
Wood & Wood Products 155,914 156,958 136,189 188,516 230,277 264,313 300,389 229,611 157,037 -31.6% 0.1%<br />
Paper & Printing 276,965 280,473 292,727 245,062 238,839 236,550 263,246 267,691 244,872 -8.5% -1.5%<br />
Chemicals 111,521 149,396 149,124 112,307 114,948 133,293 127,689 169,245 178,977 5.8% 6.1%<br />
Rubber & Plastics 251,120 256,686 272,830 256,403 279,831 295,184 314,118 357,258 371,186 3.9% 5.0%<br />
Non-Metalic Minerals 489,072 414,424 709,703 727,362 714,438 793,265 971,526 1,062,508 913,630 -14.0% 8.1%<br />
Basic & Fabricated Metal Products 436,154 466,738 416,701 439,151 505,493 543,896 591,001 625,269 645,402 3.2% 5.0%<br />
Computer, Electronic & Optical Products 212,324 223,651 166,443 191,470 165,747 249,170 304,735 301,160 341,706 13.5% 6.1%<br />
Electrical equipment 125,679 123,501 92,049 120,253 144,924 123,929 144,353 123,775 115,550 -6.6% -1.0%<br />
Machinery & Equipment 249,980 250,184 259,925 234,078 252,338 282,721 320,567 401,393 426,696 6.3% 6.9%<br />
Transport Equipment 48,257 40,831 43,087 28,088 32,359 35,632 42,244 52,434 71,101 35.6% 5.0%<br />
Other Misc. Manu & Medical Devices 226,499 272,519 272,931 270,816 249,843 277,519 280,666 288,504 261,411 -9.4% 1.8%<br />
Energy, Water, Waste & Construction 277,513 330,612 359,860 413,218 437,336 472,841 574,380 927,439 961,114 3.6% 16.8%<br />
Information, Communications & Other Services 2,028,457 2,269,662 2,354,738 2,719,534 3,193,178 3,750,757 4,035,695 4,239,983 4,488,990 5.9% 10.4%<br />
Publishing, Broadcasting & Telecommunications 71,818 84,333 89,925 82,163 83,896 100,144 111,603 197,850 186,315 -5.8% 12.7%<br />
Computer Prog., Consult. & Related Activities 504,310 654,951 604,811 426,734 491,324 623,772 690,010 854,027 954,370 11.7% 8.3%<br />
Other IT & Computer Services 235,292 334,339 123,254 194,710 217,315 191,859 188,137 192,451 200,569 4.2% -2.0%<br />
Financial Services 390,294 336,396 465,827 645,716 831,974 1,011,503 925,525 1,346,262 1,413,096 5.0% 17.4%<br />
Business, Education & Other Services 826,743 859,642 1,070,921 1,370,211 1,568,669 1,823,479 2,120,419 1,649,393 1,734,640 5.2% 9.7%<br />
* Value Added is defined as total sales minus all purchases <strong>of</strong> raw materials and services<br />
15