annual business survey of economic impact 2008 appendix - Forfás
annual business survey of economic impact 2008 appendix - Forfás
annual business survey of economic impact 2008 appendix - Forfás

Create successful ePaper yourself
Turn your PDF publications into a flip-book with our unique Google optimized e-Paper software.
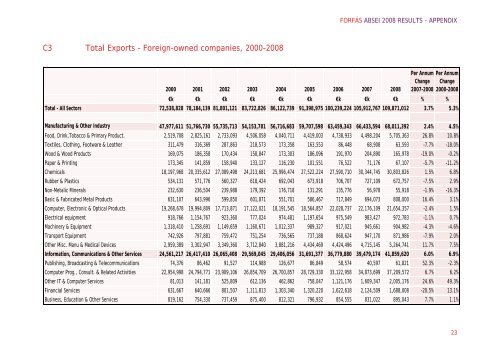
C3 Total Exports – Foreign-owned companies, 2000-<strong>2008</strong><br />
FORFÁS ABSEI <strong>2008</strong> RESULTS - APPENDIX<br />
Per Annum Per Annum<br />
Change Change<br />
2000 2001 2002 2003 2004 2005 2006 2007 <strong>2008</strong> 2007-<strong>2008</strong> 2000-<strong>2008</strong><br />
€k €k €k €k €k €k €k €k €k % %<br />
Total - All Sectors 72,538,828 78,184,139 81,801,121 83,722,826 86,122,739 91,398,975 100,239,224 105,912,767 109,871,012 3.7% 5.3%<br />
Manufacturing & Other Industry 47,977,611 51,766,730 55,735,713 54,153,781 56,716,683 59,707,598 63,459,343 66,433,594 68,011,392 2.4% 4.5%<br />
Food, Drink,Tobacco & Primary Product. 2,519,708 2,825,161 2,733,093 4,506,058 4,040,711 4,419,003 4,738,933 4,498,204 5,705,363 26.8% 10.8%<br />
Textiles, Clothing, Footware & Leather 311,479 316,369 287,863 218,573 173,358 163,553 86,448 68,908 63,593 -7.7% -18.0%<br />
Wood & Wood Products 169,075 186,358 170,434 158,847 173,303 186,096 191,970 204,890 165,978 -19.0% -0.2%<br />
Paper & Printing 173,345 141,859 158,940 133,127 116,230 101,551 76,522 71,176 67,107 -5.7% -11.2%<br />
Chemicals 18,197,968 20,335,612 27,089,498 24,213,681 25,996,474 27,522,224 27,590,710 30,344,745 30,803,826 1.5% 6.8%<br />
Rubber & Plastics 534,131 571,776 560,327 618,424 692,043 673,918 706,707 727,109 672,757 -7.5% 2.9%<br />
Non-Metalic Minerals 232,630 236,504 239,988 179,392 176,718 131,291 135,776 56,978 55,918 -1.9% -16.3%<br />
Basic & Fabricated Metal Products 631,107 643,996 599,850 601,871 551,701 586,467 717,849 694,073 808,000 16.4% 3.1%<br />
Computer, Electronic & Optical Products 19,268,678 19,994,809 17,713,871 17,122,021 18,191,545 18,564,857 22,028,737 22,176,109 21,654,357 -2.4% 1.5%<br />
Electrical equipment 918,766 1,154,767 923,360 777,024 974,481 1,197,654 975,549 983,427 972,783 -1.1% 0.7%<br />
Machinery & Equipment 1,318,410 1,258,691 1,149,659 1,160,671 1,012,337 989,327 917,021 945,661 904,982 -4.3% -4.6%<br />
Transport Equipment 742,926 797,881 759,472 751,254 736,565 737,188 868,624 947,170 871,986 -7.9% 2.0%<br />
Other Misc. Manu & Medical Devices 2,959,389 3,302,947 3,349,360 3,712,840 3,881,216 4,434,469 4,424,496 4,715,145 5,264,741 11.7% 7.5%<br />
Information, Communications & Other Services 24,561,217 26,417,410 26,065,408 29,569,045 29,406,056 31,691,377 36,779,880 39,479,174 41,859,620 6.0% 6.9%<br />
Publishing, Broadcasting & Telecommunications 74,376 86,462 91,527 114,988 126,677 86,849 58,574 40,597 61,821 52.3% -2.3%<br />
Computer Prog., Consult. & Related Activities 22,954,998 24,794,771 23,909,106 26,854,709 26,700,857 28,729,330 33,122,958 34,873,699 37,209,572 6.7% 6.2%<br />
Other IT & Computer Services 81,013 141,181 525,809 612,136 462,862 758,047 1,121,176 1,609,347 2,005,176 24.6% 49.3%<br />
Financial Services 631,667 640,666 801,507 1,111,813 1,303,340 1,320,220 1,622,618 2,124,509 1,688,008 -20.5% 13.1%<br />
Business, Education & Other Services 819,162 754,330 737,459 875,400 812,321 796,932 854,555 831,022 895,043 7.7% 1.1%<br />
23