
Create successful ePaper yourself
Turn your PDF publications into a flip-book with our unique Google optimized e-Paper software.
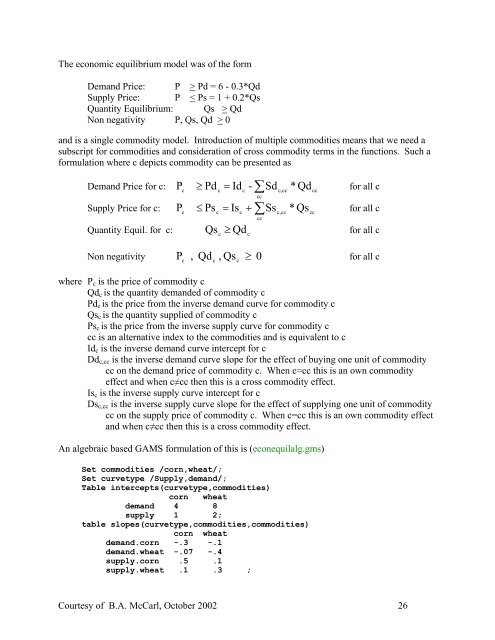
The economic equilibrium model was of the form<br />
Demand Price: P > Pd = 6 - 0.3*Qd<br />
Supply Price: P < Ps = 1 + 0.2*Qs<br />
Quantity Equilibrium: Qs > Qd<br />
Non negativity P, Qs, Qd > 0<br />
and is a single commodity model. Introduction of multiple commodities means that we need a<br />
subscript for commodities and consideration of cross commodity terms in the functions. Such a<br />
formulation where c depicts commodity can be presented as<br />
Demand Price for c: Pc ≥ Pd c = Idc<br />
- ∑Sd<br />
c, cc * Qd cc for all c<br />
Supply Price for c: Pc ≤ Ps c = Isc<br />
+ ∑Ss<br />
c, cc * Qscc<br />
for all c<br />
Qsc ≥ Qd c<br />
Quantity Equil. for c: for all c<br />
Pc , Qd c , Qsc<br />
Non negativity for all c<br />
≥<br />
where Pc is the price of commodity c<br />
Qdc is the quantity demanded of commodity c<br />
Pdc is the price from the inverse demand curve for commodity c<br />
Qsc is the quantity supplied of commodity c<br />
Psc is the price from the inverse supply curve for commodity c<br />
cc is an alternative index to the commodities and is equivalent to c<br />
Idc is the inverse demand curve intercept for c<br />
Ddc,cc is the inverse demand curve slope for the effect of buying one unit of commodity<br />
cc on the demand price of commodity c. When c=cc this is an own commodity<br />
effect and when c≠cc then this is a cross commodity effect.<br />
Isc is the inverse supply curve intercept for c<br />
Dsc,cc is the inverse supply curve slope for the effect of supplying one unit of commodity<br />
cc on the supply price of commodity c. When c=cc this is an own commodity effect<br />
and when c≠cc then this is a cross commodity effect.<br />
An algebraic based GAMS formulation of this is (econequilalg.gms)<br />
Set commodities /corn,wheat/;<br />
Set curvetype /Supply,demand/;<br />
Table intercepts(curvetype,commodities)<br />
corn wheat<br />
demand 4 8<br />
supply 1 2;<br />
table slopes(curvetype,commodities,commodities)<br />
corn wheat<br />
demand.corn -.3 -.1<br />
demand.wheat -.07 -.4<br />
supply.corn .5 .1<br />
supply.wheat .1 .3 ;<br />
Courtesy of B.A. McCarl, October 2002 26<br />
cc<br />
cc<br />
0