

Bachelor Thesis - Christina Kuenen - Hufpfleger
Bachelor Thesis - Christina Kuenen - Hufpfleger
Bachelor Thesis - Christina Kuenen - Hufpfleger

Create successful ePaper yourself
Turn your PDF publications into a flip-book with our unique Google optimized e-Paper software.
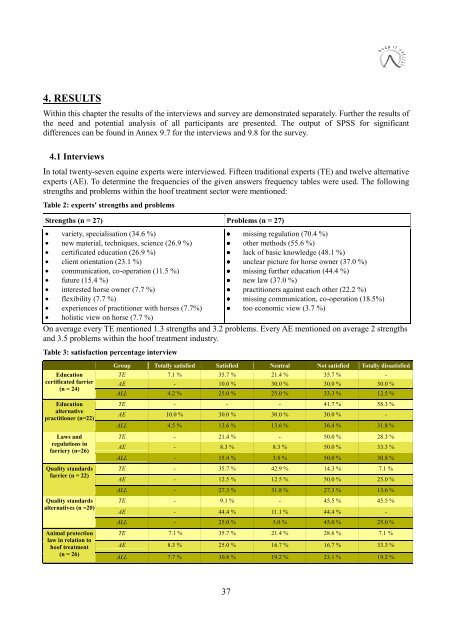
4. RESULTS<br />
Within this chapter the results of the interviews and survey are demonstrated separately. Further the results of<br />
the need and potential analysis of all participants are presented. The output of SPSS for significant<br />
differences can be found in Annex 9.7 for the interviews and 9.8 for the survey.<br />
4.1 Interviews<br />
In total twenty-seven equine experts were interviewed. Fifteen traditional experts (TE) and twelve alternative<br />
experts (AE). To determine the frequencies of the given answers frequency tables were used. The following<br />
strengths and problems within the hoof treatment sector were mentioned:<br />
Table 2: experts' strengths and problems<br />
Strengths (n = 27) Problems (n = 27)<br />
• variety, specialisation (34.6 %)<br />
• new material, techniques, science (26.9 %)<br />
• certificated education (26.9 %)<br />
• client orientation (23.1 %)<br />
• communication, co-operation (11.5 %)<br />
• future (15.4 %)<br />
• interested horse owner (7.7 %)<br />
• flexibility (7.7 %)<br />
• experiences of practitioner with horses (7.7%)<br />
• holistic view on horse (7.7 %)<br />
• missing regulation (70.4 %)<br />
• other methods (55.6 %)<br />
• lack of basic knowledge (48.1 %)<br />
• unclear picture for horse owner (37.0 %)<br />
• missing further education (44.4 %)<br />
• new law (37.0 %)<br />
• practitioners against each other (22.2 %)<br />
• missing communication, co-operation (18.5%)<br />
• too economic view (3.7 %)<br />
On average every TE mentioned 1.3 strengths and 3.2 problems. Every AE mentioned on average 2 strengths<br />
and 3.5 problems within the hoof treatment industry.<br />
Table 3: satisfaction percentage interview<br />
Education<br />
certificated farrier<br />
(n = 24)<br />
Education<br />
alternative<br />
practitioner (n=22)<br />
Laws and<br />
regulations in<br />
farriery (n=26)<br />
Quality standards<br />
farrier (n = 22)<br />
Quality standards<br />
alternatives (n =20)<br />
Animal protection<br />
law in relation to<br />
hoof treatment<br />
(n = 26)<br />
Group Totally satisfied Satisfied Neutral Not satisfied Totally dissatisfied<br />
TE 7.1 % 35.7 % 21.4 % 35.7 % -<br />
AE - 10.0 % 30.0 % 30.0 % 30.0 %<br />
ALL 4.2 % 25.0 % 25.0 % 33.3 % 12.5 %<br />
TE - - - 41.7 % 58.3 %<br />
AE 10.0 % 30.0 % 30.0 % 30.0 % -<br />
ALL 4.5 % 13.6 % 13.6 % 36.4 % 31.8 %<br />
TE - 21.4 % - 50.0 % 28.3 %<br />
AE - 8.3 % 8.3 % 50.0 % 33.3 %<br />
ALL - 15.4 % 3.8 % 50.0 % 30.8 %<br />
TE - 35.7 % 42.9 % 14.3 % 7.1 %<br />
AE - 12.5 % 12.5 % 50.0 % 25.0 %<br />
ALL - 27.3 % 31.8 % 27.3 % 13.6 %<br />
TE - 9.1 % - 45.5 % 45.5 %<br />
AE - 44.4 % 11.1 % 44.4 % -<br />
ALL - 25.0 % 5.0 % 45.0 % 25.0 %<br />
TE 7.1 % 35.7 % 21.4 % 28.6 % 7.1 %<br />
AE 8.3 % 25.0 % 16.7 % 16.7 % 33.3 %<br />
ALL 7.7 % 30.8 % 19.2 % 23.1 % 19.2 %<br />
37