

Bachelor Thesis - Christina Kuenen - Hufpfleger
Bachelor Thesis - Christina Kuenen - Hufpfleger
Bachelor Thesis - Christina Kuenen - Hufpfleger

You also want an ePaper? Increase the reach of your titles
YUMPU automatically turns print PDFs into web optimized ePapers that Google loves.
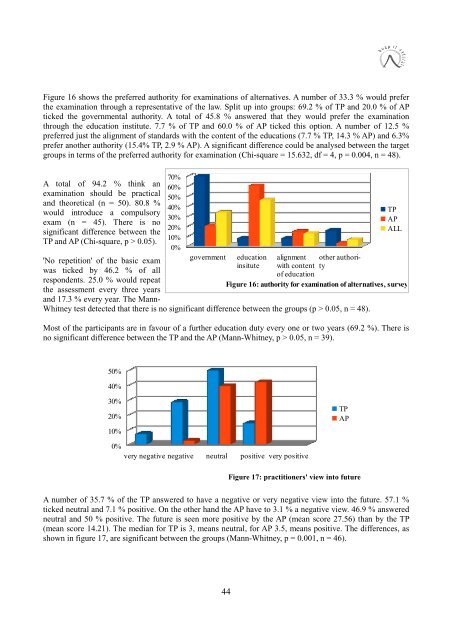
Figure 16 shows the preferred authority for examinations of alternatives. A number of 33.3 % would prefer<br />
the examination through a representative of the law. Split up into groups: 69.2 % of TP and 20.0 % of AP<br />
ticked the governmental authority. A total of 45.8 % answered that they would prefer the examination<br />
through the education institute. 7.7 % of TP and 60.0 % of AP ticked this option. A number of 12.5 %<br />
preferred just the alignment of standards with the content of the educations (7.7 % TP, 14.3 % AP) and 6.3%<br />
prefer another authority (15.4% TP, 2.9 % AP). A significant difference could be analysed between the target<br />
groups in terms of the preferred authority for examination (Chi-square = 15.632, df = 4, p = 0.004, n = 48).<br />
A total of 94.2 % think an<br />
examination should be practical<br />
and theoretical (n = 50). 80.8 %<br />
would introduce a compulsory<br />
exam (n = 45). There is no<br />
significant difference between the<br />
TP and AP (Chi-square, p > 0.05).<br />
70%<br />
60%<br />
50%<br />
40%<br />
30%<br />
20%<br />
10%<br />
0%<br />
'No repetition' of the basic exam<br />
government education alignment other authority<br />
insitute with content<br />
was ticked by 46.2 % of all<br />
of education<br />
respondents. 25.0 % would repeat<br />
Figure 16: authority for examination of alternatives, survey<br />
the assessment every three years<br />
and 17.3 % every year. The Mann-<br />
Whitney test detected that there is no significant difference between the groups (p > 0.05, n = 48).<br />
Most of the participants are in favour of a further education duty every one or two years (69.2 %). There is<br />
no significant difference between the TP and the AP (Mann-Whitney, p > 0.05, n = 39).<br />
TP<br />
AP<br />
ALL<br />
50%<br />
40%<br />
30%<br />
20%<br />
10%<br />
TP<br />
AP<br />
0%<br />
very negative negative neutral positive very positive<br />
Figure 17: practitioners' view into future<br />
A number of 35.7 % of the TP answered to have a negative or very negative view into the future. 57.1 %<br />
ticked neutral and 7.1 % positive. On the other hand the AP have to 3.1 % a negative view. 46.9 % answered<br />
neutral and 50 % positive. The future is seen more positive by the AP (mean score 27.56) than by the TP<br />
(mean score 14.21). The median for TP is 3, means neutral, for AP 3.5, means positive. The differences, as<br />
shown in figure 17, are significant between the groups (Mann-Whitney, p = 0.001, n = 46).<br />
44