Rivet: A Flexible Environment for Computer Systems Visualization
Rivet: A Flexible Environment for Computer Systems Visualization
Rivet: A Flexible Environment for Computer Systems Visualization

You also want an ePaper? Increase the reach of your titles
YUMPU automatically turns print PDFs into web optimized ePapers that Google loves.
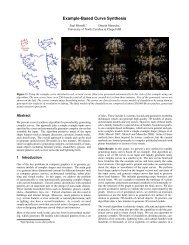
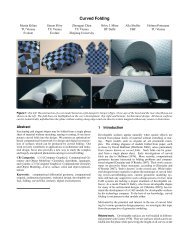
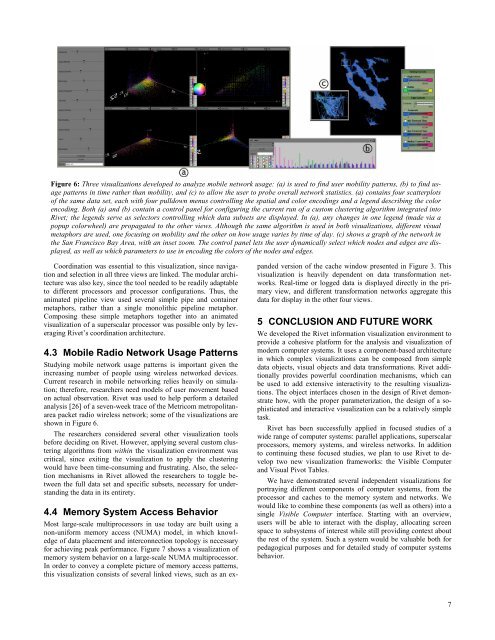
Figure 6: Three visualizations developed to analyze mobile network usage: (a) is used to find user mobility patterns, (b) to find usage<br />
patterns in time rather than mobility, and (c) to allow the user to probe overall network statistics. (a) contains four scatterplots<br />
of the same data set, each with four pulldown menus controlling the spatial and color encodings and a legend describing the color<br />
encoding. Both (a) and (b) contain a control panel <strong>for</strong> configuring the current run of a custom clustering algorithm integrated into<br />
<strong>Rivet</strong>; the legends serve as selectors controlling which data subsets are displayed. In (a), any changes in one legend (made via a<br />
popup colorwheel) are propagated to the other views. Although the same algorithm is used in both visualizations, different visual<br />
metaphors are used, one focusing on mobility and the other on how usage varies by time of day. (c) shows a graph of the network in<br />
the San Francisco Bay Area, with an inset zoom. The control panel lets the user dynamically select which nodes and edges are displayed,<br />
as well as which parameters to use in encoding the colors of the nodes and edges.<br />
Coordination was essential to this visualization, since navigation<br />
and selection in all three views are linked. The modular architecture<br />
was also key, since the tool needed to be readily adaptable<br />
to different processors and processor configurations. Thus, the<br />
animated pipeline view used several simple pipe and container<br />
metaphors, rather than a single monolithic pipeline metaphor.<br />
Composing these simple metaphors together into an animated<br />
visualization of a superscalar processor was possible only by leveraging<br />
<strong>Rivet</strong>’s coordination architecture.<br />
4.3 Mobile Radio Network Usage Patterns<br />
Studying mobile network usage patterns is important given the<br />
increasing number of people using wireless networked devices.<br />
Current research in mobile networking relies heavily on simulation;<br />
there<strong>for</strong>e, researchers need models of user movement based<br />
on actual observation. <strong>Rivet</strong> was used to help per<strong>for</strong>m a detailed<br />
analysis [26] of a seven-week trace of the Metricom metropolitanarea<br />
packet radio wireless network; some of the visualizations are<br />
shown in Figure 6.<br />
The researchers considered several other visualization tools<br />
be<strong>for</strong>e deciding on <strong>Rivet</strong>. However, applying several custom clustering<br />
algorithms from within the visualization environment was<br />
critical, since exiting the visualization to apply the clustering<br />
would have been time-consuming and frustrating. Also, the selection<br />
mechanisms in <strong>Rivet</strong> allowed the researchers to toggle between<br />
the full data set and specific subsets, necessary <strong>for</strong> understanding<br />
the data in its entirety.<br />
4.4 Memory System Access Behavior<br />
Most large-scale multiprocessors in use today are built using a<br />
non-uni<strong>for</strong>m memory access (NUMA) model, in which knowledge<br />
of data placement and interconnection topology is necessary<br />
<strong>for</strong> achieving peak per<strong>for</strong>mance. Figure 7 shows a visualization of<br />
memory system behavior on a large-scale NUMA multiprocessor.<br />
In order to convey a complete picture of memory access patterns,<br />
this visualization consists of several linked views, such as an expanded<br />
version of the cache window presented in Figure 3. This<br />
visualization is heavily dependent on data trans<strong>for</strong>mation networks.<br />
Real-time or logged data is displayed directly in the primary<br />
view, and different trans<strong>for</strong>mation networks aggregate this<br />
data <strong>for</strong> display in the other four views.<br />
5 CONCLUSION AND FUTURE WORK<br />
We developed the <strong>Rivet</strong> in<strong>for</strong>mation visualization environment to<br />
provide a cohesive plat<strong>for</strong>m <strong>for</strong> the analysis and visualization of<br />
modern computer systems. It uses a component-based architecture<br />
in which complex visualizations can be composed from simple<br />
data objects, visual objects and data trans<strong>for</strong>mations. <strong>Rivet</strong> additionally<br />
provides powerful coordination mechanisms, which can<br />
be used to add extensive interactivity to the resulting visualizations.<br />
The object interfaces chosen in the design of <strong>Rivet</strong> demonstrate<br />
how, with the proper parameterization, the design of a sophisticated<br />
and interactive visualization can be a relatively simple<br />
task.<br />
<strong>Rivet</strong> has been successfully applied in focused studies of a<br />
wide range of computer systems: parallel applications, superscalar<br />
processors, memory systems, and wireless networks. In addition<br />
to continuing these focused studies, we plan to use <strong>Rivet</strong> to develop<br />
two new visualization frameworks: the Visible <strong>Computer</strong><br />
and Visual Pivot Tables.<br />
We have demonstrated several independent visualizations <strong>for</strong><br />
portraying different components of computer systems, from the<br />
processor and caches to the memory system and networks. We<br />
would like to combine these components (as well as others) into a<br />
single Visible <strong>Computer</strong> interface. Starting with an overview,<br />
users will be able to interact with the display, allocating screen<br />
space to subsystems of interest while still providing context about<br />
the rest of the system. Such a system would be valuable both <strong>for</strong><br />
pedagogical purposes and <strong>for</strong> detailed study of computer systems<br />
behavior.<br />
7