Evaluation of Planning Options to Alleviate Traffic Congestion and ...
Evaluation of Planning Options to Alleviate Traffic Congestion and ...
Evaluation of Planning Options to Alleviate Traffic Congestion and ...
Create successful ePaper yourself
Turn your PDF publications into a flip-book with our unique Google optimized e-Paper software.
12<br />
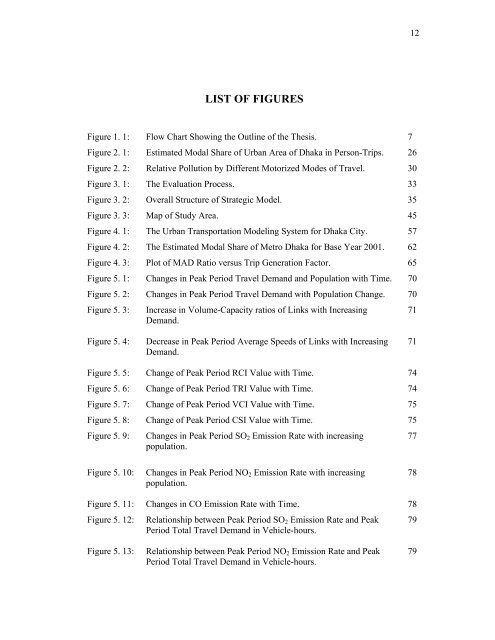
LIST OF FIGURES<br />
Figure 1. 1: Flow Chart Showing the Outline <strong>of</strong> the Thesis. 7<br />
Figure 2. 1: Estimated Modal Share <strong>of</strong> Urban Area <strong>of</strong> Dhaka in Person-Trips. 26<br />
Figure 2. 2: Relative Pollution by Different Mo<strong>to</strong>rized Modes <strong>of</strong> Travel. 30<br />
Figure 3. 1: The <strong>Evaluation</strong> Process. 33<br />
Figure 3. 2: Overall Structure <strong>of</strong> Strategic Model. 35<br />
Figure 3. 3: Map <strong>of</strong> Study Area. 45<br />
Figure 4. 1: The Urban Transportation Modeling System for Dhaka City. 57<br />
Figure 4. 2: The Estimated Modal Share <strong>of</strong> Metro Dhaka for Base Year 2001. 62<br />
Figure 4. 3: Plot <strong>of</strong> MAD Ratio versus Trip Generation Fac<strong>to</strong>r. 65<br />
Figure 5. 1: Changes in Peak Period Travel Dem<strong>and</strong> <strong>and</strong> Population with Time. 70<br />
Figure 5. 2: Changes in Peak Period Travel Dem<strong>and</strong> with Population Change. 70<br />
Figure 5. 3: Increase in Volume-Capacity ratios <strong>of</strong> Links with Increasing<br />
Dem<strong>and</strong>.<br />
71<br />
Figure 5. 4:<br />
Decrease in Peak Period Average Speeds <strong>of</strong> Links with Increasing<br />
Dem<strong>and</strong>.<br />
71<br />
Figure 5. 5: Change <strong>of</strong> Peak Period RCI Value with Time. 74<br />
Figure 5. 6: Change <strong>of</strong> Peak Period TRI Value with Time. 74<br />
Figure 5. 7: Change <strong>of</strong> Peak Period VCI Value with Time. 75<br />
Figure 5. 8: Change <strong>of</strong> Peak Period CSI Value with Time. 75<br />
Figure 5. 9: Changes in Peak Period SO 2 Emission Rate with increasing<br />
population.<br />
77<br />
Figure 5. 10:<br />
Changes in Peak Period NO 2 Emission Rate with increasing<br />
population.<br />
78<br />
Figure 5. 11: Changes in CO Emission Rate with Time. 78<br />
Figure 5. 12: Relationship between Peak Period SO 2 Emission Rate <strong>and</strong> Peak 79<br />
Period Total Travel Dem<strong>and</strong> in Vehicle-hours.<br />
Figure 5. 13:<br />
Relationship between Peak Period NO 2 Emission Rate <strong>and</strong> Peak<br />
Period Total Travel Dem<strong>and</strong> in Vehicle-hours.<br />
79


