GMR Infrastructure Limited - BSE
GMR Infrastructure Limited - BSE
GMR Infrastructure Limited - BSE

Create successful ePaper yourself
Turn your PDF publications into a flip-book with our unique Google optimized e-Paper software.
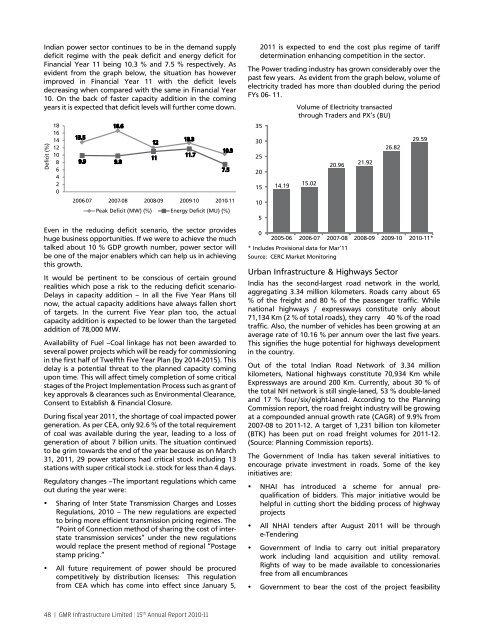
Indian power sector continues to be in the demand supply<br />
deficit regime with the peak deficit and energy deficit for<br />
Financial Year 11 being 10.3 % and 7.5 % respectively. As<br />
evident from the graph below, the situation has however<br />
improved in Financial Year 11 with the deficit levels<br />
decreasing when compared with the same in Financial Year<br />
10. On the back of faster capacity addition in the coming<br />
years it is expected that deficit levels will further come down.<br />
Deficit (%)<br />
18<br />
16<br />
14<br />
12<br />
10<br />
8<br />
6<br />
4<br />
2<br />
0<br />
13.5<br />
16.6<br />
9.9 9.8<br />
12<br />
11<br />
13.3<br />
11.7<br />
10.3<br />
2006-07 2007-08 2008-09 2009-10 2010-11<br />
7.5<br />
Peak Deficit (MW) (%) Energy Deficit (MU) (%)<br />
Even in the reducing deficit scenario, the sector provides<br />
huge business opportunities. If we were to achieve the much<br />
talked about 10 % GDP growth number, power sector will<br />
be one of the major enablers which can help us in achieving<br />
this growth.<br />
It would be pertinent to be conscious of certain ground<br />
realities which pose a risk to the reducing deficit scenario-<br />
Delays in capacity addition – In all the Five Year Plans till<br />
now, the actual capacity additions have always fallen short<br />
of targets. In the current Five Year plan too, the actual<br />
capacity addition is expected to be lower than the targeted<br />
addition of 78,000 MW.<br />
Availability of Fuel –Coal linkage has not been awarded to<br />
several power projects which will be ready for commissioning<br />
in the first half of Twelfth Five Year Plan (by 2014-2015). This<br />
delay is a potential threat to the planned capacity coming<br />
upon time. This will affect timely completion of some critical<br />
stages of the Project Implementation Process such as grant of<br />
key approvals & clearances such as Environmental Clearance,<br />
Consent to Establish & Financial Closure.<br />
During fiscal year 2011, the shortage of coal impacted power<br />
generation. As per CEA, only 92.6 % of the total requirement<br />
of coal was available during the year, leading to a loss of<br />
generation of about 7 billion units. The situation continued<br />
to be grim towards the end of the year because as on March<br />
31, 2011, 29 power stations had critical stock including 13<br />
stations with super critical stock i.e. stock for less than 4 days.<br />
Regulatory changes –The important regulations which came<br />
out during the year were:<br />
• y Sharing of Inter State Transmission Charges and Losses<br />
Regulations, 2010 – The new regulations are expected<br />
to bring more efficient transmission pricing regimes. The<br />
“Point of Connection method of sharing the cost of interstate<br />
transmission services” under the new regulations<br />
would replace the present method of regional “Postage<br />
stamp pricing.”<br />
• y All future requirement of power should be procured<br />
competitively by distribution licenses: This regulation<br />
from CEA which has come into effect since January 5,<br />
2011 is expected to end the cost plus regime of tariff<br />
determination enhancing competition in the sector.<br />
The Power trading industry has grown considerably over the<br />
past few years. As evident from the graph below, volume of<br />
electricity traded has more than doubled during the period<br />
FYs 06- 11.<br />
35<br />
30<br />
25<br />
20<br />
15<br />
10<br />
5<br />
0<br />
14.19 15.02<br />
2005-06<br />
Volume of Electricity transacted<br />
through Traders and PX’s (BU)<br />
20.96<br />
* Includes Provisional data for Mar’11<br />
Source: CERC Market Monitoring<br />
21.92<br />
26.82<br />
29.59<br />
2006-07 2007-08 2008-09 2009-10 2010-11*<br />
Urban <strong>Infrastructure</strong> & Highways Sector<br />
India has the second-largest road network in the world,<br />
aggregating 3.34 million kilometers. Roads carry about 65<br />
% of the freight and 80 % of the passenger traffic. While<br />
national highways / expressways constitute only about<br />
71,134 Km (2 % of total roads), they carry 40 % of the road<br />
traffic. Also, the number of vehicles has been growing at an<br />
average rate of 10.16 % per annum over the last five years.<br />
This signifies the huge potential for highways development<br />
in the country.<br />
Out of the total Indian Road Network of 3.34 million<br />
kilometers, National highways constitute 70,934 Km while<br />
Expressways are around 200 Km. Currently, about 30 % of<br />
the total NH network is still single-laned, 53 % double-laned<br />
and 17 % four/six/eight-laned. According to the Planning<br />
Commission report, the road freight industry will be growing<br />
at a compounded annual growth rate (CAGR) of 9.9% from<br />
2007-08 to 2011-12. A target of 1,231 billion ton kilometer<br />
(BTK) has been put on road freight volumes for 2011-12.<br />
(Source: Planning Commission reports).<br />
The Government of India has taken several initiatives to<br />
encourage private investment in roads. Some of the key<br />
initiatives are:<br />
• y NHAI has introduced a scheme for annual prequalification<br />
of bidders. This major initiative would be<br />
helpful in cutting short the bidding process of highway<br />
projects<br />
• y All NHAI tenders after August 2011 will be through<br />
e-Tendering<br />
• y Government of India to carry out initial preparatory<br />
work including land acquisition and utility removal.<br />
Rights of way to be made available to concessionaries<br />
free from all encumbrances<br />
• y Government to bear the cost of the project feasibility<br />
48 | <strong>GMR</strong> <strong>Infrastructure</strong> <strong>Limited</strong> | 15 th Annual Report 2010-11