Electric Utilities Sector Supplement - Global Reporting Initiative
Electric Utilities Sector Supplement - Global Reporting Initiative
Electric Utilities Sector Supplement - Global Reporting Initiative

Create successful ePaper yourself
Turn your PDF publications into a flip-book with our unique Google optimized e-Paper software.
EU<br />
Sustainability <strong>Reporting</strong> Guidelines &<br />
<strong>Electric</strong> <strong>Utilities</strong> <strong>Sector</strong> <strong>Supplement</strong><br />
© 2000-2011 GRI Version 3.0/EUSS Final Version
Table of Contents<br />
Overview of the Guidance included<br />
in this Document for the <strong>Electric</strong><br />
Utility <strong>Sector</strong> 2<br />
Preface<br />
Sustainable Development and the<br />
Transparency Imperative 9<br />
Introduction<br />
Introductory Section for the <strong>Electric</strong><br />
Utility <strong>Sector</strong> 10<br />
Overview of Sustainability <strong>Reporting</strong><br />
The Purpose of a Sustainability Report 13<br />
Orientation to the GRI <strong>Reporting</strong> Framework 13<br />
Orientation to the GRI Guidelines 14<br />
Applying the Guidelines 15<br />
Part 1<br />
Defining Report Content, Quality,<br />
and Boundary<br />
Guidance for Defining Report Content 16<br />
Principles for Defining Report Content 17<br />
Principles for Ensuring Report Quality 23<br />
Guidance for Report Boundary Setting 27<br />
Part 2<br />
Standard Disclosures<br />
Strategy and Profile 29<br />
1. Strategy and Analysis 30<br />
2. Organizational Profile 31<br />
3. Report Parameters 35<br />
4. Governance, Commitments,<br />
and Engagement 35<br />
5. Management Approach and<br />
Performance Indicators 37<br />
Sustainability <strong>Reporting</strong> Guidelines & <strong>Electric</strong> Utility <strong>Sector</strong> <strong>Supplement</strong><br />
Social:<br />
Labor Practices and Decent Work 44<br />
Human Rights 47<br />
Society 49<br />
Product Responsibility 51<br />
General <strong>Reporting</strong> Notes<br />
Data Gathering 53<br />
Report Form and Frequency 53<br />
Assurance 54<br />
Glossary of Terms 55<br />
G3 Guidelines /EUSS<br />
Acknowledgements 57<br />
RG<br />
&<br />
EUSS<br />
EU<br />
Economic 38<br />
Environmental 40<br />
RG Version 3.0/EUSS Final Version<br />
1
RG<br />
&<br />
EUSS<br />
Sustainability <strong>Reporting</strong> Guidelines & <strong>Electric</strong> Utility <strong>Sector</strong> <strong>Supplement</strong><br />
Overview of the Guidance<br />
included in this Document for<br />
the <strong>Electric</strong> Utility <strong>Sector</strong><br />
EU<br />
Throughout this document, electric utility sector-specific<br />
materials are highlighted using the following symbols:<br />
Co r e<br />
EU<br />
EU<br />
EU<br />
Denotes sector-specific text or<br />
commentary on existing G3 Guidelines<br />
content<br />
Denotes commentary on existing G3<br />
Guidelines performance indicator<br />
Denotes new, sector-specific disclosure on<br />
management approach or performance<br />
indicator<br />
All of the sector-specific disclosures and performance<br />
indicators are considered as core (these are labeled<br />
as EU1, EU2, EU3, etc.), and should be included in the<br />
content index, in addition to other items reporting<br />
organizations choose to report on.<br />
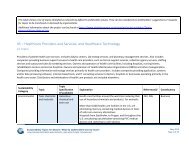
The following tables provide a summary of the<br />
electric utility sector-specific disclosures, performance<br />
indicators, and commentary on the G3 Guidelines that<br />
are included in this merged document of the content<br />
of the <strong>Electric</strong> Utility <strong>Sector</strong> <strong>Supplement</strong> (“<strong>Sector</strong><br />
<strong>Supplement</strong>”) and the G3 Guidelines. The table is<br />
organized by category and aspect. For some disclosures<br />
and performance indicators, further information on<br />
compilations, definitions, and other supporting details<br />
can be found in the body of this merged document.<br />
EU<br />
Organizational Profile<br />
<strong>Electric</strong> utility sector-specific<br />
Organizational Profile Disclosures<br />
Aspect<br />
Disclosure<br />
EU1. Installed capacity, broken down by primary energy source and by regulatory regime.<br />
EU2. Net energy output broken down by primary energy source and by regulatory regime.<br />
EU3. Number of residential, industrial, institutional and commercial customer accounts.<br />
EU4. Length of above and underground transmission and distribution lines by regulatory<br />
regime.<br />
EU5. Allocation of CO 2<br />
e emissions allowances or equivalent, broken down by carbon trading<br />
framework.<br />
Economic Section<br />
<strong>Electric</strong> utility sector-specific<br />
Economic Disclosures on Management Approach<br />
Aspect<br />
Availability and<br />
Reliability<br />
Demand-Side<br />
Management<br />
Research and<br />
Development<br />
Plant<br />
Decommissioning<br />
Disclosure<br />
EU6. Management approach to ensure short and long-term electricity availability and<br />
reliability.<br />
EU7. Demand-side management programs including residential, commercial, institutional and<br />
industrial programs.<br />
EU8. Research and development activity and expenditure aimed at providing reliable<br />
electricity and promoting sustainable development.<br />
EU9. Provisions for decommissioning of nuclear power sites.<br />
2<br />
© 2000-2009 GRI
EU<br />
Sustainability <strong>Reporting</strong> Guidelines & <strong>Electric</strong> Utility <strong>Sector</strong> <strong>Supplement</strong><br />
RG<br />
&<br />
EUSS<br />
<strong>Electric</strong> utility sector-specific<br />
Economic Performance Indicators<br />
Aspect<br />
Indicator<br />
Availability and<br />
Reliability<br />
System Efficiency<br />
System Efficiency<br />
EU10. Planned capacity against projected electricity demand over the long term, broken down<br />
by energy source and regulatory regime.<br />
EU11. Average generation efficiency of thermal plants by energy source and by regulatory<br />
regime.<br />
EU12. Transmission and distribution losses as a percentage of total energy<br />
Environmental Section<br />
<strong>Electric</strong> <strong>Utilities</strong> <strong>Sector</strong> Specific Commentary on G3 Environmental Disclosure on Management<br />
Approach<br />
Aspect<br />
Materials<br />
Water<br />
Biodiversity<br />
Emissions,<br />
Effluents, and<br />
Waste<br />
Commentary on DMA<br />
Long-term strategy for managing and phasing out high level and low level in-service PCBs.<br />
Compilation:<br />
Identify high level and low level as defined by the reporting organization according to<br />
prevailing national or regional standards. Use >500 ppm as the high level threshold in the<br />
absence of such standards. <strong>Reporting</strong> threshold for low level should be according to the<br />
prevailing national/regional standards or, if no standards exist, between 50 and 500 ppm.<br />
At the watershed or hydrological basin level, include collaborative approaches to managing<br />
watersheds and reservoirs for multiple uses (e.g., irrigation, drinking water, ecosystem<br />
conservation, etc.). Also report long- term planning for securing water resources, for meeting<br />
the needs of both the utility and other stakeholders (e.g. local communities). This includes<br />
describing the criteria for managing maximum/minimum flow of surface water and volume of<br />
ground water and how these are determined and maintained.<br />
Report approaches for pest and vegetation management along transmission and distribution<br />
corridors (e.g., use of Integrated Pest Management and Integrated Vegetation Management).<br />
Management strategy and storage methods for different types of radioactive nuclear waste,<br />
including:<br />
• Temporary and permanent storage;<br />
• Environmental, health and safety impacts of radioactive nuclear waste; and<br />
• Security measures according to the applicable management standards/legislative<br />
framework.<br />
Compilation:<br />
Radioactive nuclear waste includes Low Level Radioactive Waste, Intermediate Level.<br />
Radioactive Waste and High Level Radioactive Waste. Include mixed waste (radioactive and<br />
hazardous). Use IAEA definitions.<br />
EU<br />
RG Version 3.0/EUSS Final Version<br />
3
RG<br />
&<br />
EUSS<br />
Sustainability <strong>Reporting</strong> Guidelines & <strong>Electric</strong> Utility <strong>Sector</strong> <strong>Supplement</strong><br />
EU<br />
<strong>Electric</strong> Utility <strong>Sector</strong>-Specific<br />
Environmental Performance Indicators and commentary on G3 Indicators<br />
EU<br />
Aspect<br />
Materials<br />
Water<br />
Biodiversity<br />
Indicator and Commentary<br />
Commentary on EN1<br />
Materials used by weight or volume.<br />
Report in-use inventory of solid and liquid high level and low level PCBs contained in<br />
equipment.<br />
Commentary on EN8<br />
Total water withdrawal by source.<br />
Report overall water usage for processing, cooling and consumption in thermal and nuclear<br />
power plants, including use of water in ash handling.<br />
Commentary on EN12<br />
Description of significant impacts of activities, products, and services on biodiversity in protected<br />
areas and areas of high biodiversity value outside protected areas.<br />
Include maintenance of transmission line corridors; fragmentation and isolation (islandization);<br />
and impacts of thermal discharge.<br />
EU13. Biodiversity of offset habitats compared to the biodiversity of the affected areas.<br />
Commentary on EN14<br />
Strategies, current actions, and future plans for managing impacts on biodiversity.<br />
Report the impacts (including fragmentation and isolation), develop mitigation measures, and<br />
monitor residual effects at new sites and existing sites on the following:<br />
• Forested areas (e.g., alterations to tree crown density);<br />
• Loss of indigenous species;<br />
• Landscape (e.g., impacts of wind farms, transmission lines); and<br />
• Marine, freshwater and wetland ecosystems (e.g., downstream water quality including<br />
turbidity, sedimentation, siltation and water quality of reservoir and other water bodies).<br />
Assessment and mitigation should consider conservation plans for indigenous species,<br />
alterations in the migration, breeding, or habitat of animals (e.g., fish passage) from the<br />
reporting organization’s infrastructure (e.g., power lines and dams).<br />
4<br />
© 2000-2009 GRI
EU<br />
Sustainability <strong>Reporting</strong> Guidelines & <strong>Electric</strong> Utility <strong>Sector</strong> <strong>Supplement</strong><br />
RG<br />
&<br />
EUSS<br />
Aspect<br />
Emissions,<br />
effluents and<br />
Waste<br />
Indicator and Commentary<br />
Commentary on EN16<br />
Total direct and indirect greenhouse gas emissions by weight.<br />
Report CO 2<br />
e per MWh broken down by regulatory regime, for:<br />
• Net generation from all generating capacity;<br />
• Net generation from all fossil fuel generation; and<br />
• Estimated net delivery to end users. This includes emissions from own generation as well as<br />
gross purchased power including line losses.<br />
Commentary on EN18<br />
<strong>Initiative</strong>s to reduce greenhouse gas emissions and reductions achieved.<br />
This should be a CORE indicator for the sector.<br />
Commentary on EN20<br />
NO x<br />
, SO x<br />
, and other significant air emissions by type and weight:<br />
Report emissions per MWh net generation.<br />
Examples of ‘other significant air emissions’ include but are not limited to mercury, coal pile<br />
dust, ash lagoons or ponds, precipitator dust, and reservoir draw down dust.<br />
Commentary on EN21<br />
Total water discharge by quality and destination.<br />
Include thermal discharges.<br />
Commentary EN22<br />
Total weight of waste by type and disposal method.<br />
Include PCB waste.<br />
Report on nuclear waste using IAEA definitions and protocols.<br />
Report mass and activity of spent nuclear fuel sent for processing and reprocessing per year. In<br />
addition, report radioactive waste produced per net MWh nuclear generation per year.<br />
Report (in terms of mass and activity) low/intermediate level waste and high level waste<br />
separately, based on IAEA radioactive waste classification. This should also include waste<br />
produced from reprocessing activities, where data is available.<br />
EU<br />
Social Section<br />
<strong>Electric</strong> utility sector-specific<br />
Labor Practices and Decent Work Disclosures on Management Approach<br />
Aspect<br />
Employment<br />
Disclosures<br />
EU14. Programs and processes to ensure the availability of a skilled workforce.<br />
EU15. Percentage of employees eligible to retire in the next 5 and 10 years broken down by job<br />
category and by region.<br />
EU16. Policies and requirements regarding health and safety of employees and employees of<br />
contractors and subcontractors.<br />
RG Version 3.0/EUSS Final Version<br />
5
RG<br />
&<br />
EUSS<br />
Sustainability <strong>Reporting</strong> Guidelines & <strong>Electric</strong> Utility <strong>Sector</strong> <strong>Supplement</strong><br />
EU<br />
<strong>Electric</strong> <strong>Utilities</strong> <strong>Sector</strong>-Specific<br />
Labor Performance Indicators and Commentary on G3 Indicators<br />
EU<br />
Aspect<br />
Employment<br />
Labor/<br />
Management<br />
Relations<br />
Occupational<br />
Health and Safety<br />
Indicator and Commentary<br />
Commentary on LA1<br />
Total workforce by employment type, employment contract, and region.<br />
Report on total contractor workforce (contractor, subcontractor, independent contractor) by<br />
employment type, employment contract and region.<br />
Commentary on LA2<br />
Total number and rate of employee turnover by age group, gender, and region.<br />
For the employees leaving employment during the reporting period, provide the average<br />
length of tenure of employees leaving broken down by gender and age group.<br />
EU17. Days worked by contractor and subcontractor employees involved in construction,<br />
operation & maintenance activities.<br />
EU18. Percentage of contractor and subcontractor employees that have undergone relevant<br />
health and safety training<br />
Commentary on LA4<br />
Percentage of employees covered by collective bargaining agreements.<br />
Report on percentage of contractor employees (contractor, subcontractor and independent<br />
contractor) working for the reporting organization covered by collective bargaining<br />
agreements by country or regulatory regime.<br />
Commentary on LA7<br />
Rates of injury, occupational diseases, lost days, and absenteeism, and total number of workrelated<br />
fatalities by region.<br />
Report on health and safety performance of contractors and subcontractors working onsite or<br />
on behalf of the reporting organization off site.<br />
<strong>Electric</strong> <strong>Utilities</strong> <strong>Sector</strong>-Specific<br />
Commentary on G3 Human Rights Indicator<br />
Aspect<br />
Freedom of<br />
Association<br />
and Collective<br />
Bargaining<br />
Commentary<br />
Commentary on HR5<br />
Operations identified in which the right to exercise freedom of association or collective<br />
bargaining may be at significant risk, and actions taken to support these rights.<br />
Report on management mechanisms to address the right to organize, right to bargain and right<br />
to strike or instances of lock out given the context of the industry’s need to ensure continuous<br />
provision of essential services. Where the right to strike does not exist or is limited, report on<br />
remedial measures such as binding arbitration. Where freedom of association or expression are<br />
limited or prevented by regulatory regime, report on mechanisms and processes that exist for<br />
getting employee input on conditions of employment.<br />
6<br />
© 2000-2009 GRI
EU<br />
Sustainability <strong>Reporting</strong> Guidelines & <strong>Electric</strong> Utility <strong>Sector</strong> <strong>Supplement</strong><br />
RG<br />
&<br />
EUSS<br />
<strong>Electric</strong> utility sector-specific<br />
Society Disclosures on Management Approach<br />
Aspect<br />
Community<br />
Disaster/<br />
Emergency<br />
Planning and<br />
Response<br />
Disclosure<br />
EU19. Stakeholder participation in the decision making process related to energy planning and<br />
infrastructure development.<br />
EU20. Approach to managing the impacts of displacement.<br />
EU21. Contingency planning measures, disaster/emergency management plan and training<br />
programs, and recovery/restoration plans.<br />
<strong>Electric</strong> <strong>Utilities</strong> <strong>Sector</strong>-Specific<br />
Society Performance Indicator and Commentary on G3 Indicator<br />
Aspect<br />
Community<br />
Indicator and Commentary<br />
Commentary on SO1<br />
Nature, scope, and effectiveness of any programs and practices that assess and manage the<br />
impacts of operations on communities, including entering, operating, and exiting.<br />
Include discussions of programs related to:<br />
• Ways in which information is exchanged and local population is involved, prior, during and<br />
after the event and the provision for intervener funding for the local population.<br />
• Influx of workers and impacts on neighboring communities (including changes to local<br />
social structures and culture);<br />
• Changes to land-use including loss of global commons (e.g. access to land, natural<br />
resources, and heritage);<br />
• Impacts on infrastructure (e.g. roads, housing), and access to services (e.g. education,<br />
utilities, healthcare); and<br />
• Changes to the aesthetics and quality of the landscape.<br />
EU22. Number of people physically or economically displaced and compensation, broken down<br />
by type of project.<br />
EU<br />
RG Version 3.0/EUSS Final Version<br />
7
RG<br />
&<br />
EUSS<br />
Sustainability <strong>Reporting</strong> Guidelines & <strong>Electric</strong> Utility <strong>Sector</strong> <strong>Supplement</strong><br />
EU<br />
<strong>Electric</strong> utility sector-specific<br />
Product Responsibility Disclosures on Management Approach<br />
Aspect<br />
Access<br />
Provision of<br />
Information<br />
Disclosure<br />
EU23. Programs, including those in partnership with government, to improve or maintain<br />
access to electricity and customer support services.<br />
EU24. Practices to address language, cultural, low literacy and disability related barriers to<br />
accessing and safely using electricity and customer support services.<br />
EU<br />
<strong>Electric</strong> <strong>Utilities</strong> <strong>Sector</strong>-Specific<br />
Product Responsibility Performance Indicators and Commentary on G3 Indicators<br />
Aspect<br />
Indicator and Commentary<br />
Public Health and<br />
Safety<br />
Access<br />
Commentary on PR1<br />
Life cycle stages in which health and safety impacts of products and services are assessed for<br />
improvement, and percentage of significant products and services categories subject to such<br />
procedures.<br />
For electric utilities the following categories should also be assessed:<br />
• Resource planning<br />
• Generation<br />
• Transmission<br />
• Distribution<br />
• Use<br />
State the processes for assessing community health risks including monitoring, prevention<br />
measures and, if applicable, long term health-related studies.<br />
Identify community health risks that are assessed such as:<br />
• Compliance with exposure limit(s) to electric fields (in kV per m) and magnetic fields (in<br />
μT) where available, for members of the public and employees in the areas in which the<br />
reporting organization operates.<br />
EU25. Number of injuries and fatalities to the public involving company assets, including legal<br />
judgments, settlements and pending legal cases of diseases.<br />
EU26. Percentage of population unserved in licensed distribution or service areas.<br />
EU27. Number of residential disconnections for non-payment, broken down by duration of<br />
disconnection and by regulatory regime.<br />
EU28. Power outage frequency.<br />
EU29. Average power outage duration.<br />
EU30. Average plant availability factor by energy source and by regulatory regime.<br />
8<br />
© 2000-2009 GRI
Preface<br />
Sustainable Development and the<br />
Transparency Imperative<br />
The goal of sustainable development is to “meet the<br />
needs of the present without compromising the ability<br />
of future generations to meet their own needs.” 1 As<br />
key forces in society, organizations of all kinds have an<br />
important role to play in achieving this goal.<br />
Yet in this era of unprecedented economic growth,<br />
achieving this goal can seem more of an aspiration than<br />
a reality. As economies globalize, new opportunities<br />
to generate prosperity and quality of life are arising<br />
though trade, knowledge-sharing, and access to<br />
technology. However, these opportunities are not always<br />
available for an ever-increasing human population,<br />
and are accompanied by new risks to the stability of<br />
the environment. Statistics demonstrating positive<br />
improvements in the lives of many people around the<br />
world are counter-balanced by alarming information<br />
about the state of the environment and the continuing<br />
burden of poverty and hunger on millions of people.<br />
This contrast creates one of the most pressing dilemmas<br />
for the 21st century.<br />
One of the key challenges of sustainable development<br />
is that it demands new and innovative choices and ways<br />
of thinking. While developments in knowledge and<br />
technology are contributing to economic development,<br />
they also have the potential to help resolve the risks<br />
and threats to the sustainability of our social relations,<br />
environment, and economies. New knowledge and<br />
innovations in technology, management, and public<br />
policy are challenging organizations to make new<br />
choices in the way their operations, products, services,<br />
and activities impact the earth, people, and economies.<br />
Sustainability <strong>Reporting</strong> Guidelines & <strong>Electric</strong> Utility <strong>Sector</strong> <strong>Supplement</strong><br />
The urgency and magnitude of the risks and threats<br />
to our collective sustainability, alongside increasing<br />
choice and opportunities, will make transparency<br />
about economic, environmental, and social impacts<br />
a fundamental component in effective stakeholder<br />
relations, investment decisions, and other market<br />
relations. To support this expectation, and to<br />
communicate clearly and openly about sustainability,<br />
a globally shared framework of concepts, consistent<br />
language, and metrics is required. It is the <strong>Global</strong><br />
<strong>Reporting</strong> <strong>Initiative</strong>’s (GRI) mission to fulfil this need<br />
by providing a trusted and credible framework<br />
for sustainability reporting that can be used by<br />
organizations of any size, sector, or location.<br />
Transparency about the sustainability of organizational<br />
activities is of interest to a diverse range of stakeholders,<br />
including business, labor, non-governmental<br />
organizations, investors, accountancy, and others. This<br />
is why GRI has relied on the collaboration of a large<br />
network of experts from all of these stakeholder groups<br />
in consensus-seeking consultations. These consultations,<br />
together with practical experience, have continuously<br />
improved the <strong>Reporting</strong> Framework since GRI’s founding<br />
in 1997. This multi-stakeholder approach to learning<br />
has given the <strong>Reporting</strong> Framework the widespread<br />
credibility it enjoys with a range of stakeholder groups.<br />
RG<br />
&<br />
EUSS<br />
EU<br />
1 <br />
World Commission on Environment and Development. Our<br />
Common Future. Oxford: Oxford University Press, 1987, p.43.<br />
RG Version 3.0/EUSS Final Version<br />
9
RG<br />
&<br />
EUSS<br />
EU<br />
Sustainability <strong>Reporting</strong> Guidelines & <strong>Electric</strong> Utility <strong>Sector</strong> <strong>Supplement</strong><br />
Introductory Section for the<br />
<strong>Electric</strong> Utility <strong>Sector</strong><br />
Who is the <strong>Sector</strong> <strong>Supplement</strong><br />
intended for?<br />
The <strong>Sector</strong> <strong>Supplement</strong> is intended for organizations<br />
engaged in the generation, transmission, distribution<br />
or retail of electricity. The <strong>Sector</strong> <strong>Supplement</strong> content is<br />
developed to be globally applicable to electric utilities<br />
regardless of their type of generation, size, ownership or<br />
range of activities within the sector.<br />
Based on the G3 Guidelines, the <strong>Sector</strong> <strong>Supplement</strong><br />
provides reporting guidance on key aspects of<br />
sustainability performance that is meaningful and<br />
relevant to the electric utility sector. <strong>Reporting</strong> using<br />
this sector-specific guidance provides stakeholders with<br />
the ability to evaluate an electric utility’s sustainability<br />
performance on economic, environmental and social<br />
factors that are comparable with other electric utilities<br />
using the GRI <strong>Reporting</strong> Framework on a regional,<br />
national, and international scale. It also helps them to<br />
track the utility’s performance over time. Many of the<br />
topics included within the <strong>Sector</strong> <strong>Supplement</strong> could<br />
apply equally to a company’s annual report.<br />
<strong>Sector</strong>-specific guidance is provided in the form of<br />
commentary on the G3 Guidelines content and new<br />
sector-specific disclosures and performance indicators.<br />
This includes guidance on metrics, definitions, and<br />
calculation methods relevant to the sector. Some of<br />
the disclosures and indicators included in this <strong>Sector</strong><br />
<strong>Supplement</strong> may be relevant to other sectors that<br />
have similar operational footprints or sustainability<br />
issues. Nonetheless, all aspects included in this <strong>Sector</strong><br />
<strong>Supplement</strong> are important and appropriate for the<br />
electric utility sector and should be used to guide<br />
sustainability reporting in this sector (i.e., reporting on<br />
economic, environmental, and social performance at an<br />
organizational-level).<br />
How Can Diverse Organizations in the<br />
<strong>Electric</strong> Utility <strong>Sector</strong> Use this <strong>Sector</strong><br />
<strong>Supplement</strong>?<br />
Sustainability reporting is a process, and it does not<br />
begin or end with a printed or online publication. The<br />
process of reporting could provide opportunities to<br />
assess an organization’s policies and programs and<br />
the economic, social and environmental impacts of its<br />
activities. This assessment can help the organization to<br />
determine necessary steps for further improvement,<br />
EU<br />
and reporting on these will indicate changes over<br />
time. It often takes time to build a system for reporting,<br />
from selection of issues to be addressed, collection<br />
of necessary data, and determining the means<br />
to communicate the relevant information to the<br />
stakeholders (<strong>Reporting</strong> Principles found in Part 1 of<br />
the Guidelines should be referenced when determining<br />
report content). Some organizations may choose to<br />
introduce reporting on all material topics at once, while<br />
others may start with the most feasible and practical<br />
ones, and gradually expand the coverage over time.<br />
The breadth and depth of disclosures and performance<br />
indicators found in this <strong>Sector</strong> <strong>Supplement</strong> may pose<br />
challenges for reporters, especially for new reporters or<br />
small and medium sized enterprises, and it may not be<br />
possible to disclose all of the information elicited in this<br />
<strong>Sector</strong> <strong>Supplement</strong> at once.<br />
In addition, due to the differences in generation<br />
types, size, ownership and governance, range of<br />
activities or applicable regulatory regimes of individual<br />
electric utilities within the sector, certain sectorspecific<br />
indicators may not be readily applicable to<br />
all organizations in the sector. Therefore, reporting<br />
organizations should report on indicators that deliver<br />
most relevant and material information to their<br />
stakeholders.<br />
Overview<br />
<strong>Electric</strong> utilities provide essential and vital services to<br />
society and users. The services provided are crucial<br />
to the development and security of economies<br />
in all countries. Economic development must be<br />
achieved in a sustainable manner in order to protect<br />
key resource systems, and to provide for future<br />
generations. Specifically within the electric utility sector,<br />
a number of factors are fundamental in determining<br />
an electric utility’s economic, environmental, and<br />
social sustainability performance as the generation,<br />
transmission, and distribution of electricity utilizes<br />
natural resources. These three sustainability factors -<br />
economic, environmental, and social performance – are<br />
captured by the disclosures and indicators included in<br />
this <strong>Electric</strong> Utility <strong>Sector</strong> <strong>Supplement</strong>.<br />
Economic Factors:<br />
Investments in new equipment and maintenance<br />
of existing infrastructure along with research and<br />
development of sustainable electricity generation,<br />
transmission and distribution, and end-user<br />
technologies all require significant financial resources.<br />
Stakeholders typically expect reporting organizations<br />
to develop strategies to appropriately allocate these<br />
10<br />
© 2000-2009 GRI
financial resources, to provide reliable and high quality<br />
electricity supply into the future, to manage demand,<br />
and to provide shareholders and other stakeholders<br />
with the information necessary to assess the economic<br />
performance of the reporting organization.<br />
Environmental Factors:<br />
Stakeholders expect electric utilities to minimize the<br />
impact on the environment of the full life cycle of their<br />
business operations. <strong>Electric</strong> utilities are among the<br />
largest consumers of fossil fuels in the world, making<br />
fuel use/mix an increasingly important environmental<br />
concern. Fossil fuel combustion and other modes<br />
of electricity generation can result in wide spread<br />
environmental effects, including acid rain, climate<br />
change, radioactive and other contamination, and<br />
human health issues, if not adequately addressed in the<br />
electric power generation business. This has led electric<br />
utilities to consider strategies such as the installation of<br />
pollution control systems, development and utilization<br />
of power generation methods based on renewable<br />
energy and other non-fossil sources such as nuclear,<br />
wind, biomass, hydroelectric, and solar power, and to<br />
help meet demand with demand-side management<br />
solutions. These operational strategies include energy<br />
use reduction strategies as well as the shifting of<br />
electricity demand to off-peak hours of operation.<br />
Social Factors:<br />
Customers expect that electric utilities ensure the<br />
availability and reliability of electricity supply. In<br />
providing this electricity, electric utilities often engage<br />
stakeholders in decision making in order to achieve<br />
consistency with community goals and values.<br />
<strong>Electric</strong> utility assets and activities are often of a large<br />
scale, potentially impacting neighboring and distant<br />
communities. Stakeholders expect electric utilities to<br />
consider access to and affordability of electricity to all<br />
users for the overall sustainability of the community.<br />
The electric utility sector employs a workforce that can<br />
be exposed to potentially hazardous conditions such<br />
as high voltage electrical conductors and radiation at<br />
nuclear power facilities. Thus addressing workforce<br />
and safety issues are vital to the electric utilities’<br />
performance, since a qualified staff is fundamental to<br />
ensuring safe and reliable electricity services.<br />
Overarching Issues for the <strong>Sector</strong><br />
In addition to the set of new sector-specific disclosures<br />
and indicators, the following three topics have been<br />
identified as key topics that require special attention by<br />
the electric utilities for sustainability reporting:<br />
EU<br />
Sustainability <strong>Reporting</strong> Guidelines & <strong>Electric</strong> Utility <strong>Sector</strong> <strong>Supplement</strong><br />
<strong>Electric</strong> Utility <strong>Sector</strong> Regulatory and Market<br />
Structure<br />
<strong>Electric</strong> utilities often operate in a heavily regulated<br />
environment, which may vary across geographic<br />
locations of operations. Sustainability reporting by<br />
electric utilities is expected to provide clarity in terms<br />
of the specific regulatory and market environments<br />
in which they operate, and the availability of natural<br />
resources. In particular, implications of privatization,<br />
market structure, tariffs, governmental requirements<br />
and planning should be explicitly considered in the<br />
reporting. Some of these regulations are still emerging<br />
or developing, and stakeholders expect electric utilities<br />
to keep abreast of these requirements and incorporate<br />
them into their sustainability considerations and<br />
reporting.<br />
Stakeholder Engagement<br />
As providers of an essential service and as users of<br />
natural resources, stakeholders expect electric utilities<br />
to build trusting relationships with stakeholders<br />
in order to operate legitimately and sustainably.<br />
Across all economic, environmental, social themes<br />
described in this document, particular attention is<br />
called for the engagement of stakeholders. <strong>Electric</strong><br />
utilities are expected to disclose their approach to<br />
effective stakeholder engagement. Specific areas for<br />
consideration include: stakeholder identification, means<br />
of engagement, level and weighting of stakeholder<br />
representation in decision making processes. At a<br />
minimum, stakeholders include customers, neighbors,<br />
investors, shareholders, regulatory authorities, NGOs and<br />
other interested organizations, workers and civil society,<br />
with particular attention to vulnerable constituents.<br />
Contracting and Supply Chain Practices<br />
<strong>Electric</strong> utilities are often able to use their market<br />
presence and purchasing power to influence the social<br />
and environmental policies and practices of their<br />
suppliers and contractors. In fact in some cases, many of<br />
the major social and environmental impacts occur well<br />
upstream or downstream of the reporting organization’s<br />
operations (e.g., upstream fuel supply issues as well<br />
as downstream end of life considerations regarding<br />
electricity use). Contractors are often involved in various<br />
aspects of provision of electricity, and contractor’s<br />
performance can affect the environmental performance<br />
and safety and reliability of the core operations of the<br />
reporting organization.<br />
<strong>Electric</strong> utilities are often able to monitor and report on<br />
the performance of contractors, where they are integral<br />
RG<br />
&<br />
EUSS<br />
EU<br />
RG Version 3.0/EUSS Final Version<br />
11
RG<br />
&<br />
EUSS<br />
Sustainability <strong>Reporting</strong> Guidelines & <strong>Electric</strong> Utility <strong>Sector</strong> <strong>Supplement</strong><br />
to the utility’s operations, in order to ensure minimal<br />
risks to workers and communities as well as to ensure<br />
safety, reliability and security of the electricity supply.<br />
<strong>Electric</strong> utilities are encouraged to disclose their supply<br />
chain policies and practices regarding the products and<br />
services they purchase or contract when these policies<br />
and practices are relevant to sustainability issues. In<br />
order to disclose these policies and practices adequately,<br />
electric utilities may need to consider information about<br />
contractor or supplier entities beyond the reporting<br />
boundary as defined by the GRI Boundary Protocol.<br />
Typically, these policies and practices include capacity<br />
building in suppliers and contractors, workplace safety,<br />
waste disposal, protection of human rights, regulatory<br />
compliance and remediation efforts undertaken.<br />
EU<br />
EU<br />
2<br />
GRI Boundary Protocol can be downloaded from<br />
the following URL: http://www.globalreporting.org/<br />
<strong>Reporting</strong>Framework/<strong>Reporting</strong>FrameworkDownloads/<br />
12<br />
© 2000-2009 GRI
Overview of Sustainability<br />
<strong>Reporting</strong><br />
The Purpose of a Sustainability Report<br />
Sustainability reporting is the practice of measuring,<br />
disclosing, and being accountable to internal and<br />
external stakeholders for organizational performance<br />
towards the goal of sustainable development.<br />
‘Sustainability reporting’ is a broad term considered<br />
synonymous with others used to describe reporting on<br />
economic, environmental, and social impacts (e.g., triple<br />
bottom line, corporate responsibility reporting, etc.).<br />
A sustainability report should provide a balanced<br />
and reasonable representation of the sustainability<br />
performance of a reporting organization – including<br />
both positive and negative contributions.<br />
Sustainability reports based on the GRI <strong>Reporting</strong><br />
Framework disclose outcomes and results that occurred<br />
within the reporting period in the context of the<br />
organization’s commitments, strategy, and management<br />
approach. Reports can be used for the following<br />
purposes, among others:<br />
• Benchmarking and assessing sustainability<br />
performance with respect to laws, norms, codes,<br />
performance standards, and voluntary initiatives;<br />
• Demonstrating how the organization influences<br />
and is influenced by expectations about<br />
sustainable development; and<br />
G3 <strong>Reporting</strong> Framework<br />
• Comparing performance within an organization<br />
and between different organizations over time.<br />
Sustainability <strong>Reporting</strong> Guidelines & <strong>Electric</strong> Utility <strong>Sector</strong> <strong>Supplement</strong><br />
Orientation to the GRI <strong>Reporting</strong><br />
Framework<br />
All GRI <strong>Reporting</strong> Framework documents are developed<br />
using a process that seeks consensus through dialogue<br />
between stakeholders from business, the investor<br />
community, labor, civil society, accounting, academia,<br />
and others. All <strong>Reporting</strong> Framework documents are<br />
subject to testing and continuous improvement.<br />
The GRI <strong>Reporting</strong> Framework is intended to serve<br />
as a generally accepted framework for reporting on<br />
an organization’s economic, environmental, and social<br />
performance. It is designed for use by organizations of<br />
any size, sector, or location. It takes into account the<br />
practical considerations faced by a diverse range of<br />
organizations – from small enterprises to those with<br />
extensive and geographically dispersed operations.<br />
The GRI <strong>Reporting</strong> Framework contains general and<br />
sector-specific content that has been agreed by a wide<br />
range of stakeholders around the world to be generally<br />
applicable for reporting an organization’s sustainability<br />
performance.<br />
The Sustainability <strong>Reporting</strong> Guidelines (the<br />
Guidelines) consist of Principles for defining report<br />
content and ensuring the quality of reported<br />
information. It also includes Standard Disclosures made<br />
up of Performance Indicators and other disclosure<br />
items, as well as guidance on specific technical topics in<br />
reporting.<br />
RG<br />
&<br />
EUSS<br />
EU<br />
How to Report<br />
Principles and Guidance<br />
<strong>Reporting</strong><br />
Framework<br />
Protocols<br />
<strong>Sector</strong> <strong>Supplement</strong>s<br />
Standard Disclosures<br />
What to Report<br />
Figure 1: The GRI <strong>Reporting</strong> Framework<br />
RG Version 3.0/EUSS Final Version<br />
13
RG<br />
&<br />
EUSS<br />
Sustainability <strong>Reporting</strong> Guidelines & <strong>Electric</strong> Utility <strong>Sector</strong> <strong>Supplement</strong><br />
Indicator Protocols exist for each of the Performance<br />
Indicators contained in the Guidelines. These Protocols<br />
provide definitions, compilation guidance, and other<br />
information to assist report preparers and to ensure<br />
consistency in the interpretation of the Performance<br />
Indicators. Users of the Guidelines should also use the<br />
Indicator Protocols.<br />
<strong>Sector</strong> <strong>Supplement</strong>s complement the Guidelines<br />
with interpretations and guidance on how to apply the<br />
Guidelines in a given sector, and include sector-specific<br />
Performance Indicators. Applicable <strong>Sector</strong> <strong>Supplement</strong>s<br />
should be used in addition to the Guidelines rather than<br />
in place of the Guidelines.<br />
Technical Protocols are created to provide guidance on<br />
issues in reporting, such as setting the report boundary.<br />
They are designed to be used in conjunction with the<br />
Guidelines and <strong>Sector</strong> <strong>Supplement</strong>s and cover issues<br />
that face most organizations during the reporting<br />
process.<br />
Orientation to the <strong>Reporting</strong> Guidelines<br />
Orientation to the GRI Guidelines<br />
The Sustainability <strong>Reporting</strong> Guidelines consist of<br />
<strong>Reporting</strong> Principles, <strong>Reporting</strong> Guidance, and Standard<br />
Disclosures (including Performance Indicators). These<br />
elements are considered to be of equal in weight and<br />
importance.<br />
Part 1 – <strong>Reporting</strong> Principles and Guidance<br />
Three main elements of the reporting process are<br />
described in Part 1. To help determine what to report<br />
on, this section covers the <strong>Reporting</strong> Principles of<br />
materiality, stakeholder inclusiveness, sustainability<br />
context, and completeness, along with a brief set of<br />
tests for each Principle. Application of these Principles<br />
with the Standard Disclosures determines the topics<br />
and Indicators to be reported. This is followed by<br />
Principles of balance, comparability, accuracy, timeliness,<br />
reliability, and clarity, along with tests that can be used<br />
to help achieve the appropriate quality of the reported<br />
information. This section concludes with guidance for<br />
reporting organizations on how to define the range of<br />
entities represented by the report (also called the ‘Report<br />
Boundary’).<br />
Options for <strong>Reporting</strong><br />
EU<br />
Standard Disclosures Principles and Guidance<br />
Guidance for Defining<br />
Report Content<br />
Principles for Defining<br />
Report Content<br />
Principles for Ensuring<br />
Report Quality<br />
Guidance for Report<br />
Boundary Setting<br />
INPUT INPUT INPUT INPUT<br />
Profile<br />
Management<br />
Approach<br />
Performance<br />
Indicators<br />
OUTPUT<br />
OUTPUT<br />
OUTPUT<br />
Figure 2: Overview of the GRI Guidelines<br />
Focused Sustainability Report<br />
14<br />
© 2000-2009 GRI
Sustainability <strong>Reporting</strong> Guidelines & <strong>Electric</strong> Utility <strong>Sector</strong> <strong>Supplement</strong><br />
RG<br />
&<br />
EUSS<br />
Part 2 – Standard Disclosures<br />
Part 2 contains the Standard Disclosures that should<br />
be included in sustainability reports. The Guidelines<br />
identify information that is relevant and material to most<br />
organizations and of interest to most stakeholders for<br />
reporting the three types of Standard Disclosures:<br />
• Strategy and Profile: Disclosures that set the<br />
overall context for understanding organizational<br />
performance such as its strategy, profile, and<br />
governance.<br />
• Management Approach: Disclosures that<br />
cover how an organization addresses a given<br />
set of topics in order to provide context for<br />
understanding performance in a specific area.<br />
• Performance Indicators: Indicators that elicit<br />
comparable information on the economic,<br />
environmental, and social performance of the<br />
organization.<br />
Applying the Guidelines<br />
Getting Started<br />
All organizations (private, public, or non-profit) are<br />
encouraged to report against the Guidelines whether they<br />
are beginners or experienced reporters, and regardless of<br />
their size, sector, or location. <strong>Reporting</strong> can take various<br />
forms, including web or print, stand alone or combined<br />
with annual or financial reports.<br />
The first step is to determine report content. Guidance for<br />
this is provided in Part 1. Some organizations may choose<br />
to introduce reporting against the full GRI <strong>Reporting</strong><br />
Framework from the outset, while others may want to<br />
start with the most feasible and practical topics first and<br />
phase in reporting on other topics over time. All reporting<br />
organizations should describe the scope of their reporting<br />
and are encouraged to indicate their plans for expanding<br />
their reporting over time.<br />
GRI Application Levels<br />
Upon finalization of their report, preparers should declare<br />
the level to which they have applied the GRI <strong>Reporting</strong><br />
Framework via the “GRI Application Levels” system. This<br />
system aims to provide:<br />
• Report readers with clarity about the extent to<br />
which the GRI Guidelines and other <strong>Reporting</strong><br />
Framework elements have been applied in the<br />
preparation of a report.<br />
EU<br />
• Report preparers with a vision or path for<br />
incrementally expanding application of the GRI<br />
<strong>Reporting</strong> Framework over time.<br />
Declaring an Application Level results in a clear communication<br />
about which elements of the GRI <strong>Reporting</strong> Framework<br />
have been applied in the preparation of a report. To<br />
meet the needs of new beginners, advanced reporters, and<br />
those somewhere in between, there are three levels in the<br />
system. They are titled C, B, and A, The reporting criteria<br />
found in each level reflects an increasing application or<br />
coverage of the GRI <strong>Reporting</strong> Framework. An organization<br />
can self-declare a “plus” (+) at each level (ex., C+, B+, A+) if<br />
they have utilized external assurance. 2<br />
An organization self-declares a reporting level based<br />
on its own assessment of its report content against the<br />
criteria in the GRI Application Levels.<br />
2<br />
See the assurance section under General <strong>Reporting</strong> Notes<br />
for more information on options for assurance.<br />
RG Version 3.0/EUSS Final Version<br />
15
RG<br />
&<br />
EUSS<br />
EU<br />
Sustainability <strong>Reporting</strong> Guidelines & <strong>Electric</strong> Utility <strong>Sector</strong> <strong>Supplement</strong><br />
In addition to the self declaration, reporting organizations<br />
can choose one or both of the following options:<br />
• Have an assurance provider offer an opinion on the<br />
self-declaration.<br />
• Request that the GRI check the self-declaration.<br />
For more information on Application Levels, and<br />
the complete criteria, see the GRI Applications Level<br />
information pack available as an insert to this document,<br />
or found online at www.globalreporting.org.<br />
Request for notification of use<br />
Organizations that have used the Guidelines and/or other<br />
elements of the GRI <strong>Reporting</strong> Framework as the basis for<br />
their report are requested to notify the <strong>Global</strong> <strong>Reporting</strong><br />
<strong>Initiative</strong> upon its release. While notifying GRI, organizations<br />
can choose any or all of the following options:<br />
• Simply notify the GRI of the report and provide<br />
hard and/or soft copy<br />
• Register their report in GRI’s online database of reports<br />
• Request GRI check their self-declared Application<br />
Level.<br />
Maximizing Report Value<br />
Sustainability reporting is a living process and tool,<br />
and does not begin or end with a printed or online<br />
publication. <strong>Reporting</strong> should fit into a broader process<br />
for setting organizational strategy, implementing<br />
action plans, and assessing outcomes. <strong>Reporting</strong><br />
enables a robust assessment of the organization’s<br />
performance, and can support continuous improvement<br />
in performance over time. It also serves as a tool for<br />
engaging with stakeholders and securing useful input to<br />
organizational processes.<br />
Part 1: Defining Report Content, Quality,<br />
and Boundary<br />
This section provides <strong>Reporting</strong> Principles and <strong>Reporting</strong><br />
Guidance regarding defining report content, ensuring<br />
the quality of reported information, and setting the<br />
Report Boundary.<br />
<strong>Reporting</strong> Guidance describes actions that can be taken,<br />
or options that the reporting organization can consider<br />
when making decisions on what to report on, and<br />
generally helps interpret or govern the use of the GRI<br />
<strong>Reporting</strong> Framework. Guidance is provided for defining<br />
report content and setting report Boundary.<br />
<strong>Reporting</strong> Principles describe the outcomes a report<br />
should achieve and guide decisions throughout the<br />
reporting process, such as selecting which topics and<br />
Indicators to report on and how to report on them. Each<br />
of the Principles consists of a definition, an explanation,<br />
and a set of tests for the reporting organization to assess<br />
its use of the Principles. The tests are intended to serve<br />
as tools for self-diagnosis, but not as specific disclosures<br />
to report against. Tests can, however, serve as a reference<br />
for explaining decisions about the application of the<br />
Principles<br />
Together, the Principles are intended to help achieve<br />
transparency – a value and a goal that underlies all<br />
aspects of sustainability reporting. Transparency can<br />
be defined as the complete disclosure of information<br />
on the topics and Indicators required to reflect impacts<br />
and enable stakeholders to make decisions, and the<br />
processes, procedures, and assumptions used to<br />
prepare those disclosures. The Principles themselves are<br />
organized into two groups:<br />
• Principles for determining the topics and Indicators<br />
on which the organization should report; and<br />
• Principles for ensuring the quality and appropriate<br />
presentation of reported information.<br />
The Principles have been grouped in this way to help<br />
clarify their role and function, but this does not impose a<br />
rigid restriction on their use. Each Principle can support a<br />
range of decisions, and may prove useful in considering<br />
questions beyond just defining report content or ensuring<br />
the quality of reported information.<br />
16<br />
© 2000-2009 GRI
1.1 Defining Report Content<br />
In order to ensure a balanced and reasonable<br />
presentation of the organization’s performance, a<br />
determination must be made about what content the<br />
report should cover. This determination should be<br />
made by considering both the organization’s purpose<br />
and experience, and the reasonable expectations and<br />
interests of the organization’s stakeholders. Both are<br />
important reference points when deciding what to<br />
include in the report.<br />
<strong>Reporting</strong> Guidance for Defining Content<br />
Sustainability <strong>Reporting</strong> Guidelines & <strong>Electric</strong> Utility <strong>Sector</strong> <strong>Supplement</strong><br />
• The specific methods or processes used for<br />
assessing materiality should:<br />
• Differ for, and can be defined by, each<br />
organization;<br />
• Always take into account the guidance and<br />
tests found in the GRI <strong>Reporting</strong> Principles; and<br />
• Be disclosed.<br />
In applying this approach:<br />
RG<br />
&<br />
EUSS<br />
The following approach governs the use of the GRI<br />
<strong>Reporting</strong> Framework in preparing sustainability reports.<br />
• Identify the topics and related Indicators that are<br />
relevant, and therefore might be appropriate to<br />
report, by undergoing an iterative process using the<br />
Principles of materiality, stakeholder inclusiveness,<br />
sustainability context, and guidance on setting the<br />
Report Boundary.<br />
• When identifying topics, consider the relevance of<br />
all Indicator Aspects identified in the GRI Guidelines<br />
and applicable <strong>Sector</strong> <strong>Supplement</strong>s. Also consider<br />
other topics, if any, that are relevant to report.<br />
• From the set of relevant topics and Indicators<br />
identified, use the tests listed for each Principle to<br />
assess which topics and Indicators are material,<br />
and therefore should be reported 3 .<br />
Principles for Defining Report Content<br />
• Use the Principles to prioritize selected topics and<br />
decide which will be emphasized.<br />
• Differentiate between Core and Additional<br />
Indicators. All Indicators have been developed<br />
through GRI’s multi-stakeholder processes, and<br />
those designated as Core are generally applicable<br />
Indicators and are assumed to be material for most<br />
organizations. An organization should report on<br />
these unless they are deemed not material on<br />
the basis of the <strong>Reporting</strong> Principles. Additional<br />
Indicators may also be determined to be material.<br />
• The Indicators in final versions of <strong>Sector</strong><br />
<strong>Supplement</strong>s are considered to be Core Indicators,<br />
and should be applied using the same approach as<br />
the Core Indicators found in the Guidelines.<br />
• All other information (e.g., company specific<br />
Indicators) included in the report should be<br />
subject to the same <strong>Reporting</strong> Principles and<br />
have the same technical rigor as GRI Standard<br />
Disclosures.<br />
• Confirm that the information to be reported and<br />
the Report Boundary are appropriate by applying<br />
the Principle of completeness.<br />
Options for <strong>Reporting</strong><br />
EU<br />
Principles and Guidance<br />
Principles for Defining<br />
Report Content<br />
INPUT<br />
• Materiality<br />
• Stakeholder<br />
Inclusiveness<br />
• Sustainability<br />
Context<br />
• Completeness<br />
Figure 3: Principles for defining report Content<br />
3<br />
GRI <br />
Organizational Profile Disclosures (1-4) apply to all<br />
reporting organizations.<br />
RG Version 3.0/EUSS Final Version<br />
17
RG<br />
&<br />
EUSS<br />
EU<br />
Sustainability <strong>Reporting</strong> Guidelines & <strong>Electric</strong> Utility <strong>Sector</strong> <strong>Supplement</strong><br />
<strong>Reporting</strong> Principles for Defining Content<br />
Each of the <strong>Reporting</strong> Principles consists of a definition,<br />
an explanation, and a set of tests to guide the use of<br />
the Principles. The tests are intended to serve as tools<br />
for self-diagnosis, but not as specific Disclosure items to<br />
report against. The Principles should be used together<br />
with the guidance on defining content.<br />
Materiality<br />
Definition: The information in a report should cover<br />
topics and Indicators that reflect the organization’s<br />
significant economic, environmental, and social impacts,<br />
or that would substantively influence the assessments<br />
and decisions of stakeholders.<br />
Explanation: Organizations are faced with a wide range<br />
of topics on which it could report. Relevant topics and<br />
Indicators are those that may reasonably be considered<br />
important for reflecting the organization’s economic,<br />
environmental, and social impacts, or influencing the<br />
decisions of stakeholders, and, therefore, potentially merit<br />
inclusion in the report. Materiality is the threshold at which<br />
an issue or Indicator becomes sufficiently important that it<br />
should be reported. Beyond this threshold, not all material<br />
topics will be of equal importance and the emphasis<br />
within a report should reflect the relative priority of these<br />
material topics and Indicators.<br />
In financial reporting, materiality is commonly thought<br />
of as a threshold for influencing the economic decisions<br />
of those using an organization’s financial statements,<br />
investors in particular. The concept of a threshold is also<br />
important in sustainability reporting, but it is concerned<br />
with a wider range of impacts and stakeholders.<br />
Materiality for sustainability reporting is not limited only<br />
to those sustainability topics that have a significant<br />
financial impact on the organization. Determining<br />
materiality for a sustainability report also includes<br />
considering economic, environmental, and social<br />
impacts that cross a threshold in affecting the ability to<br />
meet the needs of the present without compromising<br />
the needs of future generations. 4 These material issues<br />
will often have a significant financial impact in the nearterm<br />
or long-term on an organization. They will therefore<br />
also be relevant for stakeholders who focus strictly on<br />
the financial condition of an organization.<br />
and the organization’s influence on upstream (e.g.,<br />
supply chain) and downstream (e.g., customers) entities.<br />
Assessments of materiality should also take into account<br />
the basic expectations expressed in the international<br />
standards and agreements with which the organization<br />
is expected to comply.<br />
These internal and external factors should be considered<br />
when evaluating the importance of information for<br />
reflecting significant economic, environmental, and<br />
social impacts, or stakeholder decision making. 5 A range<br />
of established methodologies can be used to assess the<br />
significance of impacts. In general, ‘significant impacts’<br />
refer to those that are a subject of established concern<br />
for expert communities, or that have been identified<br />
using established tools such as impact assessment<br />
methodologies or life cycle assessments. Impacts that<br />
are considered important enough to require active<br />
management or engagement by the organization can<br />
likely be considered to be significant.<br />
The report should emphasize information on performance<br />
regarding the most material topics. Other relevant topics<br />
can be included, but should be given less prominence in<br />
the report. The process by which the relative priority of<br />
topics was determined should be explained.<br />
Establishing<br />
In addition<br />
Materiality<br />
to guiding the selection of topics to report, the<br />
Materiality Principle also applies to the use of Performance<br />
Indicators. When disclosing performance data, there are<br />
Influence on Stakeholder Assessments and Decisions<br />
Non-Material Issues<br />
Material Issues<br />
Low Relative <strong>Reporting</strong> Priority High<br />
A combination of internal and external factors should<br />
be used to determine whether information is material,<br />
including factors such as the organization’s overall<br />
mission and competitive strategy, concerns expressed<br />
directly by stakeholders, broader social expectations,<br />
Significance of Economic, Environmental, and Social Impacts<br />
Figure 4: Defining Materiality<br />
4<br />
World Commission on Environment and Development. Our Common Future. Oxford: Oxford University Press, 1987, p. 43.<br />
5<br />
See the principle of stakeholder inclusion for a discussion of stakeholders.<br />
18<br />
© 2000-2009 GRI
Sustainability <strong>Reporting</strong> Guidelines & <strong>Electric</strong> Utility <strong>Sector</strong> <strong>Supplement</strong><br />
RG<br />
&<br />
EUSS<br />
varying degrees of comprehensiveness and detail that<br />
could be provided in a report. In some cases, GRI<br />
guidance exists on the level of detail generally considered<br />
appropriate for a specific Indicator. Overall, decisions on<br />
how to report data should be guided by the importance<br />
of the information for assessing the performance of the<br />
organization, and facilitating appropriate comparisons.<br />
<strong>Reporting</strong> on material topics may involve disclosing<br />
information used by external stakeholders that differs<br />
from the information used internally for day-to-day<br />
management purposes. However, such information<br />
does indeed belong in a report, where it can inform<br />
assessments or decision-making by stakeholders, or<br />
support engagement with stakeholders that can result in<br />
actions that would significantly influence performance<br />
or address key topics of stakeholder concern.<br />
Tests<br />
External Factors<br />
In defining material topics, take into account external<br />
factors, including:<br />
Internal Factors<br />
In defining material topics, take into account internal<br />
factors, including:<br />
R<br />
R<br />
R<br />
R<br />
R<br />
Key organizational values, policies, strategies,<br />
operational management systems, goals, and<br />
targets.<br />
The interests/expectations of stakeholders<br />
specifically invested in the success of the organization<br />
(e.g., employees, shareholders, and suppliers).<br />
Significant risks to the organization.<br />
Critical factors for enabling organizational success.<br />
The core competencies of the organization and the<br />
manner in which they can or could contribute to<br />
sustainable development.<br />
Prioritizing<br />
R<br />
The report prioritizes material topics and Indicators.<br />
R<br />
R<br />
R<br />
R<br />
Main sustainability interests/topics and Indicators<br />
raised by stakeholders.<br />
The main topics and future challenges for the<br />
sector reported by peers and competitors.<br />
Relevant laws, regulations, international<br />
agreements, or voluntary agreements with<br />
strategic significance to the organization and its<br />
stakeholders.<br />
Reasonably estimable sustainability impacts, risks,<br />
or opportunities (e.g., global warming, HIV-AIDS,<br />
poverty) identified through sound investigation<br />
by people with recognized expertise, or by expert<br />
bodies with recognized credentials in the field.<br />
EU<br />
RG Version 3.0/EUSS Final Version<br />
19
RG<br />
&<br />
EUSS<br />
Sustainability <strong>Reporting</strong> Guidelines & <strong>Electric</strong> Utility <strong>Sector</strong> <strong>Supplement</strong><br />
EU<br />
Stakeholder Inclusiveness<br />
Definition: The reporting organization should identify<br />
its stakeholders and explain in the report how it has<br />
responded to their reasonable expectations and interests.<br />
Explanation: Stakeholders are defined as entities or<br />
individuals that can reasonably be expected to be<br />
significantly affected by the organization’s activities,<br />
products, and/or services; and whose actions can<br />
reasonably be expected to affect the ability of the<br />
organization to successfully implement its strategies<br />
and achieve its objectives. This includes entities or<br />
individuals whose rights under law or international<br />
conventions provide them with legitimate claims vis-àvis<br />
the organization.<br />
Stakeholders can include those who are invested in the<br />
organization (e.g., employees, shareholders, suppliers) as<br />
well as those who are external to the organization (e.g.,<br />
communities).<br />
The reasonable expectations and interests of<br />
stakeholders are a key reference point for many<br />
decisions in the preparation of a report, such as<br />
the scope, boundary, application of Indicators,<br />
and assurance approach. However, not all of an<br />
organization’s stakeholders will use the report. This<br />
presents challenges in balancing the specific interests/<br />
expectations of stakeholders who can reasonably be<br />
expected to use the report with broader expectations of<br />
accountability to all stakeholders.<br />
For some decisions, such as the report scope or<br />
boundary of a report, the reasonable expectations and<br />
interests of a wide range of stakeholder will need to be<br />
considered. There may be, for example, stakeholders<br />
who are unable to articulate their views on a report<br />
and whose concerns are presented by proxies. There<br />
may also be stakeholders who choose not to express<br />
views on reports because they rely on different means<br />
of communication and engagement. The reasonable<br />
expectations and interests of these stakeholders should<br />
still be acknowledged in decisions about the content<br />
of the report. However, other decisions, such as the<br />
level of detail required to be useful to stakeholders, or<br />
expectations of different stakeholders about what is<br />
required to achieve clarity, may require greater emphasis<br />
on those who can reasonably be expected to use the<br />
report. It is important to document the processes and<br />
approach taken in making these decisions.<br />
Stakeholder engagement processes can serve as tools<br />
for understanding the reasonable expectations and<br />
interests of stakeholders. Organizations typically initiate<br />
different types of stakeholder engagement as part of<br />
their regular activities, which can provide useful inputs for<br />
decisions on reporting. These may include, for example,<br />
stakeholder engagement for the purpose of compliance<br />
with internationally-agreed standards, or informing<br />
ongoing organizational/ business processes. In addition,<br />
stakeholder engagement may also be implemented<br />
specifically to inform the report preparation process.<br />
Organizations can also use other means such as the<br />
media, the scientific community, or collaborative activities<br />
with peers and stakeholders. These means can help the<br />
organization better understand stakeholders’ reasonable<br />
expectations and interests.<br />
For a report to be assurable, the process of stakeholder<br />
engagement should be documented. When stakeholder<br />
engagement processes are used for reporting purposes,<br />
they should be based on systematic or generallyaccepted<br />
approaches, methodologies, or principles.<br />
The overall approach should be sufficiently effective<br />
to ensure that stakeholders’ information needs are<br />
properly understood. The reporting organization should<br />
document its approach for defining which stakeholders<br />
it engaged with, how and when it engaged with them,<br />
and how engagement has influenced the report content<br />
and the organization’s sustainability activities. These<br />
processes should be capable of identifying direct input<br />
from stakeholders as well as legitimately established<br />
societal expectations. An organization may encounter<br />
conflicting views or differing expectations among its<br />
stakeholders, and will need to be able to explain how it<br />
balanced these in reaching its reporting decisions.<br />
Failure to identify and engage with stakeholders is<br />
likely to result in reports that are not suitable, and<br />
therefore not fully credible, to all stakeholders. In<br />
contrast, systematic stakeholder engagement enhances<br />
stakeholder receptivity and the usefulness of the<br />
report. Executed properly, it is likely to result in ongoing<br />
learning within the organization and by external<br />
parties, as well as increase accountability to a range of<br />
stakeholders. Accountability strengthens trust between<br />
the reporting organization and its stakeholders.<br />
Trust, in turn, fortifies report credibility.<br />
20<br />
© 2000-2009 GRI
Sustainability <strong>Reporting</strong> Guidelines & <strong>Electric</strong> Utility <strong>Sector</strong> <strong>Supplement</strong><br />
RG<br />
&<br />
EUSS<br />
Tests:<br />
Sustainability Context<br />
R<br />
R<br />
R<br />
R<br />
The organization can describe the stakeholders to<br />
whom it considers itself accountable.<br />
The report content draws upon the outcomes<br />
of stakeholder engagement processes used by<br />
the organization in its ongoing activities, and as<br />
required by the legal and institutional framework<br />
in which it operates.<br />
The report content draws upon the outcomes<br />
of any stakeholder engagement processes<br />
undertaken specifically for the report.<br />
The stakeholder engagement processes that<br />
inform decisions about the report are consistent<br />
with the scope and boundary of the report.<br />
Definition: The report should present the organization’s<br />
performance in the wider context of sustainability.<br />
Explanation: Information on performance should<br />
be placed in context. The underlying question of<br />
sustainability reporting is how an organization<br />
contributes, or aims to contribute in the future, to<br />
the improvement or deterioration of economic,<br />
environmental, and social conditions, developments,<br />
and trends at the local, regional, or global level.<br />
<strong>Reporting</strong> only on trends in individual performance (or<br />
the efficiency of the organization) will fail to respond<br />
to this underlying question. Reports should therefore<br />
seek to present performance in relation to broader<br />
concepts of sustainability. This will involve discussing<br />
the performance of the organization in the context of<br />
the limits and demands placed on environmental or<br />
social resources at the sectoral, local, regional, or global<br />
level. For example, this could mean that in addition to<br />
reporting on trends in eco-efficiency, an organization<br />
might also present its absolute pollution loading in<br />
relation to the capacity of the regional ecosystem to<br />
absorb the pollutant.<br />
This concept is often most clearly articulated in the<br />
environmental arena in terms of global limits on<br />
resource use and pollution levels. However, it can also be<br />
relevant with respect to social and economic objectives<br />
such as national or international socio-economic<br />
and sustainable development goals. For example, an<br />
organization could report on employee wages and<br />
social benefit levels in relation to nation-wide minimum<br />
and median income levels and the capacity of social<br />
safety nets to absorb those in poverty or those living<br />
close to the poverty line. Organizations operating in a<br />
diverse range of locations, sizes, and sectors will need to<br />
consider how to best frame their overall organizational<br />
performance in the broader context of sustainability. This<br />
may require distinguishing between topics or factors<br />
that drive global impacts (such as climate change) and<br />
those that have more regional or local impacts (such as<br />
community development). Similarly, distinctions might<br />
need to be made between trends or patterns of impacts<br />
across the range of operations versus contextualizing<br />
performance location by location.<br />
EU<br />
The organization’s own sustainability and business<br />
strategy provides the context in which to discuss<br />
performance. The relationship between sustainability and<br />
organizational strategy should be made clear, as should<br />
the context within which performance is reported.<br />
RG Version 3.0/EUSS Final Version<br />
21
RG<br />
&<br />
EUSS<br />
Sustainability <strong>Reporting</strong> Guidelines & <strong>Electric</strong> Utility <strong>Sector</strong> <strong>Supplement</strong><br />
Tests:<br />
Completeness<br />
EU<br />
R<br />
R<br />
R<br />
R<br />
The organization presents its understanding of<br />
sustainable development and draws on objective<br />
and available information as well as measures of<br />
sustainable development for the topics covered in<br />
the report.<br />
The organization presents its performance with<br />
reference to broader sustainable development<br />
conditions and goals, as reflected in recognized<br />
sectoral, local, regional, and/or global publications.<br />
The organization presents its performance in<br />
a manner that attempts to communicate the<br />
magnitude of its impact and contribution in<br />
appropriate geographical contexts.<br />
The report describes how sustainability topics<br />
relate to long-term organizational strategy, risks,<br />
and opportunities, including supply-chain topics.<br />
Definition: Coverage of the material topics and<br />
Indicators and definition of the report boundary<br />
should be sufficient to reflect significant economic,<br />
environmental, and social impacts and enable<br />
stakeholders to assess the reporting organization’s<br />
performance in the reporting period.<br />
Explanation: Completeness primarily encompasses the<br />
dimensions of scope, boundary, and time. The concept<br />
of completeness can also be used to refer to practices<br />
in information collection (for example, ensuring that<br />
compiled data includes results from all sites within the<br />
Report Boundary) and whether the presentation of<br />
information is reasonable and appropriate. These topics<br />
are related to report quality, and are addressed in greater<br />
detail under the Principles of accuracy and balance later<br />
in Part 1.<br />
Scope refers to the range of sustainability topics covered<br />
in a report. The sum of the topics and Indicators reported<br />
should be sufficient to reflect significant economic,<br />
environmental, and social impacts. It should also enable<br />
stakeholders to assess the organization’s performance.<br />
In determining whether the information in the report<br />
is sufficient, the organization should consider both the<br />
results of stakeholder engagement processes and broadbased<br />
societal expectations that may not have surfaced<br />
directly through stakeholder engagement processes.<br />
‘Boundary’ refers to the range of entities (e.g.,<br />
subsidiaries, joint ventures, sub-contractors, etc.) whose<br />
performance is represented by the report. In setting the<br />
boundary for its report, an organization must consider<br />
the range of entities over which it exercises control<br />
(often referred to as the ‘organizational boundary’, and<br />
usually linked to definitions used in financial reporting)<br />
and over which it exercises influence (often called the<br />
‘operational boundary’). In assessing influence, the<br />
organization will need to consider its ability to influence<br />
entities upstream (e.g., in its supply chain) as well as<br />
entities downstream (e.g., distributors and users of its<br />
products and services). The boundary may vary based<br />
on the specific Aspect or type of information being<br />
reported.<br />
‘Time’ refers to the need for the selected information to<br />
be complete for the time period specified by the report.<br />
As far as practicable, activities, events, and impacts<br />
should be presented for the reporting period in which<br />
they occur. This includes reporting on activities that<br />
produce minimal short-term impact, but which have<br />
22<br />
© 2000-2009 GRI
a significant and reasonably foreseeable cumulative<br />
effect that may become unavoidable or irreversible in<br />
the longer term (e.g., bio-accumulative or persistent<br />
pollutants). In making estimates of future impacts (both<br />
positive and negative), the reported information should<br />
be based on well-reasoned estimates that reflect the<br />
likely size, nature, and scope of impacts. Although such<br />
estimates are by nature subject to uncertainty, they can<br />
provide useful information for decision-making as long<br />
as the basis for estimates is clearly disclosed and the<br />
limitations of the estimates are clearly acknowledged.<br />
Disclosing the nature and likelihood of such impacts,<br />
even if they may only materialize in the future, is<br />
consistent with the goal of providing a balanced<br />
and reasonable representation of the organization’s<br />
economic, environmental, and social performance.<br />
Tests:<br />
Sustainability <strong>Reporting</strong> Guidelines & <strong>Electric</strong> Utility <strong>Sector</strong> <strong>Supplement</strong><br />
1.2 <strong>Reporting</strong> Principles for<br />
Defining Quality<br />
This section contains Principles that guide choices on<br />
ensuring the quality of reported information, including<br />
its proper presentation. Decisions related to the<br />
process of preparing information in a report should be<br />
consistent with these Principles. All of these Principles<br />
are fundamental for effective transparency. The quality<br />
of information enables stakeholders to make sound<br />
and reasonable assessments of performance, and take<br />
appropriate action.<br />
<strong>Reporting</strong> Principles for Defining Quality<br />
Balance<br />
Definition: The report should reflect positive and<br />
negative aspects of the organization’s performance to<br />
enable a reasoned assessment of overall performance.<br />
RG<br />
&<br />
EUSS<br />
R<br />
R<br />
R<br />
The report was developed taking into account the<br />
entire chain of entities upstream and downstream,<br />
and covers and prioritizes all information that<br />
should reasonably be considered material on the<br />
basis of the principles of materiality, sustainability<br />
context, and stakeholder inclusiveness.<br />
The report includes all entities that meet the<br />
criteria of being subject to control or significant<br />
influence of the reporting organization unless<br />
otherwise declared.<br />
The information in the report includes all<br />
significant actions or events in the reporting<br />
period, and reasonable estimates of significant<br />
future impacts of past events when those impacts<br />
are reasonably foreseeable and may become<br />
unavoidable or irreversible.<br />
Explanation: The overall presentation of the report’s<br />
content should provide an unbiased picture of the<br />
reporting organization’s performance. The report should<br />
avoid selections, omissions, or presentation formats<br />
that are reasonably likely to unduly or inappropriately<br />
influence a decision or judgment by the report<br />
reader. The report should include both favorable and<br />
unfavorable results, as well as topics that can influence<br />
the decisions of stakeholders in proportion to their<br />
materiality. Reports should clearly distinguish between<br />
factual presentation and the reporting organization’s<br />
interpretation of information.<br />
Tests:<br />
R<br />
The report discloses both favorable and<br />
unfavorable results and topics.<br />
EU<br />
R<br />
The report does not omit relevant information<br />
that would influence or inform stakeholder<br />
assessments or decisions, or that would reflect<br />
significant economic, environmental, and social<br />
impacts.<br />
R<br />
R<br />
The information in the report is presented in<br />
a format that allows users to see positive and<br />
negative trends in performance on a year-to-year<br />
basis.<br />
The emphasis on the various topics in the report is<br />
proportionate to their relative materiality.<br />
RG Version 3.0/EUSS Final Version<br />
23
RG<br />
&<br />
EUSS<br />
Sustainability <strong>Reporting</strong> Guidelines & <strong>Electric</strong> Utility <strong>Sector</strong> <strong>Supplement</strong><br />
Comparability<br />
Definition: Issues and information should be selected,<br />
compiled, and reported consistently. Reported<br />
information should be presented in a manner that<br />
enables stakeholders to analyze changes in the<br />
organization’s performance over time, and could<br />
support analysis relative to other organizations.<br />
Explanation: Comparability is necessary for evaluating<br />
performance. Stakeholders using the report should be<br />
able to compare information reported on economic,<br />
environmental, and social performance against the<br />
organization’s past performance, its objectives, and, to<br />
the degree possible, against the performance of other<br />
organizations. Consistency in reporting allows internal<br />
and external parties to benchmark performance and<br />
assess progress as part of rating activities, investment<br />
decisions, advocacy programs, and other activities.<br />
Comparisons between organizations require sensitivity<br />
to factors such as differences in organizational size,<br />
geographic influences, and other considerations that<br />
may affect the relative performance of an organization.<br />
Where necessary, report preparers should consider<br />
providing context that will help report users understand<br />
the factors that may contribute to differences in<br />
performance between organizations.<br />
content of reports will also evolve. However, within the<br />
confines of the Principle of Materiality, organizations<br />
should aim for consistency in their reports over time.<br />
An organization should include total numbers (i.e.,<br />
absolute data such as tons of waste) as well as ratios (i.e.,<br />
normalized data such as waste per unit of production) to<br />
enable analytical comparisons.<br />
When changes occur with the boundary, scope, length<br />
of the reporting period, or content (including the design,<br />
definitions, and use of any Indicators in the report),<br />
reporting organizations should, whenever practicable,<br />
restate current disclosures alongside historical data<br />
(or vice versa). This ensures that information and<br />
comparisons are both reliable and meaningful over<br />
time. Where such restatements are not provided, the<br />
report should explain the reasons and implications for<br />
interpreting current disclosures.<br />
Tests:<br />
R<br />
R<br />
The report and the information contained within it<br />
can be compared on a year-to-year basis.<br />
The organization’s performance can be compared<br />
with appropriate benchmarks.<br />
EU<br />
Maintaining consistency with the methods used to<br />
calculate data, with the layout of the report, and with<br />
explaining the methods and assumptions used to<br />
prepare information, all facilitates comparability over<br />
time. As the Principles relative importance for Ensuring of topics Report to a given Quality<br />
organization and its stakeholders change over time, the<br />
R<br />
Any significant variation between reporting<br />
periods in the boundary, scope, length of<br />
reporting period, or information covered in the<br />
report can be identified and explained.<br />
Options for <strong>Reporting</strong><br />
Principles and Guidance<br />
Principles for Ensuring<br />
Report Quality<br />
INPUT<br />
• Balance<br />
• Clarity<br />
• Accuracy<br />
• Timeliness<br />
• Comparability<br />
• Reliability<br />
Figure 5: Principles for Ensuring Report Quality<br />
24<br />
© 2000-2009 GRI
Sustainability <strong>Reporting</strong> Guidelines & <strong>Electric</strong> Utility <strong>Sector</strong> <strong>Supplement</strong><br />
RG<br />
&<br />
EUSS<br />
R<br />
R<br />
Where they are available, the report utilizes<br />
generally accepted protocols for compiling,<br />
measuring, and presenting information, including<br />
the GRI Technical Protocols for Indicators contained<br />
in the Guidelines.<br />
The report uses GRI <strong>Sector</strong> <strong>Supplement</strong>s, where<br />
available.<br />
Accuracy<br />
Definition: The reported information should be<br />
sufficiently accurate and detailed for stakeholders to<br />
assess the reporting organization’s performance.<br />
Explanation: Responses to economic, environmental,<br />
and social topics and Indicators can be expressed<br />
in many different ways, ranging from qualitative<br />
responses to detailed quantitative measurements.<br />
The characteristics that determine accuracy vary<br />
according to the nature of the information and the<br />
user of the information. For example, the accuracy of<br />
qualitative information is largely determined by the<br />
degree of clarity, detail, and balance in presentation<br />
within the appropriate Report Boundary. The accuracy<br />
of quantitative information, on the other hand, may<br />
depend on the specific methods used to gather, compile,<br />
and analyze data. The specific threshold of accuracy that<br />
is necessary will depend partly on the intended use of<br />
the information. Certain decisions will require higher<br />
levels of accuracy in reported information than others.<br />
Tests:<br />
R<br />
R<br />
R<br />
R<br />
R<br />
The report indicates the data that has been<br />
measured.<br />
The data measurement techniques and bases for<br />
calculations are adequately described, and can be<br />
replicated with similar results.<br />
The margin of error for quantitative data is not<br />
sufficient to substantially influence the ability of<br />
stakeholders to reach appropriate and informed<br />
conclusions on performance.<br />
The report indicates which data has been<br />
estimated and the underlying assumptions and<br />
techniques used to produce the estimates, or<br />
where that information can be found.<br />
The qualitative statements in the report are valid<br />
on the basis of other reported information and<br />
other available evidence.<br />
EU<br />
RG Version 3.0/EUSS Final Version<br />
25
RG<br />
&<br />
EUSS<br />
Sustainability <strong>Reporting</strong> Guidelines & <strong>Electric</strong> Utility <strong>Sector</strong> <strong>Supplement</strong><br />
Timeliness<br />
Definition: <strong>Reporting</strong> occurs on a regular schedule and<br />
information is available in time for stakeholders to make<br />
informed decisions.<br />
Explanation: The usefulness of information is<br />
closely tied to whether the timing of its disclosure to<br />
stakeholders enables them to effectively integrate it into<br />
their decision-making. The timing of release refers both<br />
to the regularity of reporting as well as its proximity to<br />
the actual events described in the report.<br />
Although a constant flow of information is desirable for<br />
meeting certain purposes, reporting organizations should<br />
commit to regularly providing a consolidated disclosure<br />
of their economic, environmental, and social performance<br />
at a single point in time. Consistency in the frequency<br />
of reporting and the length of reporting periods is also<br />
necessary to ensure comparability of information over<br />
time and accessibility of the report to stakeholders. It<br />
can be of value for stakeholders if the schedules for<br />
sustainability reporting and financial reporting are<br />
aligned. The organization should balance the need<br />
to provide information in a timely manner with the<br />
importance of ensuring that the information is reliable.<br />
Clarity<br />
Definition: Information should be made available in<br />
a manner that is understandable and accessible to<br />
stakeholders using the report.<br />
Explanation: The report should present information<br />
in a way that is understandable, accessible, and usable<br />
by the organization’s range of stakeholders (whether<br />
in print form or through other channels). A stakeholder<br />
should be able to find desired information without<br />
unreasonable effort. Information should be presented<br />
in a manner that is comprehensible to stakeholders who<br />
have a reasonable understanding of the organization<br />
and its activities. Graphics and consolidated data<br />
tables can help make the information in the report<br />
accessible and understandable. The level of aggregation<br />
of information can also affect the clarity of a report<br />
if it is either significantly more or less detailed than<br />
stakeholders expect.<br />
Tests:<br />
R<br />
The report contains the level of information<br />
required by stakeholders, but avoids excessive and<br />
unnecessary detail.<br />
EU<br />
Tests:<br />
R<br />
R<br />
R<br />
Information in the report has been disclosed while<br />
it is recent relative to the reporting period.<br />
The collection and publication of key performance<br />
information is aligned with the sustainability<br />
reporting schedule.<br />
The information in the report (including webbased<br />
reports) clearly indicates the time period to<br />
which it relates, when it will be updated, and when<br />
the last updates were made.<br />
R<br />
R<br />
R<br />
Stakeholders can find the specific information they<br />
want without unreasonable effort through tables<br />
of contents, maps, links, or other aids.<br />
The report avoids technical terms, acronyms,<br />
jargon, or other content likely to be unfamiliar to<br />
stakeholders, and should include explanations<br />
(where necessary) in the relevant section or in a<br />
glossary.<br />
The data and information in the report is available<br />
to stakeholders, including those with particular<br />
accessibility needs (e.g., differing abilities,<br />
language, or technology).<br />
26<br />
© 2000-2009 GRI
Reliability<br />
Definition: Information and processes used in the<br />
preparation of a report should be gathered, recorded,<br />
compiled, analyzed, and disclosed in a way that could be<br />
subject to examination and that establishes the quality<br />
and materiality of the information.<br />
Explanation: Stakeholders should have confidence that<br />
a report could be checked to establish the veracity of its<br />
contents and the extent to which it has appropriately<br />
applied <strong>Reporting</strong> Principles. The information and data<br />
included in a report should be supported by internal<br />
controls or documentation that could be reviewed<br />
by individuals other than those who prepared the<br />
report. Disclosures about performance that are not<br />
substantiated by evidence should not appear in a<br />
sustainability report unless they represent material<br />
information, and the report provides unambiguous<br />
explanations of any uncertainties associated with the<br />
information. The decision-making processes underlying<br />
a report should be documented in a manner that<br />
allows the basis of key decisions (such as processes<br />
for determining the report content and boundary or<br />
stakeholder engagement) to be examined. In designing<br />
information systems, reporting organizations should<br />
anticipate that the systems could be examined as part of<br />
an external assurance process.<br />
Tests:<br />
R<br />
R<br />
R<br />
R<br />
The scope and extent of external assurance is<br />
identified.<br />
The original source of the information in the report<br />
can be identified by the organization.<br />
Reliable evidence to support assumptions or<br />
complex calculations can be identified by the<br />
organization.<br />
Representation is available from the original data<br />
or information owners, attesting to its accuracy<br />
within acceptable margins of error.<br />
Sustainability <strong>Reporting</strong> Guidelines & <strong>Electric</strong> Utility <strong>Sector</strong> <strong>Supplement</strong><br />
1.3 <strong>Reporting</strong> Guidance for<br />
Boundary Setting 6<br />
In parallel with defining the content of a report, an<br />
organization must determine which entities’ (e.g.,<br />
subsidiaries and joint ventures) performance will be<br />
represented by the report. The Sustainability Report<br />
Boundary should include the entities over which the<br />
reporting organization exercises control or significant<br />
influence both in and through its relationships with<br />
various entities upstream (e.g., supply chain) and<br />
downstream (e.g., distribution and customers).<br />
For the purpose of setting boundaries, the following<br />
definitions should apply 7 :<br />
• Control: the power to govern the financial and<br />
operating policies of an enterprise so as to obtain<br />
benefits from its activities.<br />
• Significant influence: the power to participate in<br />
the financial and operating policy decisions of the<br />
entity but not the power to control those policies.<br />
The guidance below on setting the Report Boundary<br />
pertains to the report as a whole as well as setting the<br />
boundary for individual Performance Indicators.<br />
Not all entities within the Report Boundary must be<br />
reported on in the same manner. The approach to<br />
reporting on an entity will depend on a combination<br />
of the reporting organization’s control or influence<br />
over the entity, and whether the disclosure relates to<br />
operational performance, management performance,<br />
or narrative/descriptive information.<br />
The Report Boundary guidance is based on the<br />
recognition that different relationships involve differing<br />
degrees of access to information and the ability to affect<br />
outcomes. For example, operational information such<br />
as emissions data can be reliably compiled from entities<br />
under the control of an organization, but may not be<br />
available for a joint venture or a supplier. The Report<br />
Boundary guidance below sets minimum expectations<br />
for the inclusion of entities upstream and downstream<br />
when reporting on Indicators and management<br />
disclosures. However, an organization may determine<br />
that it is necessary to extend the boundary for an<br />
Indicator(s) to include entities upstream or downstream.<br />
RG<br />
&<br />
EUSS<br />
EU<br />
6<br />
The guidance on Report Boundary has been derived from the Boundary Protocol. Future updates to the Guidelines will<br />
incorporate any further lessons or guidance developed from experience with the <strong>Reporting</strong> Boundary Protocol.<br />
7<br />
Further discussion of these terms can be found in the Boundary Protocol.<br />
RG Version 3.0/EUSS Final Version<br />
27
RG<br />
&<br />
EUSS<br />
Sustainability <strong>Reporting</strong> Guidelines & <strong>Electric</strong> Utility <strong>Sector</strong> <strong>Supplement</strong><br />
Determining the significance of an entity when<br />
collecting information or considering the extension of a<br />
boundary depends on the scale of its sustainability<br />
impacts. Entities with significant impacts typically<br />
generate the greatest risk or opportunity for an<br />
organization and its stakeholders, and therefore are the<br />
entities for which the organization is most likely to be<br />
perceived as being accountable or responsible.<br />
<strong>Reporting</strong> Guidance for Boundary Setting<br />
• A sustainability report should include in its<br />
boundary all entities that generate significant<br />
sustainability impacts (actual and potential) and/or<br />
all entities over which the reporting organization<br />
exercises control or significant influence with regard<br />
to financial and operating policies and practices.<br />
• These entities can be included using either<br />
Indicators of operational performance, Indicators<br />
of management performance, or narrative<br />
descriptions.<br />
• At a minimum, the reporting organization should<br />
include the following entities in its report using<br />
these approaches:<br />
Establishing <strong>Reporting</strong> Boundaries<br />
• Entities over which the organization exercises<br />
control should be covered by Indicators of<br />
Operational Performance; and<br />
• Entities over which the organization exercises<br />
significant influence should be covered by<br />
Disclosures on Management Approach.<br />
EU<br />
No<br />
Do you have control<br />
over the entity?<br />
No<br />
Do you have significant<br />
influence?<br />
Yes<br />
No<br />
Do you have influence?<br />
Yes<br />
Does it have significant<br />
impacts?<br />
No<br />
Exclude<br />
Yes<br />
Does it have significant<br />
impacts?<br />
No<br />
Yes<br />
Not<br />
necessary<br />
to report<br />
No<br />
Does it have significant<br />
impacts?<br />
Yes<br />
Not<br />
necessary<br />
to report<br />
Not<br />
necessary<br />
to report<br />
Yes<br />
Performance Data<br />
Disclosures on Management Approach<br />
Narrative reportinng on Issues and Dilemmas<br />
Figure 6: Decision Tree for Boundary Setting<br />
28<br />
© 2000-2009 GRI
• The boundaries for narrative disclosures should<br />
include entities over which the organization does<br />
not exercise control/significant influence, but<br />
which are associated with key challenges for the<br />
organization because their impacts are significant<br />
• The report should cover all entities within its<br />
Report Boundary. In the process of preparing its<br />
report, an organization may choose not to gather<br />
data on a particular entity or group of entities<br />
within the defined boundary on the basis of<br />
efficiency as long as such a decision does not substantively<br />
change the final result of a Disclosure<br />
or Indicator.<br />
Orientation to the <strong>Reporting</strong> Guidelines<br />
Sustainability <strong>Reporting</strong> Guidelines & <strong>Electric</strong> Utility <strong>Sector</strong> <strong>Supplement</strong><br />
Part 2: Standard Disclosures<br />
This section specifies the base content that should<br />
appear in a sustainability report, subject to the guidance<br />
on determining content in Part 1 of the Guidelines.<br />
There are three different types of disclosures contained<br />
in this section.<br />
• Strategy and Profile: Disclosures that set the<br />
overall context for understanding organizational<br />
performance such as its strategy, profile, and<br />
governance.<br />
• Management Approach: Disclosures that<br />
cover how an organization addresses a given<br />
set of topics in order to provide context for<br />
understanding performance in a specific area.<br />
RG<br />
&<br />
EUSS<br />
• Performance Indicators: Indicators that elicit<br />
comparable information on the economic,<br />
environmental, and social performance of the<br />
Options for <strong>Reporting</strong> organization.<br />
<strong>Reporting</strong> organizations are encouraged to follow<br />
this structure in compiling their reports, however,<br />
other formats may be chosen.<br />
EU<br />
Standard Disclosures<br />
Context<br />
• Strategy & Analysis<br />
• Report Parameters<br />
• Governance,<br />
Commitments, and<br />
Engagement<br />
• Management Approach<br />
Profile<br />
Management<br />
Approach<br />
Performance<br />
Indicators<br />
Results<br />
• Economic<br />
• Environmental<br />
• Labor Practices and<br />
Decent Work<br />
• Human Rights<br />
• Society<br />
• ProductResponsibility<br />
OUTPUT<br />
OUTPUT<br />
OUTPUT<br />
Focused Sustainability Report<br />
Figure 7: Overview of GRI Standard Disclosures<br />
RG Version 3.0/EUSS Final Version<br />
29
RG<br />
&<br />
EUSS<br />
EU<br />
Sustainability <strong>Reporting</strong> Guidelines & <strong>Electric</strong> Utility <strong>Sector</strong> <strong>Supplement</strong><br />
Profile<br />
1. Strategy and Analysis<br />
This section is intended to provide a high-level, strategic<br />
view of the organization’s relationship to sustainability<br />
in order to provide context for subsequent and more<br />
detailed reporting against other sections of the<br />
Guidelines. It may draw on information provided in<br />
other parts of the report, but this section is intended to<br />
produce insight on strategic topics rather than simply<br />
summarize the contents of the report. The strategy and<br />
analysis should consist of the statement outlined in 1.1<br />
and a concise narrative outlined in 1.2.<br />
1.1 Statement from the most senior decisionmaker<br />
of the organization (e.g., CEO, chair, or<br />
equivalent senior position) about the relevance of<br />
sustainability to the organization and its strategy.<br />
The statement should present the overall vision<br />
and strategy for the short-term, medium-term (e.g.,<br />
3-5 years), and long-term, particularly with regard<br />
to managing the key challenges associated with<br />
economic, environmental, and social performance.<br />
The statement should include:<br />
• Strategic priorities and key topics for the short/<br />
medium-term with regard to sustainability,<br />
including respect for internationally agreed<br />
standards and how they relate to long-term<br />
organizational strategy and success;<br />
• Broader trends (e.g., macroeconomic or<br />
political) affecting the organization and<br />
influencing sustainability priorities;<br />
• Key events, achievements, and failures during<br />
the reporting period;<br />
• Views on performance with respect to targets;<br />
• Outlook on the organization’s main challenges<br />
and targets for the next year and goals for the<br />
coming 3-5 years; and<br />
• Other items pertaining to the organization’s<br />
strategic approach.<br />
1.2 Description of key impacts, risks, and opportunities.<br />
The reporting organization should provide two<br />
concise narrative sections on key impacts, risks,<br />
and opportunities.<br />
Section One should focus on the organization’s key<br />
impacts on sustainability and effects on<br />
stakeholders, including rights as defined by<br />
national laws and relevant internationally agreed<br />
standards. This should take into account the range<br />
of reasonable expectations and interests of the<br />
organization’s stakeholders. This section should<br />
include:<br />
• A description of the significant impacts<br />
the organization has on sustainability and<br />
associated challenges and opportunities. This<br />
includes the effect on stakeholders’ rights as<br />
defined by national laws and the expectations<br />
in internationally-agreed standards and norms;<br />
• An explanation of the approach to prioritizing<br />
these challenges and opportunities;<br />
• Key conclusions about progress in addressing<br />
these topics and related performance in the<br />
reporting period. This includes an assessment<br />
of reasons for underperformance or overperformance;<br />
and<br />
• A description of the main processes in place to<br />
address performance and/or relevant changes.<br />
Section Two should focus on the impact of<br />
sustainability trends, risks, and opportunities on<br />
the long-term prospects and financial performance<br />
of the organization. This should concentrate<br />
specifically on information relevant to financial<br />
stakeholders or that could become so in the future.<br />
Section Two should include the following:<br />
• A description of the most important risks and<br />
opportunities for the organization arising from<br />
sustainability trends;<br />
• Prioritization of key sustainability topics as<br />
risks and opportunities according to their<br />
relevance for long-term organizational<br />
strategy, competitive position, qualitative, and<br />
(if possible) quantitative financial value drivers;<br />
30<br />
© 2000-2009 GRI
Sustainability <strong>Reporting</strong> Guidelines & <strong>Electric</strong> Utility <strong>Sector</strong> <strong>Supplement</strong><br />
RG<br />
&<br />
EUSS<br />
• Table(s) summarizing:<br />
• Targets, performance against targets, and<br />
lessons-learned for the current reporting<br />
period; and<br />
• Targets for the next reporting period and<br />
mid-term objectives and goals (i.e., 3-5<br />
years) related to key risks and opportunities.<br />
• Concise description of governance mechanisms<br />
in place to specifically manage these risks and<br />
opportunities, and identification of other related<br />
risks and opportunities.<br />
2. Organizational Profile<br />
2.1 Name of the organization.<br />
2.2 Primary brands, products, and/or services.<br />
The reporting organization should indicate the<br />
nature of its role in providing these products<br />
and services, and the degree to which it utilizes<br />
outsourcing.<br />
2.3 Operational structure of the organization,<br />
including main divisions, operating companies,<br />
subsidiaries, and joint ventures.<br />
2.4 Location of organization’s headquarters.<br />
2.5 Number of countries where the organization<br />
operates, and names of countries with either major<br />
operations or that are specifically relevant to the<br />
sustainability issues covered in the report.<br />
2.6 Nature of ownership and legal form.<br />
2.7 Markets served (including geographic breakdown,<br />
sectors served, and types of customers/beneficiaries).<br />
2.8 Scale of the reporting organization, including:<br />
• Number of employees;<br />
• Net sales (for private sector organizations) or<br />
net revenues (for public sector organizations);<br />
• Total capitalization broken down in terms<br />
of debt and equity (for private sector<br />
organizations); and<br />
In addition to the above, reporting organizations are<br />
encouraged to provide additional information, as<br />
appropriate, such as:<br />
• Total assets;<br />
• Beneficial ownership (including identity and<br />
percentage of ownership of largest shareholders);<br />
and<br />
• Breakdowns by country/region of the following:<br />
• Sales/revenues by countries/regions that<br />
make up 5 percent or more of total revenues;<br />
• Costs by countries/regions that make up 5<br />
percent or more of total revenues; and<br />
• Employees.<br />
2.9 Significant changes during the reporting period<br />
regarding size, structure, or ownership including:<br />
• The location of, or changes in operations,<br />
including facility openings, closings, and<br />
expansions; and<br />
• Changes in the share capital structure and<br />
other capital formation, maintenance, and<br />
alteration operations (for private sector<br />
organizations).<br />
2.10 Awards received in the reporting period.<br />
<strong>Electric</strong> Utility <strong>Sector</strong>-Specific Organizational<br />
Profile Disclosures<br />
EU1. Installed capacity, broken down by primary energy<br />
source and by regulatory regime.<br />
EU2. Net energy output broken down by primary<br />
energy source and by regulatory regime.<br />
EU3. Number of residential, industrial, institutional and<br />
commercial customer accounts.<br />
EU4. Length of above and underground transmission<br />
and distribution lines by regulatory regime.<br />
EU5. Allocation of CO 2<br />
e emissions allowances or<br />
equivalent, broken down by carbon trading<br />
framework.<br />
EU<br />
EU<br />
• Quantity of products or services provided.<br />
RG Version 3.0/EUSS Final Version<br />
31
RG<br />
&<br />
EUSS<br />
EU<br />
Sustainability <strong>Reporting</strong> Guidelines & <strong>Electric</strong> Utility <strong>Sector</strong> <strong>Supplement</strong><br />
Profile<br />
<strong>Electric</strong> Utility <strong>Sector</strong>-Specific Organizational<br />
Profile Protocols<br />
In addition to the disclosure items in the Organizational<br />
Profile found in the G3 Guidelines, electric utilities<br />
should also provide the following information specific to<br />
the sector.<br />
EU1:<br />
Installed capacity, broken down by primary energy<br />
source and by regulatory regime.<br />
1. Relevance<br />
The installed capacity of the reporting<br />
organization broken down by primary energy<br />
source and by regulatory regime, shows<br />
in more detail the reporting organization’s<br />
operations within a regulatory regime or<br />
geographic context. An understanding of<br />
installed capacity provides an initial indication<br />
of the environmental, social and economic<br />
impacts likely to arise from a given power<br />
generation portfolio based on footprint of<br />
infrastructure.<br />
The breakdown by regulatory regime or<br />
geographic context is necessary as it provides<br />
a consistent framework for measuring and<br />
reporting of utility activities.<br />
2. Compilation<br />
2.1 Describe the fuels used and the capacity of<br />
multi-fuel plants.<br />
2.2 For combined heat and power plants, the<br />
reporting organization should report nominal<br />
electricity capacity and heat capacity (MW).<br />
2.3 Report installed capacity of the utility in MW.<br />
This should be broken down by the total<br />
installed capacity, installed capacity by energy<br />
source and installed capacity by regulatory<br />
regime.<br />
3. Definitions<br />
Refer to G3 definition of Primary (Energy)<br />
Source.<br />
Regulatory Regime<br />
A regulatory regime is defined as a local, subnational,<br />
national or regional area where there<br />
is a common regulatory framework.<br />
EU<br />
Capacity<br />
Capacity is the maximum amount of power, in MW,<br />
that an entity can produce. <strong>Utilities</strong> are asked to report<br />
net capacity, i. e. maximum capacity a power station is<br />
designed to deliver to the grid. Internal use of electricity<br />
for auxiliary systems is excluded.<br />
EU2:<br />
Net energy output broken down by primary<br />
energy source and by regulatory regime.<br />
1. Relevance<br />
The net energy output of the reporting<br />
organization broken down by primary energy<br />
source and by regulatory regime or geographic<br />
context, shows in more detail the reporting<br />
organization’s operations. An understanding<br />
of net energy output provides an indication<br />
of the environmental, social and economic<br />
impacts likely to arise from a given power<br />
generation portfolio based on actual output.<br />
The breakdown by regulatory regime or<br />
geographic context is necessary as it provides<br />
a consistent framework for measuring and<br />
reporting of utility activities.<br />
This relates to EN3 which considers energy<br />
consumption.<br />
2. Compilation<br />
2.1 Describe net energy generated by the utility<br />
in GWh or GJ (for where heat is a secondary<br />
product). This should be broken down by<br />
primary energy source and by regulatory<br />
regime.<br />
3. Definitions<br />
Refer to G3 definition of Primary (Energy)<br />
Source.<br />
Regulatory Regime<br />
A regulatory regime is defined as a local, subnational,<br />
national or regional area where there<br />
is a common regulatory framework.<br />
4. Documentation<br />
None.<br />
5. References<br />
None.<br />
32<br />
© 2000-2009 GRI
EU3:<br />
Number of residential, industrial, institutional and<br />
commercial customer accounts.<br />
1. Relevance<br />
The number of residential, industrial,<br />
institutional and customer accounts gives an<br />
overall view on the scale of business generated<br />
by the reporting organisation. This indicator<br />
shows the scale of the business from the<br />
point of view of the number of customers,<br />
as opposed to EU1 which shows generation<br />
capacity and EU4 which shows the extent<br />
of the energy transmission and distribution<br />
infrastructure. This information also provides<br />
information on the growth patterns of the<br />
company over time.<br />
2. Compilation<br />
2.1 A customer account may include more than<br />
one connection. Types of account include<br />
residential, industrial, commercial, and<br />
institutional. The reporting organization may<br />
wish to report this information, expanding on<br />
the table below.<br />
EU<br />
Sustainability <strong>Reporting</strong> Guidelines & <strong>Electric</strong> Utility <strong>Sector</strong> <strong>Supplement</strong><br />
EU4:<br />
4. Documentation<br />
Information sources include billing<br />
department, finance department or the annual<br />
report.<br />
5. References<br />
None.<br />
Length of above and underground transmission<br />
and distribution lines by regulatory regime.<br />
1. Relevance<br />
The length of transmission and distribution<br />
lines shows the extent of the reporting<br />
organisation’s energy transmission and<br />
distribution infrastructure as opposed to EU1<br />
which shows generation capacity and EU3<br />
which shows the scale of the business from the<br />
point of view of the number of customers. It<br />
also gives an impression on the overall scale of<br />
the utility. Annual figures enable assessments<br />
to be made on the growth or decline of the<br />
infrastructure in place.<br />
2. Compilation<br />
RG<br />
&<br />
EUSS<br />
2.2 The reporting company should clearly define<br />
the types of account they are reporting<br />
(This should include any additional account<br />
types not listed in the table).<br />
2.1 Identify the range of voltage levels used to<br />
categorise transmission and distribution lines<br />
2.2. Declare any assumptions made for estimates of<br />
circuit lengths.<br />
EU<br />
2.3 Report the total number of accounts by type<br />
and by point of connection (e.g. transmission,<br />
or distribution) and customers who are also<br />
producers (i.e. customers who use distributed<br />
generation).<br />
2.3 Report aggregated circuit lengths in km, by<br />
regulatory regime, voltage category, and<br />
overhead and/or underground.<br />
3. Definitions<br />
Number of accounts<br />
by type and point of<br />
Point of connection<br />
connection<br />
Type of account Transmission Distribution<br />
Residential<br />
Industrial<br />
Commercial<br />
Institutional<br />
3. Definitions<br />
Customer accounts<br />
Customer accounts refer to number of<br />
connections to the grid.<br />
Circuit length<br />
Circuit length is the length of one circuit<br />
consisting of 3 cables between two rail<br />
systems. Usually electricity is transported and<br />
distributed as 3 phase high voltage AC. One<br />
circuit consists of three cables each bearing<br />
one phase. As the three cables form a physical<br />
entity, circuit length is defined as the length<br />
of one entity between two rail systems. i. e.<br />
in case where there are two circuits of 2 km<br />
on the same track this means 2X2 km = 4<br />
km. In the case of High Voltage DC the same<br />
definition applies independently of a single<br />
line or bipolar layout of the transmission line.<br />
RG Version 3.0/EUSS Final Version<br />
33
RG<br />
&<br />
EUSS<br />
Sustainability <strong>Reporting</strong> Guidelines & <strong>Electric</strong> Utility <strong>Sector</strong> <strong>Supplement</strong><br />
Transmission Lines<br />
Transmission lines transfer electrical power<br />
from power stations to substations.<br />
Distribution Lines<br />
Distribution lines transfer electrical power from<br />
substations to customers.<br />
EU<br />
2.2 Report quantitatively potential CO 2<br />
e emission<br />
allocations or the emission reduction targets<br />
that are likely to be required of the reporting<br />
organization. If CO 2<br />
e emission allowances have<br />
been allocated by assignment or auctioned, by<br />
a public sector body, they should be reported<br />
by regulatory regime.<br />
EU5:<br />
4. Documentation<br />
None.<br />
5. References<br />
None.<br />
Allocation of CO 2<br />
e emissions allowances or<br />
equivalent, broken down by carbon trading<br />
framework.<br />
1. Relevance<br />
2.3 Report percentage of allowances allocated for<br />
free and percentage auctioned.<br />
3. Definitions<br />
Carbon trading framework<br />
Carbon trading framework refers to local, subnational,<br />
national or regional initiatives which<br />
establish an emissions trading scheme.<br />
Allowances<br />
EU<br />
There are numerous national and international<br />
regulations and incentive systems (such as<br />
trading or carbon certificating) designed to<br />
control the volume and reward the reduction<br />
of CO 2<br />
equivalents. By monitoring and setting<br />
reduction targets, emissions can be reduced<br />
effectively (e.g., by carefully selecting energyefficient<br />
materials, services, or production<br />
capabilities).<br />
CO 2<br />
e emissions allowances can be auctioned<br />
or allocated for free, impacting the cost burden<br />
to utilities. <strong>Reporting</strong> on the allocation of CO 2<br />
e<br />
emission allowances for a utility, illustrates<br />
the exposure the organization has to current<br />
or future national and international climate<br />
change policies. It also provides an illustration<br />
of the strategy used by the organization<br />
to manage CO 2<br />
e emissions (e.g. buying<br />
allowances from companies that do not use<br />
their full allocation of CO 2<br />
e emissions, or selling<br />
to those that have exceeded their allocation).<br />
This indicator is only relevant to those<br />
organisations operating in markets with either<br />
voluntary or legally-binding CO 2<br />
e trading<br />
schemes.<br />
2. Compilation<br />
2.1 Report qualitatively how the reporting<br />
organization is covered by emissions trading<br />
schemes or alternative requirements for<br />
managing CO 2<br />
e emissions.<br />
An allowance represents a fixed quantity of<br />
CO 2<br />
e. These are the units which are capped,<br />
traded and surrendered in an emissions<br />
scheme. Allowances are also sometimes known<br />
as permits, certificates, credits, or allocations.<br />
Auctioning<br />
In an emissions trading scheme, auctioning<br />
is an allocation method by which CO 2<br />
e<br />
certificates are sold to the participants to the<br />
highest bidders, as opposed to allocating them<br />
for free.<br />
CO 2<br />
e<br />
CO 2<br />
(Carbon Dioxide) equivalent is the measure<br />
used to compare the emissions from various<br />
greenhouse gases based on their global<br />
warming potential (GWP). The CO 2<br />
equivalent<br />
for a gas is derived by multiplying the tonnes<br />
of the gas by the associated GWP.<br />
6. Documentation<br />
None.<br />
7. References<br />
None.<br />
34<br />
© 2000-2009 GRI
3. Report Parameters<br />
Report Profile<br />
3.1 <strong>Reporting</strong> period (e.g., fiscal/calendar year) for<br />
information provided.<br />
3.2 Date of most recent previous report (if any).<br />
3.3 <strong>Reporting</strong> cycle (annual, biennial, etc.)<br />
3.4 Contact point for questions regarding the report or<br />
its contents.<br />
Report Scope and Boundary<br />
3.5 Process for defining report content, including:<br />
• Determining materiality;<br />
• Prioritizing topics within the report; and<br />
• Identifying stakeholders the organization<br />
expects to use the report.<br />
Include an explanation of how the organization has<br />
applied the ‘Guidance on Defining Report Content’<br />
and the associated Principles.<br />
3.6 Boundary of the report (e.g., countries, divisions,<br />
subsidiaries, leased facilities, joint ventures, suppliers).<br />
See GRI Boundary Protocol for further guidance.<br />
3.7 State any specific limitations on the scope or<br />
boundary of the report 8 .<br />
If boundary and scope do not address the full range<br />
of material economic, environmental, and social<br />
impacts of the organization, state the strategy and<br />
projected timeline for providing complete coverage.<br />
3.8 Basis for reporting on joint ventures, subsidiaries,<br />
leased facilities, outsourced operations, and other<br />
entities that can significantly affect comparability<br />
from period to period and/or between organizations.<br />
3.9 Data measurement techniques and the bases of<br />
calculations, including assumptions and techniques<br />
underlying estimations applied to the compilation of<br />
the Indicators and other information in the report.<br />
Explain any decisions not to apply, or to substantially<br />
diverge from, the GRI Indicator Protocols.<br />
Sustainability <strong>Reporting</strong> Guidelines & <strong>Electric</strong> Utility <strong>Sector</strong> <strong>Supplement</strong><br />
3.10 Explanation of the effect of any re-statements<br />
of information provided in earlier reports, and<br />
the reasons for such re-statement (e.g., mergers/<br />
acquisitions, change of base years/periods, nature<br />
of business, measurement methods).<br />
3.11 Significant changes from previous reporting<br />
periods in the scope, boundary, or measurement<br />
methods applied in the report.<br />
GRI Content Index<br />
3.12 Table identifying the location of the Standard<br />
Disclosures in the report.<br />
Identify the page numbers or web links where the<br />
following can be found:<br />
• Strategy and Analysis 1.1 – 1.2;<br />
• Organizational Profile 2.1 – 2.10;<br />
• Report Parameters 3.1 – 3.13;<br />
• Governance, Commitments, and Engagement<br />
4.1 – 4.17;<br />
• Disclosure of Management Approach, per<br />
category;<br />
• Core Performance Indicators;<br />
• Any GRI Additional Indicators that were<br />
included; and<br />
• Any GRI <strong>Sector</strong> <strong>Supplement</strong> Indicators<br />
included in the report.<br />
Assurance<br />
3.13 Policy and current practice with regard to seeking<br />
external assurance for the report. If not included<br />
in the assurance report accompanying the<br />
sustainability report, explain the scope and basis of<br />
any external assurance provided. Also explain the<br />
relationship between the reporting organization<br />
and the assurance provider(s).<br />
4. Governance, Commitments, and Engagement<br />
Governance<br />
4.1 Governance structure of the organization, including<br />
committees under the highest governance body<br />
responsible for specific tasks, such as setting<br />
strategy or organizational oversight.<br />
RG<br />
&<br />
EUSS<br />
EU<br />
8<br />
See completeness Principle for explanation of scope.<br />
RG Version 3.0/EUSS Final Version<br />
35
RG<br />
&<br />
EUSS<br />
Sustainability <strong>Reporting</strong> Guidelines & <strong>Electric</strong> Utility <strong>Sector</strong> <strong>Supplement</strong><br />
EU<br />
Describe the mandate and composition (including<br />
number of independent members and/or nonexecutive<br />
members) of such committees and indicate<br />
any direct responsibility for economic, social, and<br />
environmental performance.<br />
4.2 Indicate whether the Chair of the highest<br />
governance body is also an executive officer<br />
(and, if so, their function within the organization’s<br />
management and the reasons for this arrangement).<br />
4.3 For organizations that have a unitary board<br />
structure, state the number of members of the<br />
highest governance body that are independent<br />
and/or non-executive members.<br />
State how the organization defines ‘independent’<br />
and ‘non-executive’. This element applies only for<br />
organizations that have unitary board structures.<br />
See the glossary for a definition of ‘independent’.<br />
4.4 Mechanisms for shareholders and employees to<br />
provide recommendations or direction to the<br />
highest governance body.<br />
Include reference to processes regarding:<br />
• The use of shareholder resolutions or<br />
other mechanisms for enabling minority<br />
shareholders to express opinions to the<br />
highest governance body; and<br />
• Informing and consulting employees about<br />
the working relationships with formal<br />
representation bodies such as organization<br />
level ‘work councils’, and representation of<br />
employees in the highest governance body.<br />
Identify topics related to economic, environmental,<br />
and social performance raised through these<br />
mechanisms during the reporting period.<br />
4.5 Linkage between compensation for members<br />
of the highest governance body, senior<br />
managers, and executives (including departure<br />
arrangements), and the organization’s<br />
performance (including social and environmental<br />
performance).<br />
4.6 Processes in place for the highest governance<br />
body to ensure conflicts of interest are avoided.<br />
4.7 Process for determining the qualifications<br />
and expertise of the members of the highest<br />
governance body for guiding the organization’s<br />
strategy on economic, environmental, and social<br />
topics.<br />
4.8 Internally developed statements of mission or<br />
values, codes of conduct, and principles relevant to<br />
economic, environmental, and social performance<br />
and the status of their implementation.<br />
Explain the degree to which these:<br />
• Are applied across the organization in different<br />
regions and department/units; and<br />
• Relate to internationally agreed standards.<br />
4.9 Procedures of the highest governance body for<br />
overseeing the organization’s identification and<br />
management of economic, environmental, and<br />
social performance, including relevant risks and<br />
opportunities, and adherence or compliance<br />
with internationally agreed standards, codes of<br />
conduct, and principles.<br />
Include frequency with which the highest<br />
governance body assesses sustainability<br />
performance.<br />
4.10 Processes for evaluating the highest governance<br />
body’s own performance, particularly with respect to<br />
economic, environmental, and social performance.<br />
Commitments to External <strong>Initiative</strong>s<br />
4.11 Explanation of whether and how the precautionary<br />
approach or principle is addressed by the<br />
organization.<br />
Article 15 of the Rio Principles introduced the<br />
precautionary approach. A response to 4.11<br />
could address the organization’s approach to<br />
risk management in operational planning or the<br />
development and introduction of new products.<br />
4.12 Externally developed economic, environmental,<br />
and social charters, principles, or other initiatives<br />
to which the organization subscribes or endorses.<br />
Include date of adoption, countries/operations<br />
where applied, and the range of stakeholders<br />
involved in the development and governance<br />
of these initiatives (e.g., multi-stakeholder, etc.).<br />
Differentiate between non-binding, voluntary<br />
36<br />
© 2000-2009 GRI
Sustainability <strong>Reporting</strong> Guidelines & <strong>Electric</strong> Utility <strong>Sector</strong> <strong>Supplement</strong><br />
RG<br />
&<br />
EUSS<br />
initiatives and those with which the organization<br />
has an obligation to comply.<br />
4.13 Memberships in associations (such as industry<br />
associations) and/or national/international<br />
advocacy organizations in which the<br />
organization:<br />
• Has positions in governance bodies;<br />
• Participates in projects or committees;<br />
• Provides substantive funding beyond routine<br />
membership dues; or<br />
• Views membership as strategic.<br />
This refers primarily to memberships maintained at<br />
the organizational level.<br />
Stakeholder Engagement<br />
The following Disclosure Items refer to general<br />
stakeholder engagement conducted by the organization<br />
over the course of the reporting period. These<br />
Disclosures are not limited to stakeholder engagement<br />
implemented for the purposes of preparing a<br />
sustainability report.<br />
4.14 List of stakeholder groups engaged by the<br />
organization.<br />
Examples of stakeholder groups are:<br />
• Communities;<br />
• Civil society;<br />
• Customers;<br />
• Shareholders and providers of capital;<br />
• Suppliers; and<br />
• Employees, other workers, and their trade<br />
unions.<br />
4.15 Basis for identification and selection of<br />
stakeholders with whom to engage.<br />
This includes the organization’s process for defining<br />
its stakeholder groups, and for determining the<br />
groups with which to engage and not to engage.<br />
4.16 Approaches to stakeholder engagement, including<br />
frequency of engagement by type and by<br />
stakeholder group.<br />
This could include surveys, focus groups, community<br />
panels, corporate advisory panels, written<br />
communication, management/union structures,<br />
and other vehicles. The organization should indicate<br />
whether any of the engagement was undertaken<br />
specifically as part of the report preparation process.<br />
4.17 Key topics and concerns that have been raised<br />
through stakeholder engagement, and how the<br />
organization has responded to those key topics<br />
and concerns, including through its reporting.<br />
5. Management Approach and Performance<br />
Indicators<br />
The section on sustainability Performance Indicators<br />
is organized by economic, environmental, and social<br />
categories. Social Indicators are further categorized<br />
by Labor, Human Rights, Society, and Product<br />
Responsibility. Each category includes a Disclosure on<br />
Management Approach (‘Management Approach’) and<br />
a corresponding set of Core and Additional Performance<br />
Indicators.<br />
Core Indicators have been developed through GRI’s<br />
multi-stakeholder processes, which are intended to<br />
identify generally applicable Indicators and are assumed<br />
to be material for most organizations. An organization<br />
should report on Core Indicators unless they are<br />
deemed not material on the basis of the GRI <strong>Reporting</strong><br />
Principles. Additional Indicators represent emerging<br />
practice or address topics that may be material for some<br />
organizations, but are not material for others. Where<br />
final versions of <strong>Sector</strong> <strong>Supplement</strong>s exist, the Indicators<br />
should be treated as Core Indicators. See Guidance on<br />
Defining Report Content for further details.<br />
The Disclosure(s) on Management Approach should<br />
provide a brief overview of the organization’s<br />
management approach to the Aspects defined under<br />
each Indicator Category in order to set the context for<br />
performance information. The organization can structure<br />
its Disclosure(s) on Management Approach to cover the<br />
full range of Aspects under a given Category or group<br />
its responses on the Aspects differently. However, the<br />
Disclosure should address all of the Aspects associated<br />
with each category regardless of the format or grouping.<br />
EU<br />
RG Version 3.0/EUSS Final Version<br />
37
RG<br />
&<br />
EUSS<br />
EU<br />
Sustainability <strong>Reporting</strong> Guidelines & <strong>Electric</strong> Utility <strong>Sector</strong> <strong>Supplement</strong><br />
Within the overall structure of the Standard Disclosures,<br />
Strategy and Profile items 1.1 and 1.2 in ‘Strategy and<br />
Analysis’ are intended to provide a concise overview of<br />
the risks and opportunities facing the organization as<br />
a whole. The Disclosure(s) on Management Approach<br />
is intended to address the next level of detail of the<br />
organization’s approach to managing the sustainability<br />
topics associated with risks and opportunities.<br />
In reporting on the Performance Indicators, the<br />
following guidance on data compilation applies:<br />
• <strong>Reporting</strong> on Trends: Information should be<br />
presented for the current reporting period (e.g.,<br />
one year) and at least two previous periods, as<br />
well as future targets, where they have been<br />
established, for the short- and medium-term.<br />
• Use of Protocols: Organizations should use<br />
the Protocols that accompany the Indicators<br />
when reporting on the Indicators. These give<br />
basic guidance on interpreting and compiling<br />
information.<br />
• Presentation of Data: In some cases, ratios<br />
or normalized data are useful and appropriate<br />
formats for data presentation. If ratios or<br />
normalized data are used, absolute data should<br />
also be provided.<br />
• Data aggregation: <strong>Reporting</strong> organizations<br />
should determine the appropriate level of<br />
aggregation of information. See additional<br />
guidance in the General <strong>Reporting</strong> Notes section<br />
of the Guidelines.<br />
• Metrics: Reported data should be presented<br />
using generally accepted international metrics<br />
(e.g., kilograms, tonnes, litres) and calculated<br />
using standard conversion factors. Where specific<br />
international conventions exist (e.g., GHG<br />
equivalents), these are typically specified in the<br />
Indicator Protocols.<br />
Economic<br />
The economic dimension of sustainability concerns the<br />
organization’s impacts on the economic conditions of its<br />
stakeholders and on economic systems at local, national,<br />
and global levels. The Economic Indicators illustrate:<br />
• Flow of capital among different stakeholders; and<br />
• Main economic impacts of the organization<br />
throughout society.<br />
Financial performance is fundamental to understanding<br />
an organization and its own sustainability. However,<br />
this information is normally already reported in<br />
financial accounts. What is often reported less, and is<br />
frequently desired by users of sustainability reports, is<br />
the organization’s contribution to the sustainability of a<br />
larger economic system.<br />
Disclosure on Management Approach<br />
Provide a concise disclosure on the Management<br />
Approach items outlined below with reference to the<br />
following Economic Aspects:<br />
• Economic Performance;<br />
• Market Presence; and<br />
• Indirect Economic Impacts.<br />
• Availability and Reliability;<br />
• Demand-Side Management;<br />
• System Efficiency;<br />
• Research and Development; and<br />
• Plant Decommissioning.<br />
Goals and Performance<br />
Organization-wide goals regarding performance<br />
relevant to the Economic Aspects.<br />
Use organization-specific Indicators (as needed)<br />
in addition to the GRI Performance Indicators to<br />
demonstrate the results of performance against goals.<br />
EU<br />
Policy<br />
Brief, organization-wide policy (or policies) that defines<br />
the organization’s overall commitment relating to the<br />
Economic Aspects listed above, or state where this can<br />
be found in the public domain (e.g., web link).<br />
38<br />
© 2000-2009 GRI
Additional Contextual Information<br />
Additional relevant information required to understand<br />
organizational performance, such as:<br />
• Key successes and shortcomings;<br />
• Major organizational risks and opportunities;<br />
• Major changes in the reporting period to systems<br />
or structures to improve performance; and<br />
• Key strategies for implementing policies or<br />
achieving performance.<br />
<strong>Electric</strong> Utility <strong>Sector</strong>-Specific Disclosure on<br />
Management Approach<br />
Aspect: Availability and Reliability<br />
EU6. Management approach to ensure short and<br />
long-term electricity availability and reliability.<br />
Co r e<br />
Aspect: Demand-Side Management<br />
EU7. Demand-side management programs<br />
including residential, commercial, institutional<br />
and industrial programs.<br />
Co r e<br />
Aspect: Research and Development<br />
EU8. Research and development activity and<br />
expenditure aimed at providing reliable<br />
electricity and promoting sustainable<br />
development.<br />
Co r e<br />
Aspect: Plant Decommissioning<br />
EU9. Provisions for decommissioning of nuclear<br />
power sites.<br />
Co r e<br />
Economic Performance Indicators<br />
Aspect: Economic Performance<br />
Co r e<br />
EC1<br />
Direct economic value generated and<br />
distributed, including revenues, operating<br />
costs, employee compensation, donations<br />
and other community investments, retained<br />
earnings, and payments to capital providers<br />
and governments.<br />
EU<br />
Sustainability <strong>Reporting</strong> Guidelines & <strong>Electric</strong> Utility <strong>Sector</strong> <strong>Supplement</strong><br />
Co r e<br />
EC4<br />
Significant financial assistance received from<br />
government.<br />
Aspect: Market Presence<br />
A d d<br />
Co r e<br />
Co r e<br />
EC5<br />
EC6<br />
EC7<br />
Range of ratios of standard entry level<br />
wage compared to local minimum wage at<br />
significant locations of operation.<br />
Policy, practices, and proportion of spending<br />
on locally-based suppliers at significant<br />
locations of operation.<br />
Procedures for local hiring and proportion<br />
of senior management hired from the<br />
local community at locations of significant<br />
operation.<br />
Aspect: Indirect Economic Impacts<br />
Co r e<br />
A d d<br />
EC8<br />
EC9<br />
Development and impact of infrastructure<br />
investments and services provided primarily<br />
for public benefit through commercial, inkind,<br />
or pro bono engagement.<br />
Understanding and describing significant<br />
indirect economic impacts, including the<br />
extent of impacts.<br />
<strong>Electric</strong> Utility <strong>Sector</strong>- Specific Economic<br />
Performance Indicators<br />
Aspect: Availability and Reliability<br />
EU10. Planned capacity against projected electricity<br />
demand over the long term, broken down by<br />
energy source and regulatory regime.<br />
Co r e<br />
Aspect: System Efficiency<br />
EU11. Average generation efficiency of thermal plants<br />
by energy source and by regulatory regime.<br />
Co r e<br />
Co r e<br />
EU12. Transmission and distribution losses as a<br />
percentage of total energy.<br />
EU<br />
RG<br />
&<br />
EUSS<br />
EU<br />
Co r e<br />
EC2<br />
Financial implications and other risks and<br />
opportunities for the organization’s activities<br />
due to climate change.<br />
Co r e<br />
EC3<br />
Coverage of the organization’s defined benefit<br />
plan obligations.<br />
RG Version 3.0/EUSS Final Version<br />
39
RG<br />
&<br />
EUSS<br />
EU<br />
Sustainability <strong>Reporting</strong> Guidelines & <strong>Electric</strong> Utility <strong>Sector</strong> <strong>Supplement</strong><br />
Environmental<br />
The environmental dimension of sustainability concerns<br />
an organization’s impacts on living and non-living<br />
natural systems, including ecosystems, land, air, and<br />
water. Environmental Indicators cover performance<br />
related to inputs (e.g., material, energy, water) and<br />
outputs (e.g., emissions, effluents, waste). In addition,<br />
they cover performance related to biodiversity,<br />
environmental compliance, and other relevant<br />
information such as environmental expenditure and the<br />
impacts of products and services.<br />
Disclosure on Management Approach<br />
Provide a concise disclosure on the Management<br />
Approach items outlined below with reference to the<br />
following Environmental Aspects:<br />
• Materials;<br />
<strong>Electric</strong> Utility <strong>Sector</strong>-Specific Commentary:<br />
Long-term strategy for managing and phasing out<br />
high level and low level in-service PCBs.<br />
Compilation:<br />
Identify high level and low level as defined by the<br />
reporting organization according to prevailing EU<br />
national or regional standards. Use >500 ppm as<br />
the high level threshold in the absence of such<br />
standards. <strong>Reporting</strong> threshold for low level should<br />
be according to the prevailing national/regional<br />
standards or, if no standards exist, between 50 and<br />
500 ppm.<br />
• Energy;<br />
• Water;<br />
<strong>Electric</strong> Utility <strong>Sector</strong>-Specific Commentary:<br />
At the watershed or hydrological basin level,<br />
include collaborative approaches to managing<br />
watersheds and reservoirs for multiple uses (e.g.,<br />
irrigation, drinking water, ecosystem conservation,<br />
etc.). Also report long-term planning for securing<br />
EU<br />
water resources, for meeting the needs of both<br />
the utility and other stakeholders (e.g. local<br />
communities). This includes describing the criteria<br />
for managing maximum/minimum flow of surface<br />
water and volume of ground water and how these<br />
are determined and maintained<br />
• Biodiversity;<br />
<strong>Electric</strong> Utility <strong>Sector</strong>-Specific Commentary:<br />
Report approaches for pest and vegetation<br />
management along transmission and distribution<br />
corridors (e.g., use of Integrated Pest Management<br />
and Integrated Vegetation Management).<br />
EU<br />
• Emissions, Effluents, and Waste;<br />
<strong>Electric</strong> Utility <strong>Sector</strong>-Specific Commentary:<br />
Management strategy and storage methods<br />
for different types of radioactive nuclear waste,<br />
including:<br />
• Temporary and permanent storage;<br />
• Environmental, health and safety impacts of<br />
radioactive nuclear waste; and<br />
• Security measures according to the applicable<br />
management standards/legislative framework. EU<br />
Compilation:<br />
Radioactive nuclear waste includes Low Level<br />
Radioactive Waste, Intermediate Level. Radioactive<br />
Waste and High Level Radioactive Waste. Include<br />
mixed waste (radioactive and hazardous). Use IAEA<br />
definitions.<br />
• Products and Services;<br />
• Compliance;<br />
• Transport; and<br />
• Overall<br />
Goals and Performance<br />
Organization-wide goals regarding performance<br />
relevant to the Environment Aspects.<br />
Use organization-specific Indicators (as needed)<br />
in addition to the GRI Performance Indicators to<br />
demonstrate the results of performance against goals.<br />
Policy<br />
Brief, organization-wide policy (or policies) that defines<br />
the organization’s overall commitment related to the<br />
Environmental Aspects listed above or state where this<br />
can be found in the public domain (e.g., web link).<br />
Organizational responsibility<br />
The most senior position with operational responsibility<br />
for Environmental Aspects or explain how operational<br />
responsibility is divided at the senior level for these<br />
Aspects. This differs from Disclosure 4.1, which focuses<br />
on structures at the governance level.<br />
Training and awareness<br />
Procedures related to training and raising awareness in<br />
relation to the Environmental Aspects.<br />
40<br />
© 2000-2009 GRI
Monitoring and Follow-Up<br />
Procedures related to monitoring and corrective and<br />
preventive actions, including those related to the<br />
supply chain.<br />
List of certifications for environment-related<br />
performance or certification systems, or other<br />
approaches to auditing/verification for the reporting<br />
organization or its supply chain.<br />
Additional Contextual Information<br />
Additional relevant information required to understand<br />
organizational performance, such as:<br />
• Key successes and shortcomings;<br />
• Major organizational environmental risks and<br />
opportunities related to issues;<br />
Sustainability <strong>Reporting</strong> Guidelines & <strong>Electric</strong> Utility <strong>Sector</strong> <strong>Supplement</strong><br />
Environmental Performance Indicators<br />
Aspect: Materials<br />
EN1 Materials used by weight or volume.<br />
Co r e<br />
EU<br />
Co r e<br />
EN2<br />
<strong>Electric</strong> Utility <strong>Sector</strong>-Specific Commentary on<br />
EN1 Indicator Protocol:<br />
Report in-use inventory of solid and liquid<br />
high level and low level PCBs contained in<br />
equipment.<br />
Aspect: Energy<br />
Co r e<br />
EN3<br />
Percentage of materials used that are recycled<br />
input materials.<br />
Direct energy consumption by primary energy<br />
source.<br />
RG<br />
&<br />
EUSS<br />
• Major changes in the reporting period to systems<br />
or structures to improve performance; and<br />
Co r e<br />
EN4<br />
Indirect energy consumption by primary<br />
source.<br />
• Key strategies and procedures for implementing<br />
policies or achieving goals.<br />
A d d<br />
EN5<br />
Energy saved due to conservation and<br />
efficiency improvements.<br />
A d d<br />
EN6<br />
<strong>Initiative</strong>s to provide energy-efficient<br />
or renewable energy based products<br />
and services, and reductions in energy<br />
requirements as a result of these initiatives.<br />
EU<br />
A d d<br />
EN7<br />
<strong>Initiative</strong>s to reduce indirect energy<br />
consumption and reductions achieved.<br />
Aspect: Water<br />
Co r e<br />
EN8<br />
Total water withdrawal by source.<br />
EU<br />
<strong>Electric</strong> Utility <strong>Sector</strong>-Specific Commentary on<br />
EN8 Indicator Protocol:<br />
Report overall water usage for processing,<br />
cooling and consumption in thermal and<br />
nuclear power plants, including use of water in<br />
ash handling.<br />
A d d<br />
EN9<br />
Water sources significantly affected by<br />
withdrawal of water.<br />
A d d<br />
EN10 Percentage and total volume of water<br />
recycled and reused.<br />
RG Version 3.0/EUSS Final Version<br />
41
RG<br />
&<br />
EUSS<br />
Sustainability <strong>Reporting</strong> Guidelines & <strong>Electric</strong> Utility <strong>Sector</strong> <strong>Supplement</strong><br />
Aspect: Biodiversity<br />
Aspect: Emissions, Effluents, and Waste<br />
Co r e<br />
Co r e<br />
EU<br />
EU<br />
A d d<br />
A d d<br />
EN11 Location and size of land owned, leased,<br />
managed in, or adjacent to, protected areas<br />
and areas of high biodiversity value outside<br />
protected areas.<br />
EN12 Description of significant impacts of activities,<br />
products, and services on biodiversity in<br />
protected areas and areas of high biodiversity<br />
value outside protected areas.<br />
<strong>Electric</strong> Utility <strong>Sector</strong>-Specific Commentary on<br />
EN12 Indicator Protocol:<br />
Include: maintenance of transmission line<br />
corridors; fragmentation and isolation<br />
(islandization) and impacts of thermal<br />
discharge.<br />
EU13. Biodiversity of offset habitats compared<br />
to the biodiversity of the affected areas.<br />
EN13 Habitats protected or restored.<br />
EN14 Strategies, current actions, and future plans<br />
for managing impacts on biodiversity.<br />
Co r e<br />
EU<br />
EN16 Total direct and indirect greenhouse gas<br />
emissions by weight.<br />
<strong>Electric</strong> Utility <strong>Sector</strong>-Specific Commentary on<br />
EN16 Indicator Protocol:<br />
Report CO 2<br />
e per MWh broken down by country<br />
or regulatory regime, for:<br />
• Net generation from all generating<br />
capacity;<br />
• Net generation from all fossil fuel<br />
generation; and<br />
• Estimated net delivery to end users. This<br />
includes emissions from own generation<br />
as well as gross purchased power including<br />
line losses (in Compilation section 2.4).<br />
Explanation:<br />
The first bullet refers to the emissions intensity<br />
for all generating capacity, and the second<br />
bullet refers to that of the fossil generation<br />
capacity.<br />
A breakdown by country or regulatory regime<br />
is necessary because of the different CO2e<br />
allocation schemes in place.<br />
EU<br />
EU<br />
<strong>Electric</strong> Utility <strong>Sector</strong>-Specific Commentary on<br />
EN14 Indicator Protocol:<br />
Report the impacts (including fragmentation<br />
and isolation), develop mitigation measures,<br />
and monitor residual effects at new sites and<br />
existing sites on the following:<br />
• Forested areas (e.g., alterations to tree<br />
crown density);<br />
• Loss of indigenous species;<br />
• Landscape (e.g., impacts of wind farms,<br />
transmission lines); and<br />
• Marine freshwater and wetland ecosystems<br />
(e.g., downstream water quality including<br />
turbidity, sedimentation, siltation and<br />
water quality of reservoir and other water<br />
bodies).<br />
A d d Co r e<br />
EU<br />
Definition:<br />
Regulatory regime refers to local, sub-national,<br />
national or regional area where there is a<br />
common regulatory framework.<br />
Net refers to electricity output to the grid from<br />
the power plant.<br />
EN17 Other relevant indirect greenhouse gas<br />
emissions by weight.<br />
EN18 <strong>Initiative</strong>s to reduce greenhouse gas<br />
emissions and reductions achieved.<br />
<strong>Electric</strong> Utility <strong>Sector</strong>-Specific Commentary on<br />
EN18 Indicator Protocol:<br />
This should be a Core indicator for the sector.<br />
Assessment and mitigation should consider<br />
conservation plans for indigenous species,<br />
alterations in the migration, breeding, or<br />
habitat of animals (e.g., fish passage) from the<br />
reporting organization’s infrastructure (e.g.,<br />
power lines and dams).<br />
Co r e Co r e<br />
EN19 Emissions of ozone-depleting substances by<br />
weight.<br />
EN20 NO x<br />
, SO x<br />
, and other significant air emissions by<br />
type and weight.<br />
A d d<br />
EN15 Number of IUCN Red List species and national<br />
conservation list species with habitats in areas<br />
affected by operations, by level of extinction<br />
risk.<br />
42<br />
© 2000-2009 GRI
EU<br />
<strong>Electric</strong> Utility <strong>Sector</strong>-Specific Commentary on<br />
EN20 Indicator Protocol:<br />
• Report emissions per MWh net generation.<br />
• Examples of ‘other significant air emissions’<br />
include but are not limited to mercury,<br />
coal pile dust, ash lagoons or ponds,<br />
precipitator dust, and reservoir draw down<br />
dust.<br />
Sustainability <strong>Reporting</strong> Guidelines & <strong>Electric</strong> Utility <strong>Sector</strong> <strong>Supplement</strong><br />
Aspect: Products and Services<br />
Co r e<br />
Co r e<br />
EN26 <strong>Initiative</strong>s to mitigate environmental impacts<br />
of products and services, and extent of impact<br />
mitigation.<br />
EN27 Percentage of products sold and their<br />
packaging materials that are reclaimed by<br />
category.<br />
RG<br />
&<br />
EUSS<br />
EU Co r e EU<br />
Co r e<br />
EN21 Total water discharge by quality and<br />
destination.<br />
<strong>Electric</strong> Utility <strong>Sector</strong>-Specific Commentary on<br />
EN21 Indicator Protocol:<br />
Include thermal discharges.<br />
EN22 Total weight of waste by type and disposal<br />
method.<br />
<strong>Electric</strong> Utility <strong>Sector</strong>-Specific Commentary on<br />
EN22 Indicator Protocol:<br />
• Include PCB waste.<br />
• Report on nuclear waste using IAEA<br />
definitions and protocols.<br />
• Report mass and activity of spent nuclear<br />
fuel sent for processing and reprocessing<br />
per year. In addition, report radioactive<br />
waste produced per net MWh nuclear<br />
generation per year.<br />
• Report (in terms of mass and activity)<br />
low/intermediate level waste and high<br />
level waste separately, based on IAEA<br />
radioactive waste classification. This<br />
should also include waste produced from<br />
reprocessing activities, where data is<br />
available.<br />
Aspect: Compliance<br />
Co r e<br />
EN28 Monetary value of significant fines and total<br />
number of non-monetary sanctions for noncompliance<br />
with environmental laws and<br />
regulations.<br />
Aspect: Transport<br />
A d d<br />
EN29 Significant environmental impacts of<br />
transporting products and other goods<br />
and materials used for the organization’s<br />
operations, and transporting members of the<br />
workforce.<br />
Aspect: Overall<br />
A d d<br />
EN30 Total environmental protection expenditures<br />
and investments by type.<br />
EU<br />
Co r e<br />
EN23 Total number and volume of significant spills.<br />
A d d<br />
EN24 Weight of transported, imported, exported, or<br />
treated waste deemed hazardous under the<br />
terms of the Basel Convention Annex I, II, III,<br />
and VIII, and percentage of transported waste<br />
shipped internationally.<br />
A d d<br />
EN25 Identity, size, protected status, and<br />
biodiversity value of water bodies and related<br />
habitats significantly affected by the reporting<br />
organization’s discharges of water and runoff.<br />
RG Version 3.0/EUSS Final Version<br />
43
RG<br />
&<br />
EUSS<br />
Sustainability <strong>Reporting</strong> Guidelines & <strong>Electric</strong> Utility <strong>Sector</strong> <strong>Supplement</strong><br />
Social Performance Indicators<br />
The social dimension of sustainability concerns the<br />
impacts an organization has on the social systems within<br />
which it operates.<br />
The GRI Social Performance Indicators identify key<br />
Performance Aspects surrounding labor practices,<br />
human rights, society, and product responsibility.<br />
Labor Practices and Decent Work<br />
The specific Aspects under the category of Labor<br />
Practices are based on internationally recognized<br />
universal standards, including:<br />
• United Nations Universal Declaration of Human<br />
Rights and its Protocols;<br />
• United Nations Convention: International<br />
Covenant on Civil and Political Rights;<br />
• United Nations Convention: International<br />
Covenant on Economic, Social, and Cultural Rights;<br />
• ILO Declaration on Fundamental Principles and<br />
Rights at Work of 1998 (in particular the eight core<br />
conventions of the ILO); and<br />
• The Vienna Declaration and Programme of Action.<br />
EU<br />
The Labor Practices Indicators also draw upon the<br />
two instruments directly addressing the social<br />
responsibilities of business enterprises: the ILO Tripartite<br />
Declaration Concerning Multinational Enterprises and<br />
Social Policy, and the Organisation for Economic Cooperation<br />
and Development (OECD) Guidelines for<br />
Multinational Enterprises.<br />
Disclosure on Management Approach<br />
Provide a concise disclosure on the following<br />
Management Approach items with reference to the<br />
Labor Aspects listed below. The ILO Tripartite Declaration<br />
Concerning Multinational Enterprises and Social Policy<br />
(in particular the eight core conventions of the ILO)<br />
and the Organisation for Economic Co-operation and<br />
Development Guidelines for Multinational Enterprises,<br />
should be the primary reference points.<br />
• Employment;<br />
• Labor/Management Relations;<br />
• Occupational Health and Safety;<br />
• Training and Education; and<br />
• Diversity and Equal Opportunity.<br />
44<br />
9<br />
Conventions <br />
100 and 111 pertain to non-discrimination; Conventions 87 and 98 pertain to freedom of association and collective<br />
bargaining; Conventions 138 and 182 pertain to the elimination of child labor; and Conventions 29 and 105 pertain to the prevention<br />
of forced and compulsory labor.<br />
© 2000-2009 GRI
Goals and Performance<br />
Organization–wide goals regarding performance<br />
relevant to the Labor Aspects, indicating their linkage to<br />
the internationally recognized universal standards.<br />
Use organization-specific Indicators (as needed)<br />
in addition to the GRI Performance Indicators to<br />
demonstrate the results of performance against goals.<br />
Policy<br />
Brief, organization-wide policy (or policies) that defines<br />
the organization’s overall commitment related to the<br />
Labor Aspects, or state where this can be found in the<br />
public domain (e.g., web link). Also reference their<br />
linkage to the international standards indicated above.<br />
Sustainability <strong>Reporting</strong> Guidelines & <strong>Electric</strong> Utility <strong>Sector</strong> <strong>Supplement</strong><br />
<strong>Electric</strong> Utility <strong>Sector</strong>-Specific Disclosure on<br />
Management Approach<br />
Aspect: Employment<br />
Co r e Co r e Co r e<br />
EU14. Programs and processes to ensure the<br />
availability of a skilled workforce.<br />
EU15. Percentage of employees eligible to retire in<br />
the next 5 and 10 years broken down by job<br />
category and by region.<br />
EU16. Policies and requirements regarding health<br />
and safety of employees and employees of<br />
contractors and subcontractors.<br />
EU<br />
RG<br />
&<br />
EUSS<br />
Organizational responsibility<br />
The most senior position with operational responsibility for<br />
Labor Aspects or explain how operational responsibility is<br />
divided at the senior level for these Aspects. This differs<br />
from Disclosure 4.1, which focuses on structures at the<br />
governance level.<br />
Training and awareness<br />
Procedures related to training and raising awareness in<br />
relation to the Labor Aspects.<br />
Monitoring and Follow-Up<br />
Procedures related to monitoring and corrective and preventive<br />
actions, including those related to the supply chain.<br />
EU<br />
List of certifications for labor-related performance or<br />
certification systems, or other approaches to auditing/<br />
verifying the reporting organization or its supply chain.<br />
Additional Contextual Information<br />
Additional relevant information required to understand<br />
organizational performance, such as:<br />
• Key successes and shortcomings;<br />
• Major organizational risks and opportunities;<br />
• Major changes in the reporting period to systems<br />
or structures to improve performance; and<br />
• Key strategies and procedures for implementing<br />
policies or achieving goals.<br />
RG Version 3.0/EUSS Final Version<br />
45
RG<br />
&<br />
EUSS<br />
Sustainability <strong>Reporting</strong> Guidelines & <strong>Electric</strong> Utility <strong>Sector</strong> <strong>Supplement</strong><br />
Labor Practices and Decent Work<br />
Performance Indicators<br />
Aspect: Employment<br />
Co r e<br />
LA1<br />
Total workforce by employment type,<br />
employment contract, and region.<br />
Aspect: Occupational Health and Safety<br />
A d d<br />
LA6<br />
Percentage of total workforce represented in<br />
formal joint management–worker health and<br />
safety committees that help monitor and advise<br />
on occupational health and safety programs.<br />
EU<br />
Co r e<br />
LA2<br />
<strong>Electric</strong> Utility <strong>Sector</strong>-Specific Commentary on<br />
LA1 Indicator Protocol:<br />
Report on total contractor workforce<br />
(contractor, subcontractor, independent<br />
contractor) by employment type, employment<br />
contract and region.<br />
Total number and rate of employee turnover<br />
by age group, gender, and region.<br />
Co r e<br />
EU<br />
LA7<br />
Rates of injury, occupational diseases, lost<br />
days, and absenteeism, and number of workrelated<br />
fatalities by region.<br />
<strong>Electric</strong> Utility <strong>Sector</strong>-Specific Commentary on<br />
LA7 Indicator Protocol:<br />
Report on health and safety performance of<br />
contractors and subcontractors working onsite<br />
or on behalf of the reporting organization off<br />
site.<br />
EU<br />
EU<br />
Co r e<br />
Co r e<br />
A d d<br />
<strong>Electric</strong> Utility <strong>Sector</strong>-Specific Commentary on<br />
LA2 Indicator Protocol:<br />
For the employees leaving employment during<br />
the reporting period, provide the average<br />
length of tenure of employees leaving broken<br />
down by gender and age group.<br />
EU17: Days worked by contractor and subcontractor<br />
employees involved in construction, operation<br />
& maintenance activities.<br />
EU18: Percentage of contractor and subcontractor<br />
employees that have undergone relevant<br />
health and safety training.<br />
LA3<br />
Benefits provided to full-time employees that<br />
are not provided to temporary or part-time<br />
employees, by major operations.<br />
Aspect: Labor/Management Relations<br />
EU<br />
Co r e<br />
A d d<br />
LA8<br />
LA9<br />
Education, training, counseling, prevention,<br />
and risk-control programs in place to assist<br />
workforce members, their families, or community<br />
members regarding serious diseases.<br />
Health and safety topics covered in formal<br />
agreements with trade unions.<br />
Aspect: Training and Education<br />
Co r e<br />
A d d<br />
A d d<br />
LA10 Average hours of training per year per<br />
employee by employee category.<br />
LA11 Programs for skills management and<br />
lifelong learning that support the continued<br />
employability of employees and assist them in<br />
managing career endings.<br />
LA12 Percentage of employees receiving regular<br />
performance and career development<br />
reviews.<br />
Co r e<br />
EU<br />
LA4<br />
Percentage of employees covered by<br />
collective bargaining agreements.<br />
<strong>Electric</strong> Utility <strong>Sector</strong>-Specific Commentary on<br />
LA4 Indicator Protocol:<br />
Report on percentage of contractor employees<br />
(contractor, subcontractor and independent<br />
contractor) working for the reporting<br />
organization covered by collective bargaining<br />
agreements by country or regulatory regime.<br />
Aspect: Diversity and Equal Opportunity<br />
Co r e<br />
Co r e<br />
LA13 Composition of governance bodies and<br />
breakdown of employees per category<br />
according to gender, age group, minority<br />
group membership, and other indicators of<br />
diversity.<br />
LA14 Ratio of basic salary of men to women by<br />
employee category.<br />
Co r e<br />
LA5<br />
Minimum notice period(s) regarding<br />
operational changes, including whether it is<br />
specified in collective agreements.<br />
46<br />
© 2000-2009 GRI
Human Rights<br />
Human Rights Performance Indicators require organizations<br />
to report on the extent to which human rights are<br />
considered in investment and supplier/contractor selection<br />
practices. Additionally, the Indicators cover employee<br />
and security forces training on human rights as well as<br />
non-discrimination, freedom of association, child labor,<br />
indigenous rights, and forced and compulsory labor.<br />
Generally recognized human rights are defined by the<br />
following Conventions and Declarations:<br />
• United Nations Universal Declaration of Human<br />
Rights and its Protocols;<br />
• United Nations Convention: International<br />
Covenant on Civil and Political Rights;<br />
• United Nations Convention: International<br />
Covenant on Economic, Social, and Cultural Rights;<br />
• ILO Declaration on Fundamental Principles and<br />
Rights at Work of 1998 (in particular the eight core<br />
conventions of the ILO); and<br />
• The Vienna Declaration and Programme of Action.<br />
Disclosure on Management Approach<br />
Provide a concise disclosure on the following Management<br />
Approach items with reference to the Human Rights<br />
Aspects listed below. The ILO Tripartite Declaration<br />
Concerning Multinational Enterprises and Social Policy<br />
(in particular the eight core conventions of the ILO which<br />
consist of Conventions 100, 111, 87, 98, 138, 182, 20 and<br />
105 9 ), and the Organisation for Economic Cooperation<br />
and Development Guidelines for Multinational Enterprises<br />
should be the primary reference points.<br />
• Investment and Procurement Practices;<br />
• Non-discrimination;<br />
• Freedom of Association and Collective Bargaining;<br />
• Abolition of Child Labor;<br />
• Prevention of Forced and Compulsory Labor;<br />
• Complaints and Grievance Practices;<br />
• Security Practices; and<br />
• Indigenous Rights.<br />
Sustainability <strong>Reporting</strong> Guidelines & <strong>Electric</strong> Utility <strong>Sector</strong> <strong>Supplement</strong><br />
Goals and Performance<br />
Organization-wide goals regarding performance relevant<br />
to the Human Rights Aspects, indicating their linkage to<br />
the international declarations and standards listed above.<br />
Use organization-specific Indicators (as needed)<br />
in addition to the GRI Performance Indicators to<br />
demonstrate the results of performance against goals.<br />
Policy<br />
Brief, organization-wide policy (or policies) that defines<br />
the organization’s overall commitment to the Human<br />
Rights Aspects (including policies which may be<br />
reasonably considered likely to affect the decision of<br />
employees to join a trade union or bargain collectively),<br />
or state where this can be found in the public domain<br />
(e.g., web link). Also reference their linkage to the international<br />
declarations and standards indicated above.<br />
Organizational responsibility<br />
The most senior position with operational responsibility<br />
for Human Rights Aspects or explain how operational<br />
responsibility is divided at the senior level for these<br />
Aspects. This differs from Disclosure 4.1, which focuses<br />
on structures at the governance level.<br />
Training and awareness<br />
Procedures related to training and raising awareness in<br />
relation to the Human Rights Aspects.<br />
Monitoring and Follow-Up<br />
Procedures related to monitoring and corrective and pre<br />
ventive actions, including those related to the supply chain.<br />
List of certifications for human rights-related performance,<br />
or certification systems, or other approaches to auditing/<br />
verifying the reporting organization or its supply chain.<br />
Additional Contextual Information<br />
Additional relevant information required to understand<br />
organizational performance, such as:<br />
• Key successes and shortcomings;<br />
• Major organizational risks and opportunities;<br />
• Major changes in the reporting period to systems<br />
or structures to improve performance; and<br />
• Key strategies and procedures for implementing<br />
policies or achieving goals.<br />
RG<br />
&<br />
EUSS<br />
EU<br />
RG Version 3.0/EUSS Final Version<br />
47
RG<br />
&<br />
EUSS<br />
Sustainability <strong>Reporting</strong> Guidelines & <strong>Electric</strong> Utility <strong>Sector</strong> <strong>Supplement</strong><br />
Human Rights Performance Indicators<br />
Aspect: Investment and Procurement Practices<br />
Co r e<br />
HR1<br />
Percentage and total number of significant<br />
investment agreements that include human<br />
rights clauses or that have undergone human<br />
rights screening.<br />
Aspect: Forced and Compulsory Labor<br />
Co r e<br />
HR7<br />
Operations identified as having significant risk<br />
for incidents of forced or compulsory labor,<br />
and measures to contribute to the elimination<br />
of forced or compulsory labor.<br />
Aspect: Security Practices<br />
Co r e<br />
HR2<br />
Percentage of significant suppliers and<br />
contractors that have undergone screening<br />
on human rights and actions taken.<br />
A d d<br />
HR8<br />
Percentage of security personnel trained<br />
in the organization’s policies or procedures<br />
concerning aspects of human rights that are<br />
relevant to operations.<br />
A d d<br />
HR3<br />
Total hours of employee training on policies<br />
and procedures concerning aspects of human<br />
rights that are relevant to operations, including<br />
the percentage of employees trained.<br />
Aspect: Indigenous Rights<br />
A d d<br />
HR9<br />
Total number of incidents of violations involving<br />
rights of indigenous people and actions taken.<br />
Aspect: Non-discrimination<br />
Co r e<br />
HR4<br />
Total number of incidents of discrimination<br />
and actions taken.<br />
Aspect: Freedom of Association and Collective<br />
Bargaining<br />
EU<br />
Co r e<br />
EU<br />
HR5<br />
Operations identified in which the right to<br />
exercise freedom of association and collective<br />
bargaining may be at significant risk, and<br />
actions taken to support these rights.<br />
<strong>Electric</strong> Utility <strong>Sector</strong>-Specific Commentary on<br />
HR5 Indicator Protocol:<br />
Report on management mechanisms to<br />
address the right to organize, right to bargain<br />
and right to strike or instances of lock out<br />
given the context of the industry’s need to<br />
ensure continuous provision of essential<br />
services. Where the right to strike does not<br />
exist or is limited, report on remedial measures<br />
such as binding arbitration. Where freedom<br />
of association or expression are limited or<br />
prevented by regulatory regime, report on<br />
mechanisms and processes that exist for<br />
getting employee input on conditions of<br />
employment.<br />
Aspect: Child Labor<br />
Co r e<br />
HR6<br />
Operations identified as having significant risk<br />
for incidents of child labor, and measures taken<br />
to contribute to the elimination of child labor.<br />
48<br />
© 2000-2009 GRI
Society<br />
Society Performance Indicators focus attention on the<br />
impacts organizations have on the communities in<br />
which they operate, and disclosing how the risks that<br />
may arise from interactions with other social institutions<br />
are managed and mediated. In particular, information<br />
is sought on the risks associated with bribery and<br />
corruption, undue influence in public policy-making,<br />
and monopoly practices.<br />
Disclosure on Management Approach<br />
Provide a concise disclosure on the following<br />
Management Approach items with reference to the<br />
Society Aspects:<br />
• Community;<br />
• Corruption;<br />
• Public Policy;<br />
• Anti-Competitive Behavior;<br />
• Compliance; and<br />
• Disaster/Emergency Planning and Response.<br />
Goals and Performance<br />
Organization-wide goals regarding performance<br />
relevant to the Aspects indicated above.<br />
Use organization-specific Indicators as needed<br />
in addition to the GRI Performance Indicators to<br />
demonstrate the results of performance against goals.<br />
Policy<br />
Brief, organization-wide policy (or policies) that define<br />
the organization’s overall commitment relating to the<br />
Society Aspects or state where this can be found in the<br />
public domain (e.g., web link).<br />
EU<br />
Sustainability <strong>Reporting</strong> Guidelines & <strong>Electric</strong> Utility <strong>Sector</strong> <strong>Supplement</strong><br />
Monitoring and Follow-Up<br />
Procedures related to monitoring and corrective and<br />
preventive actions, including those related to the supply<br />
chain.<br />
List of certifications for performance or certification<br />
systems, or other approaches to auditing/verifying the<br />
reporting organization or its supply chain.<br />
Additional Contextual Information<br />
Additional relevant information required to understand<br />
organizational performance, such as:<br />
• Key successes and shortcomings;<br />
• Major organizational risks and opportunities;<br />
• Major changes in the reporting period to systems<br />
or structures to improve performance; and<br />
• Key strategies and procedures for implementing<br />
policies or achieving goals.<br />
<strong>Electric</strong> Utility <strong>Sector</strong>-Specific Disclosure on<br />
Management Approach<br />
Aspect: Community<br />
Co r e<br />
Co r e<br />
EU19. Stakeholder participation in the decision<br />
making process related to energy planning and<br />
infrastructure development.<br />
EU20. Approach to managing the impacts of<br />
displacement.<br />
Aspect: Disaster/Emergency Planning and<br />
Response<br />
EU21. Contingency planning measures, disaster/<br />
emergency management plan and training<br />
programs, and recovery/restoration plans.<br />
Co r e<br />
EU<br />
RG<br />
&<br />
EUSS<br />
EU<br />
Organizational responsibility<br />
The most senior position with operational responsibility<br />
for Society Aspects or explain how operational<br />
responsibility is divided at the senior level for these<br />
Aspects. This differs from Disclosure 4.1, which focuses<br />
on structures at the governance level.<br />
Training and awareness<br />
Procedures related to training and raising awareness in<br />
relation to the Society Aspects.<br />
RG Version 3.0/EUSS Final Version<br />
49
RG<br />
&<br />
EUSS<br />
Sustainability <strong>Reporting</strong> Guidelines & <strong>Electric</strong> Utility <strong>Sector</strong> <strong>Supplement</strong><br />
Society Performance Indicators<br />
Aspect: Community<br />
Co r e<br />
SO1<br />
Nature, scope, and effectiveness of any<br />
programs and practices that assess and<br />
manage the impacts of operations on<br />
communities, including entering, operating,<br />
and exiting.<br />
<strong>Electric</strong> Utility <strong>Sector</strong>-Specific Commentary on<br />
SO1 Indicator Protocol:<br />
Aspect: Anti-Competitive Behavior<br />
A d d<br />
SO7<br />
Total number of legal actions for anticompetitive<br />
behavior, anti-trust, and<br />
monopoly practices and their outcomes.<br />
Aspect: Compliance<br />
Co r e<br />
SO8<br />
Monetary value of significant fines and total<br />
number of non-monetary sanctions for noncompliance<br />
with laws and regulations.<br />
EU<br />
Co r e EU<br />
Include discussions of programs related to:<br />
• Ways in which information is exchanged<br />
and local population is involved, prior,<br />
during and after the event and the<br />
provision for intervener funding for the<br />
local population.<br />
• Influx of workers and impacts on<br />
neighboring communities (including<br />
changes to local social structures and<br />
culture);<br />
• Changes to land-use including loss of<br />
global commons (e.g. access to land,<br />
natural resources, and heritage);<br />
• Impacts on infrastructure (e.g. roads,<br />
housing), and access to services (e.g.<br />
education, utilities, healthcare); and<br />
• Changes to the aesthetics and quality of<br />
the landscape.<br />
EU22. Number of people physically or economically<br />
displaced and compensation, broken down<br />
by type of project .<br />
EU<br />
Aspect: Corruption<br />
Co r e<br />
SO2<br />
Percentage and total number of business<br />
units analyzed for risks related to corruption.<br />
Co r e<br />
SO3<br />
Percentage of employees trained in<br />
organization’s anti-corruption policies and<br />
procedures.<br />
Co r e<br />
SO4<br />
Actions taken in response to incidents of<br />
corruption.<br />
Aspect: Public Policy<br />
Co r e<br />
SO5<br />
Public policy positions and participation in<br />
public policy development and lobbying.<br />
A d d<br />
SO6<br />
Total value of financial and in-kind<br />
contributions to political parties, politicians,<br />
and related institutions by country.<br />
50<br />
© 2000-2009 GRI
Product Responsibility<br />
Product Responsibility Performance Indicators address<br />
the aspects of a reporting organization’s products and<br />
services that directly affect customers, namely, health<br />
and safety, information and labeling, marketing, and<br />
privacy.<br />
These aspects are chiefly covered through disclosure<br />
on internal procedures and the extent to which these<br />
procedures are not complied with.<br />
Disclosure on Management Approach<br />
Provide a concise disclosure on the following<br />
Management Approach items with reference to the<br />
Product Responsibility Aspects:<br />
• Customer Health and Safety;<br />
• Product and Service Labeling;<br />
• Marketing Communications;<br />
• Customer Privacy;<br />
• Compliance;<br />
• Access; and<br />
• Provision of Information.<br />
Goals and Performance<br />
Organization-wide goals regarding performance<br />
relevant to the Product Responsibility Aspects.<br />
Use organization-specific Indicators (as needed)<br />
in addition to the GRI Performance Indicators to<br />
demonstrate the results of performance against goals.<br />
Policy<br />
Brief, organization-wide policy (or policies) that defines<br />
the organization’s overall commitment to the Product<br />
Responsibility Aspects, or state where this can be found<br />
in the public domain (e.g., web link).<br />
EU<br />
Sustainability <strong>Reporting</strong> Guidelines & <strong>Electric</strong> Utility <strong>Sector</strong> <strong>Supplement</strong><br />
Training and awareness<br />
Procedures related to training and raising awareness in<br />
relation to the Product Responsibility Aspects.<br />
Monitoring and Follow-Up<br />
Procedures related to monitoring and corrective and<br />
preventive actions, including those related to the supply<br />
chain.<br />
List of certifications for product responsibilityrelated<br />
performance or certification systems, or<br />
other approaches to auditing/verifying the reporting<br />
organization or its supply chain.<br />
Additional Contextual Information<br />
Additional relevant information required to understand<br />
organizational performance, such as:<br />
• Key successes and shortcomings;<br />
• Major organizational risks and opportunities;<br />
• Major changes in the reporting period to systems<br />
or structures to improve performance; and<br />
• Key strategies and procedures for implementing<br />
policies or achieving goals.<br />
<strong>Electric</strong> Utility <strong>Sector</strong>-Specific Disclosure on<br />
Management Approach<br />
Aspect: Access<br />
Co r e<br />
EU23. Programs, including those in partnership with<br />
government, to improve or maintain access to<br />
electricity and customer support services.<br />
Aspect: Provision of Information<br />
EU24. Practices to address language, cultural, low<br />
literacy and disability related barriers to<br />
accessing and safely using electricity and<br />
customer support services.<br />
Co r e<br />
EU<br />
RG<br />
&<br />
EUSS<br />
EU<br />
Organizational responsibility<br />
The most senior position with operational responsibility<br />
for Product Responsibility Aspects, or explain how<br />
operational responsibility is divided at the senior level<br />
for Product Responsibility Aspects. This differs from<br />
Disclosure 4.1, which focuses on structures at the<br />
governance level.<br />
RG Version 3.0/EUSS Final Version<br />
51
RG<br />
&<br />
EUSS<br />
Sustainability <strong>Reporting</strong> Guidelines & <strong>Electric</strong> Utility <strong>Sector</strong> <strong>Supplement</strong><br />
Product Responsibility Performance Indicators<br />
Aspect: Customer Health and Safety<br />
A d d<br />
PR5<br />
Practices related to customer satisfaction,<br />
including results of surveys measuring<br />
customer satisfaction.<br />
EU<br />
Co r e<br />
Co r e A d d<br />
EU<br />
PR1<br />
PR2<br />
Life cycle stages in which health and safety<br />
impacts of products and services are<br />
assessed for improvement, and percentage of<br />
significant products and services categories<br />
subject to such procedures.<br />
<strong>Electric</strong> Utility <strong>Sector</strong>-Specific Commentary on<br />
PR1 Indicator Protocol:<br />
For electric utilities the following categories<br />
should also be assessed:<br />
• Resource planning<br />
• Generation<br />
• Transmission<br />
• Distribution<br />
• Use<br />
State the processes for assessing community<br />
health risks including monitoring, prevention<br />
measures and, if applicable, long term healthrelated<br />
studies.<br />
Identify community health risks that are<br />
assessed such as:<br />
Compliance with exposure limit(s) to electric<br />
fields (in kV per m) and magnetic fields (in μT)<br />
where available, for members of the public and<br />
employees in the areas in which the reporting<br />
organization operates.<br />
Total number of incidents of non-compliance<br />
with regulations and voluntary codes concerning<br />
health and safety impacts of products and services<br />
during their life cycle, by type of outcomes.<br />
EU25. Number of injuries and fatalities to the public<br />
involving company assets, including legal<br />
judgments, settlements and pending legal<br />
cases of diseases.<br />
Aspect: Marketing Communications<br />
Co r e<br />
A d d<br />
PR6<br />
PR7<br />
Programs for adherence to laws, standards,<br />
and voluntary codes related to marketing<br />
communications, including advertising,<br />
promotion, and sponsorship.<br />
Total number of incidents of non-compliance<br />
with regulations and voluntary codes<br />
concerning marketing communications,<br />
including advertising, promotion, and<br />
sponsorship by type of outcomes.<br />
Aspect: Customer Privacy<br />
A d d<br />
PR8<br />
Total number of substantiated complaints<br />
regarding breaches of customer privacy and<br />
losses of customer data.<br />
Aspect: Compliance<br />
Co r e<br />
PR9<br />
Monetary value of significant fines for noncompliance<br />
with laws and regulations concerning<br />
the provision and use of products and services.<br />
Aspect: Access<br />
EU26. Percentage of population unserved in licensed<br />
distribution or service areas.<br />
Co r e Co r e<br />
Co r e<br />
Co r e<br />
EU27. Number of residential disconnections for<br />
non-payment, broken down by duration of<br />
disconnection and by regulatory regime.<br />
EU28. Power outage frequency.<br />
EU29. Average power outage duration.<br />
EU<br />
Aspect: Product and Service Labeling<br />
Co r e<br />
PR3<br />
Type of product and service information<br />
required by procedures, and percentage of<br />
significant products and services subject to<br />
such information requirements.<br />
Co r e<br />
EU30. Average plant availability factor by energy<br />
source and by regulatory regime.<br />
A d d<br />
PR4<br />
Total number of incidents of non-compliance<br />
with regulations and voluntary codes<br />
concerning product and service information<br />
and labeling, by type of outcomes.<br />
52<br />
© 2000-2009 GRI
General <strong>Reporting</strong> Notes<br />
Data Gathering<br />
Feasibility Assessment<br />
The process of defining report content will result in a<br />
set of topics and Indicators on which the organization<br />
should report. However, practical challenges such as<br />
the availability of data, the cost of gathering it, the<br />
confidentiality of information, privacy or other legal<br />
concerns, the reliability of available information, and<br />
other factors, may result in a legitimate decision not to<br />
disclose certain information. Where material information<br />
is omitted, the report should clearly indicate this and the<br />
reasons why.<br />
Data Aggregation and Disaggregation<br />
<strong>Reporting</strong> organizations will need to determine the<br />
level of aggregation at which to present information.<br />
This requires balancing the effort required against the<br />
added meaningfulness of information reported on a<br />
disaggregated basis (e.g., country or site). Aggregation<br />
of information can result in the loss of a significant<br />
amount of meaning, and can also fail to highlight<br />
particularly strong or poor performance in specific areas.<br />
On the other hand, unnecessary disaggregation of data<br />
can affect the ease of understanding the information.<br />
<strong>Reporting</strong> organizations should disaggregate<br />
information to an appropriate level using the<br />
principles and the guidance in the reporting Indicators.<br />
Disaggregation may vary by Indicator, but will generally<br />
provide more insight than a single, aggregated figure.<br />
Report Form and Frequency<br />
Definition of a Sustainability Report<br />
A sustainability report refers to a single, consolidated<br />
disclosure that provides a reasonable and balanced<br />
presentation of performance over a fixed time period.<br />
Stakeholders should be able to directly access all of<br />
the report information from a single location, such<br />
as a GRI content index. Other publications should<br />
not be referenced as the information source for a GRI<br />
Standard Disclosure Item (ex., a Performance Indicator)<br />
unless the means for a stakeholder to directly access<br />
the information is provided (e.g., a link to a specific<br />
web page or the page number of the corresponding<br />
publication). There is no minimum length for a report<br />
using the GRI Framework as long as the organization<br />
has properly applied the Guidelines and Framework<br />
documents it has chosen to use.<br />
Sustainability <strong>Reporting</strong> Guidelines & <strong>Electric</strong> Utility <strong>Sector</strong> <strong>Supplement</strong><br />
Medium of <strong>Reporting</strong><br />
Electronic (e.g., CD-ROM) or web-based reporting and<br />
paper reports are appropriate media for reporting.<br />
Organizations may choose to use a combination of<br />
web and paper-based reports or use only one medium.<br />
For example, an organization may choose to provide<br />
a detailed report on their website and provide an<br />
executive summary including their strategy and analysis<br />
and performance information in paper form. The choice<br />
will likely depend on the organization’s decisions on<br />
its reporting period, its plans for updating content, the<br />
likely users of the report, and other practical factors such<br />
as its distribution strategy. At least one medium (web or<br />
paper) should provide users with access to the complete<br />
set of information for the reporting period.<br />
Frequency of <strong>Reporting</strong><br />
Organizations should define a consistent and periodic<br />
cycle for issuing a report. For many organizations, this<br />
will be an annual cycle, although some organizations<br />
choose to report biannually. An organization may<br />
choose to update information on a regular basis<br />
between the issuing of consolidated accounts<br />
of performance. This has advantages in terms of<br />
providing stakeholders with more immediate access<br />
to information, but has disadvantages in terms of<br />
comparability of information. However, organizations<br />
should still maintain a predictable cycle in which all of<br />
the information that is reported covers a specific time<br />
period.<br />
<strong>Reporting</strong> on economic, environmental, and social<br />
performance could coincide or be integrated with<br />
other organizational reporting, such as annual financial<br />
statements. Coordinated timing will reinforce the<br />
linkages between financial performance and economic,<br />
environmental, and social performance.<br />
RG<br />
&<br />
EUSS<br />
EU<br />
RG Version 3.0/EUSS Final Version<br />
53
RG<br />
&<br />
EUSS<br />
Sustainability <strong>Reporting</strong> Guidelines & <strong>Electric</strong> Utility <strong>Sector</strong> <strong>Supplement</strong><br />
EU<br />
Updating Report Content<br />
When preparing a new report, an organization may<br />
identify areas of information that have not changed<br />
since the prior report (e.g., a policy that has not been<br />
amended). The organization may choose to only update<br />
the topics and Indicators that have changed and to<br />
re-publish the Disclosures that have not changed. For<br />
example, an organization may choose to reproduce<br />
the information on policies that have not changed and<br />
only update its Performance Indicators. The flexibility to<br />
take such an approach will depend in large part on the<br />
organization’s choice of reporting medium. Topics such<br />
as strategy and analysis and Performance Indicators<br />
are likely to show changes each reporting period, while<br />
other topics such as organizational profile or governance<br />
may change at a slower pace. Regardless of the strategy<br />
used, the full set of applicable information for the<br />
reporting period should be accessible in a single location<br />
(either a paper or web-based document).<br />
Assurance<br />
Choices on assurance<br />
Organizations use a variety of approaches to enhance<br />
the credibility of their reports. Organizations may have<br />
systems of internal controls in place, including internal<br />
audit functions, as part of their processes for managing<br />
and reporting information. These internal systems are<br />
important to the overall integrity and credibility of a report.<br />
However, GRI recommends the use of external assurance for<br />
sustainability reports in addition to any internal resources.<br />
A variety of approaches are currently used by report<br />
preparers to implement external assurance, including<br />
the use of professional assurance providers, stakeholder<br />
panels, and other external groups or individuals.<br />
However, regardless of the specific approach, it should be<br />
conducted by competent groups or individuals external<br />
to the organization. These engagements may employ<br />
groups or individuals that follow professional standards<br />
for assurance, or they may involve approaches that follow<br />
systematic, documented, and evidence-based processes<br />
but are not governed by a specific standard.<br />
Overall, the key qualities for external assurance of<br />
reports using the GRI <strong>Reporting</strong> Framework are that it:<br />
• Is conducted by groups or individuals external to<br />
the organization who are demonstrably competent<br />
in both the subject matter and assurance practices;<br />
• Is implemented in a manner that is systematic,<br />
documented, evidence-based, and characterized<br />
by defined procedures;<br />
• Assesses whether the report provides a reasonable<br />
and balanced presentation of performance, taking<br />
into consideration the veracity of data in a report<br />
as well as the overall selection of content;<br />
• Utilizes groups or individuals to conduct the<br />
assurance who are not unduly limited by<br />
their relationship with the organization or its<br />
stakeholders to reach and publish an independent<br />
and impartial conclusion on the report;<br />
• Assesses the extent to which the report preparer<br />
has applied the GRI <strong>Reporting</strong> Framework<br />
(including the <strong>Reporting</strong> Principles) in the course<br />
of reaching its conclusions; and<br />
• Results in an opinion or set of conclusions that is<br />
publicly available in written form, and a statement<br />
from the assurance provider on their relationship<br />
to the report preparer.<br />
As indicated in Profile Disclosure 3.13, organizations<br />
should disclose information on their approach to<br />
external assurance.<br />
GRI uses the term ‘external assurance’ to refer to activities<br />
designed to result in published conclusions on the quality<br />
of the report and the information contained within it. This<br />
includes, but is not limited to, consideration of underlying<br />
processes for preparing this information. This is different<br />
from activities designed to assess or validate the quality<br />
or level of performance of an organization, such as issuing<br />
performance certifications or compliance assessments.<br />
54<br />
© 2000-2009 GRI
Glossary of Terms<br />
Additional Indicators<br />
Additional Indicators are those Indicators identified in<br />
the GRI Guidelines that represent emerging practice<br />
or address topics that may be material to some<br />
organizations but not generally for a majority.<br />
Boundary<br />
The boundary for a sustainability report refers to the<br />
range of entities whose performance is covered in the<br />
organization’s sustainability report.<br />
Content Index<br />
A GRI content index is a table or matrix that lists all<br />
of the Standard Disclosures, and where responses to<br />
the Disclosures can be found (page number or URL).<br />
<strong>Reporting</strong> organizations can also add reference to<br />
organization-specific (non-GRI Guidelines) Indicators.<br />
The Content Index provides users with a quick overview<br />
of what has been reported and increases ease of report<br />
use. A Content Index is especially important if some<br />
of the Disclosures appear in other reports, such as a<br />
financial report or previous sustainability reports.<br />
Core Indicator<br />
Core Indicators are those Indicators identified in the GRI<br />
Guidelines to be of interest to most stakeholders and<br />
assumed to be material unless deemed otherwise on the<br />
basis of the GRI <strong>Reporting</strong> Principles.<br />
Downstream<br />
The term ‘downstream entities’ is based on the concept<br />
of a production chain that extends from the extraction<br />
of raw materials to the use of a good or service by an<br />
end-user. ‘Downstream’ refers to those organizations<br />
that play a role in the distribution or use of goods and<br />
services provided by the reporting organization, or, more<br />
generally, play a role in a later step in the production<br />
chain than the organization itself.<br />
<strong>Global</strong> <strong>Reporting</strong> <strong>Initiative</strong><br />
GRI’s vision is that reporting on economic,<br />
environmental, and social performance by all<br />
organizations is as routine and comparable as financial<br />
reporting. GRI accomplishes this vision by developing,<br />
continuously improving and building capacity around<br />
the use of the GRI’s Sustainability <strong>Reporting</strong> Framework.<br />
All <strong>Reporting</strong> Framework components are developed<br />
using a global, multi-stakeholder consensus seeking<br />
approach.<br />
Sustainability <strong>Reporting</strong> Guidelines & <strong>Electric</strong> Utility <strong>Sector</strong> <strong>Supplement</strong><br />
GRI <strong>Reporting</strong> Framework<br />
The GRI <strong>Reporting</strong> Framework is intended to provide<br />
a generally accepted framework for reporting on an<br />
organization’s economic, environmental, and social<br />
performance. The Framework consists of the Sustainability<br />
<strong>Reporting</strong> Guidelines, the Indicator Protocols, Technical<br />
Protocols, and the <strong>Sector</strong> <strong>Supplement</strong>s.<br />
Independent Board Member<br />
Definitions for ‘independent’ can vary between legal<br />
jurisdictions. Independent usually implies that the<br />
member has no financial interest in the organization or<br />
other potential benefits that could create a conflict of<br />
interest. Organizations using the Guidelines should state<br />
the definition used for ‘independent’.<br />
Indicator Categories<br />
Broad areas or groupings of sustainability topics. The<br />
categories included in the GRI Guidelines are: economic,<br />
environmental, and social. The social grouping is<br />
categorized in terms of Labor Practices, Human Rights,<br />
Society, and Product Responsibility. A given category<br />
may have several Indicator Aspects.<br />
Indicator Aspects<br />
The general types of information that are related to a specific<br />
Indicator category (e.g., energy use, child labor, customers).<br />
Performance Indicator<br />
Qualitative or quantitative information about results<br />
or outcomes associated with the organization that is<br />
comparable and demonstrates change over time.<br />
Profile Disclosures<br />
The numbered information requirements in Part 2 of the<br />
Guidelines that set the overall context for reporting and<br />
understanding organizational performance (e.g., 2.1, 3.13).<br />
<strong>Reporting</strong> Principle<br />
Concepts that describe the outcomes a report should<br />
achieve and that guide decisions made throughout the<br />
reporting process, such as which Indicators to respond<br />
to, and how to respond to them.<br />
<strong>Sector</strong> <strong>Supplement</strong><br />
<strong>Sector</strong> <strong>Supplement</strong>s complement the Guidelines with<br />
interpretations and guidance on how to apply the Guidelines<br />
in a given sector, and include sector-specific Performance<br />
Indicators. Applicable <strong>Sector</strong> <strong>Supplement</strong>s should be<br />
RG<br />
&<br />
EUSS<br />
EU<br />
RG Version 3.0/EUSS Final Version<br />
55
RG<br />
&<br />
EUSS<br />
Sustainability <strong>Reporting</strong> Guidelines & <strong>Electric</strong> Utility <strong>Sector</strong> <strong>Supplement</strong><br />
used in addition to the Guidelines rather than in place of the<br />
Guidelines.<br />
Stakeholder<br />
Stakeholders are defined broadly as those groups or<br />
individuals: (a) that can reasonably be expected to be<br />
significantly affected by the organization’s activities,<br />
products, and/or services; or (b) whose actions can<br />
reasonably be expected to affect the ability of the<br />
organization to successfully implement its strategies and<br />
achieve its objectives.<br />
Standard Disclosures<br />
The Guidelines present topics and information for<br />
reporting that are material to most organizations and<br />
of interest to most stakeholders. These are captured in<br />
three types of Standard Disclosures:<br />
Unitary Board<br />
Refers to a board structure that has only one governing<br />
body responsible for the organization.<br />
Upstream<br />
The term ‘upstream entities’ is based on the concept of<br />
a production chain that extends from the extraction of<br />
raw materials to the use of a good or service by an enduser.<br />
‘Upstream’ refers to those organizations that play<br />
a role in the supply chain of the reporting organization<br />
or, more generally, play a role in an earlier step in the<br />
production chain than the organization itself.<br />
For definitions of words or concepts contained directly in<br />
the wording of the Indicators, see the Indicator Protocols.<br />
• Strategy and Profile Disclosures set the overall<br />
context for reporting and for understanding<br />
organizational performance, such as its strategy,<br />
profile, governance, and management approach;<br />
EU<br />
• Disclosures on Management Approach cover how<br />
an organization addresses a given set of topics<br />
in order to provide context for understanding<br />
performance in a specific area.<br />
• Performance Indicators that elicit comparable<br />
information on the economic, environmental, and<br />
social performance of the organization<br />
Sustainability Report<br />
Sustainability reporting is the practice of measuring,<br />
disclosing, and being accountable for organizational<br />
performance while working towards the goal of<br />
sustainable development. A sustainability report<br />
provides a balanced and reasonable representation<br />
of the sustainability performance of the reporting<br />
organization, including both positive and negative<br />
contributions.<br />
Indicator Protocol<br />
An Indicator Protocol provides definitions,<br />
compilation guidance, and other information to<br />
assist report preparers, and to ensure consistency in<br />
the interpretation of the Performance Indicators. An<br />
Indicator Protocol exists for each of the Performance<br />
Indicators contained in the Guidelines.<br />
56<br />
© 2000-2009 GRI
G3 Guidelines Acknowledgements:<br />
A <strong>Global</strong> Effort<br />
The following organizations provided funds or in-kind<br />
contributions for the G3 development process<br />
G3 Consortium:<br />
G3 ad hoc support:<br />
The United Kingdom Department for Environment, Food<br />
and Rural Affairs (DEFRA) and the Netherlands Ministry<br />
of Foreign Affairs also contributed to the G3 Guidelines<br />
Development.<br />
G3 Online supported by:<br />
G3 printed by:<br />
G3 Guidelines and Protocols Content<br />
Development<br />
Volunteers from business, non-governmental<br />
organizations, labor, accountancy, investment, academia,<br />
and others came together and create all aspects of the G3<br />
Guidelines and Protocols. The following multi-stakeholder<br />
technical working groups were convened between<br />
January and November 2005, and each delivered a<br />
different part of the content of the G3 Guidelines.<br />
Sustainability <strong>Reporting</strong> Guidelines & <strong>Electric</strong> Utility <strong>Sector</strong> <strong>Supplement</strong><br />
Indicators Working Group (IWG) Members<br />
The Indicators Working Group was responsible for<br />
reviewing the indicators set as a whole; ensuring quality<br />
and consistency of the indicators’ design; and designing<br />
overall fit with the TAC guidance.<br />
• Mr. Neil Anderson, Union Network International, UNI<br />
• Mr. David Bent, Forum for the Future<br />
• Mr. William R. Blackburn, William Blackburn Consulting<br />
• Ms. Julie-Anne Braithwaite, Rio Tinto/ICMM<br />
• Ms. Sarah Forrest, Goldman Sachs International<br />
• Ms. Somporn Kamolsiripichaiporn, Chulalongkorn<br />
University<br />
• Mr. Robert Langford, The Federation des Experts<br />
Comptables Europeens (FEE)<br />
• Ms. Stephanie Maier, Ethical Investment Research<br />
Service (EIRIS)<br />
• Ms. Asako Nagai, Sony Corporation<br />
• Mr. Ron Nielsen, Alcan Inc.<br />
• Mr. Michael Rae, World Wide Fund Australia<br />
• Ms. Ulla Rehell, Kesko Corporation<br />
• Mr. George Nagle, Bristol-Myers Squibb<br />
• Ms. Filippa Bergin, Amnesty International<br />
• Ms. Giuliana Ortega Bruno, Ethos Institute<br />
The IWG worked with six issue-specific Advisory Groups<br />
that were responsible for reviewing indicators and<br />
creating technical protocols for indicators in their area of<br />
expertise.<br />
Society Advisory Group Members<br />
• Ms. Anne Gambling, Holcim<br />
• Mr. Sachin Joshi, Center For Social Markets (CSM)<br />
• Mr. Craig Metrick, Investor Responsibility Research<br />
Center (IRRC)<br />
• Mr. Keith Miller, 3M<br />
• Ms. Ruth Rosenbaum, Center for Reflection,<br />
Education and Action (CREA)<br />
• Ms. Glaucia Terreo, Instituto Ethos<br />
• Mr. Peter Wilkinson, Transparency International<br />
RG<br />
&<br />
EUSS<br />
EU<br />
RG Version 3.0/EUSS Final Version<br />
57
RG<br />
&<br />
EUSS<br />
EU<br />
Sustainability <strong>Reporting</strong> Guidelines & <strong>Electric</strong> Utility <strong>Sector</strong> <strong>Supplement</strong><br />
Human Rights Advisory Group Members<br />
• Ms. Marina d’Engelbronner, Humanist Committee<br />
on Human Rights (HOM)<br />
• Ms. Bethany Heath, Chiquita Brands<br />
• Mr. Jorge Daniel Taillant, The Center for Human<br />
Rights and Environement (CEDHA)<br />
• Rev. Mr. David M. Schilling, Interfaith Center on<br />
Corporate Responsibility<br />
• Ms. Susan Todd, Solstice Sustainability Works Inc.<br />
• Mr. Hirose Chuichiro, Canon<br />
• Mr. Steve Ouma, Kenyan Human Rights Commission<br />
• Mr. Björn Edlund, ABB Ltd.<br />
• Ms. Marleen van Ruijven, Amnesty International<br />
Environment (Biodiversity and Water)<br />
Advisory Group<br />
• Mr. Ian Blythe, Boots Group PLC<br />
• Mr. Ian Dutton, The Nature Conservancy<br />
• Ms. Annelisa Grigg, Fauna & Flora International<br />
• Ms. Nancy Kamp-Roelands, Ernst & Young<br />
Netherlands/ Royal NIVRA<br />
• Ms. Erin Musk, City West Water<br />
• Mr. Mike Rose, SASOL<br />
• Mr. Fernando Toledo, Codelco<br />
Environment (Pollution) Advisory Group<br />
Members<br />
• Ms. Tanja D. Carroll, Coalition for Environmentally<br />
Responsible Economies (CERES)<br />
• Mr. Yutaka Okayama, Toyota Motor Corporation<br />
• Ms. Maria Fatima Reyes, Philippine Institute of<br />
Certified Public Accountants (PICPA)<br />
• Mr. Yogendra Kumar Saxena, Gujarat Ambuja Cements<br />
• Mr. David Stangis, Intel Corporation<br />
• Ms. Sonia Valdivia, The Catholic University of Peru<br />
• Mr. Eric Shostal, Institutional Shareholder Services<br />
• Ms. Lucian Turk, Dell, Inc.<br />
Labor Advisory Group Members<br />
• Ms. Michiko Arikawa, Matsushita <strong>Electric</strong> Industrial<br />
(Panasonic)<br />
• Mr. Stephen Frost, Southeast Asia Research Centre<br />
• Ms. Kyoko Sakuma, Sustainability Analysis &<br />
Consulting<br />
• Mr. Sean Ansett, Gap Inc.<br />
• Ms. Deborah Evans, Lloyd’s Register of Quality<br />
Assurance (LRQA)<br />
• Mr. Pierre Mazeau, <strong>Electric</strong>ité de France (EDF)<br />
• Mr. Dan Viederman, Verité<br />
Economic Advisory Group Members<br />
• Ms. Christine Jasch, Institute for Environmental<br />
Management and Economics(IOEW)<br />
• Mr. Martin Tanner, Novartis International AG<br />
• Ms. Helen Campbell, former AccountAbility<br />
• Mr. Eric Israel, KPMG LLP<br />
• Ms. Martina Japy, BMJ CoreRatings<br />
• Ms. Michelle Smith, Rohm and Haas<br />
• Ms. Lisa Acree, Business for Social Responsibility<br />
• Mr. Johan Verburg, NOVIB/Oxfam Netherlands<br />
<strong>Reporting</strong> as a Process Working Group<br />
(RPWG) Members<br />
The <strong>Reporting</strong> as a Process Working Group was tasked<br />
with updating and further developing the reporting<br />
principles, and other guidance on the process of<br />
applying the G3 Guidelines.<br />
• Ms. Amy Anderson, Starbucks Coffee<br />
• Mr. Pankaj Bhatia, World Resources Institute (WRI)<br />
• Mr. Bill Boyle, BP<br />
• Dr. Uwe Brekau, Bayer AG<br />
• Ms. Debra Hall, Coalition for Environmentally<br />
Responsible Economies (CERES)<br />
• Mr. Dunstan Hope, Business for Social<br />
Responsibility<br />
• Dr. Aqueel Khan, Association for Stimulating Know<br />
How (ASK)<br />
58<br />
© 2000-2009 GRI
• Ms. Judy Kuszewski, SustainAbility Ltd.<br />
• Mr Brian Kohler, Communications, Energy &<br />
Paperworkers Union of Canada<br />
• Mr Ken Larson, Hewlett Packard<br />
• Mr. Steve Lippman, Trillium Invest<br />
• Mr Luis Perera, PriceWaterHouseCoopers<br />
• Mr. Dante Pesce, Vincular, Pontificia Universidad<br />
Católica de Valparaíso<br />
• Ms Mizue Unno, So-Tech Consulting, Inc.<br />
• Mr Cornis van der Lugt, UNEP Division of<br />
Technology, Industry, and Economics (DTIE)<br />
• Mr. Robert Walker, The Ethical Funds Company<br />
• Mr. Ian Whitehouse, Manaaki Whenua Landcare<br />
Research<br />
• Mr Alan Willis, Alan Willis & Associates<br />
• Although not a member of the group, Jennifer<br />
Iansen-Rogers, KPMG, The Netherlands, provided<br />
ongoing advice on process matters.<br />
Public comments<br />
270 submissions were received in response to its call for<br />
comments on the draft G3 Guidelines between January<br />
and March 2006. These comments significantly shaped<br />
the final G3 Guidelines.<br />
GRI Governance Bodies<br />
For full information on governance bodies, including<br />
members and roles, see www.globalreporting.org.<br />
Technical Advisory Committee: This group of 12 experts<br />
assists in maintaining the overall quality and coherence<br />
of the GRI <strong>Reporting</strong> Framework by providing high level<br />
technical advice and expertise. Their key function in the<br />
G3 process was to recommend direction on the overall<br />
architecture, resolve key issues that emerged specifically<br />
around Guidelines content; ensure they were created<br />
under sound due process; submit a concur/non-concur<br />
recommendation to the Board on whether to approve<br />
the G3 version for release. The members passed a<br />
majority concur vote.<br />
Stakeholder Council: This group of 48 form the formal<br />
stakeholder policy forum within the GRI governance<br />
structure. The Council advises the Board on policy and<br />
strategy issues and helped set the overall path for the<br />
G3 development process. Some individual SC members<br />
Sustainability <strong>Reporting</strong> Guidelines & <strong>Electric</strong> Utility <strong>Sector</strong> <strong>Supplement</strong><br />
participated in the G3 working groups directly. The<br />
Council passed a majority concur vote on the release of<br />
the G3 Guidelines.<br />
Board of Directors: This group of 16 has the ultimate<br />
fiduciary, financial and legal responsibility for the GRI,<br />
including final decision making authority on GRI<br />
Guidelines revisions, organizational strategy, and<br />
work plans. After providing guidance and direction<br />
throughout the G3 process, receiving recommendations<br />
from the TAC and SC, the Board voted unanimously to<br />
approve the G3 Guidelines for release.<br />
GRI Secretariat: Under the leadership of the Chief<br />
Executive, the Secretariat implements the Guidelines<br />
and technical work plan approved by the GRI Board of<br />
Directors. It also manages communications, outreach,<br />
stakeholder relations, and financial administration. The<br />
Secretariat supports the operations of the Board of<br />
Directors, Stakeholder Council and Technical Advisory<br />
Committee.<br />
Consultants<br />
The GRI secretariat enlisted the (paid) help of the<br />
following consultants during the G3 process:<br />
• csrnetwork (Lead consultant – Mark Line)<br />
• Just Solutions (Lead consultant – Vic Thorpe)<br />
• onValues (Lead consultant - Ivo Knoepfel)<br />
• Ove Arup (Lead consultant - Jean Rogers)<br />
• Responsibility Matters (Lead consultant – Mark<br />
Brownlie)<br />
• Sandra Pederson, Editor<br />
• Source-Asia (Lead consultant – Paul Wenman)<br />
• Triple Innova (Lead consultant - Michael Kundt)<br />
• University of Amsterdam (Lead consultant - Jeffrey<br />
Harrod)<br />
The GRI secretariat enlisted the (paid) help of the<br />
following consultants during the <strong>Electric</strong> Utility <strong>Sector</strong><br />
<strong>Supplement</strong> development process:<br />
• Arthur D. Little, David Lyon and Sam Grimshaw<br />
• INSPIRIT International Communications<br />
Tuuli Sauren, layout<br />
EU<br />
RG<br />
&<br />
EUSS<br />
EU<br />
RG Version 3.0/EUSS Final Version<br />
59
RG<br />
&<br />
EUSS<br />
EU<br />
Sustainability <strong>Reporting</strong> Guidelines & <strong>Electric</strong> Utility <strong>Sector</strong> <strong>Supplement</strong><br />
<strong>Electric</strong> Utility <strong>Sector</strong> <strong>Supplement</strong><br />
Content Development<br />
Acknowledgements<br />
<strong>Electric</strong> Utility <strong>Sector</strong> <strong>Supplement</strong> Working<br />
Group Members<br />
<strong>Electric</strong> Utility <strong>Sector</strong> <strong>Supplement</strong> Working Group was<br />
responsible for developing the set of new sector-specific<br />
disclosures and performance indicators, as well as<br />
commentary on the G3 Guidelines content. The first<br />
working group process ran from June 2006 through<br />
July 2007. The second working group process ran<br />
from January 2008 until March 2009. The two working<br />
groups were formed by volunteers from electric utility<br />
companies, labor, investor, non-governmental and<br />
research organizations.<br />
• Dan Bakal, Ceres, USA<br />
• Robert J. Barkanic, PPL Services Corporation, USA<br />
• Kevin Bennett, Energy Research Centre, University<br />
of Cape town, South Africa (Chair, Non-Industry)<br />
• Fernanda Gabriela Borger, Fundação Instituto de<br />
Pesquisas Econômicas, Universidade de São Paulo,<br />
Brazil<br />
• David Boys, Public Services International, France<br />
• Robyn Camp, California Climate Action Registry,<br />
USA<br />
• Luís Castanheira, Agência Municipal de Energia de<br />
Gaia (Energia), Portugal<br />
• Simeon Cheng, CLP Holdings, China (Chair,<br />
Industry)<br />
• Sung Gil Cho, Korea East-West Power, Korea<br />
• Hélène Connor, HELIO International, France<br />
• Lily Donge, Calvert Asset Management, USA<br />
• Laura Douglas, E.ON US, USA<br />
• Elissa Freeman, Public Interest Advocacy Centre,<br />
Australia<br />
• Monali Zeya Hazra, Centre for Science and<br />
Environment, India<br />
• Svetlana Klimyuk, OGK-2, Russia<br />
• Derek C. Knudsen, BC Hydro, Canada<br />
EU<br />
• Humberto Barbosa de Las Casas, Companhia<br />
Energética de Minas Gerais (Cemig), Brazil<br />
• Feng S. Li, China Resources Power Holding Co. Ltd,<br />
People’s Republic of China<br />
• Marina Liborakina, RAO UES, Russia<br />
• Dave Lucas, Eskom, South Africa<br />
• Dominic Marchand, Hydro Québec, Canada<br />
• Hans-Peter Meurer, RWE, Germany<br />
• Laurent Milliat, Dexia, Belgium<br />
• Raul Montenegro, Fundación para la defensa del<br />
ambiente, Argentina<br />
• Koji Nagano, Central Research Institute of <strong>Electric</strong><br />
Power Industry, Japan<br />
• Sandy Nessing, American <strong>Electric</strong> Power, USA<br />
• Hans Nooter, Nuon, The Netherlands<br />
• Pierluigi Orati, Enel, Italy<br />
• Niels Strange Peulicke-Andersen, DONG Energy,<br />
Denmark<br />
• Susie Cristina Pontarolli, Copel, Brazil<br />
• Veena Ramani, Ceres, USA<br />
• Juan David Echeverri Rendon, EPM, Colombia<br />
• Stefan Larenas Riobo, Organización de<br />
Consumidores y Usaurios de Chile, Chile<br />
• Kwanghoon Seok, Green Korea United, Japan<br />
• Rory Sullivan, Insight Investment, UK<br />
• Myriam Truchon, Hydro Québec, Canada<br />
• Sam Weinstein, Utility Workers Union of America<br />
AFL-CIO, USA<br />
• Heidi Welsh, RiskMetrics, USA<br />
• Jean-Paul Zalaquett, Chilectra, Chile<br />
60<br />
© 2000-2009 GRI
Legal Liability<br />
This document, designed to promote sustainability<br />
reporting, has been developed through a unique<br />
multi-stakeholder consultative process involving<br />
representatives from reporting organizations and<br />
report information users from around the world. While<br />
the GRI Board of Directors encourage use of the GRI<br />
Sustainability <strong>Reporting</strong> Guidelines (GRI Guidelines)<br />
by all organizations, the preparation and publication<br />
of reports based fully or partially on the GRI Guidelines<br />
is the full responsibility of those producing them.<br />
Neither the GRI Board of Directors nor Stichting <strong>Global</strong><br />
<strong>Reporting</strong> <strong>Initiative</strong> can assume responsibility for<br />
any consequences or damages resulting directly or<br />
indirectly, from the use of the GRI Guidelines in the<br />
preparation of reports or the use of reports based on the<br />
GRI Guidelines.<br />
Request for Notification of Use<br />
Organizations that have used the Guidelines and/or<br />
other elements of the GRI <strong>Reporting</strong> Framework as the<br />
basis for their report are requested to notify the <strong>Global</strong><br />
<strong>Reporting</strong> <strong>Initiative</strong> upon its release. While notifying<br />
GRI, organizations can choose any or all of the following<br />
options:<br />
• Simply notify the GRI of the report and provide<br />
hard and/or soft copy<br />
• Register their report in GRI’s online database of<br />
reports<br />
• Request GRI check their self-declared Application<br />
Level.<br />
Sustainability <strong>Reporting</strong> Guidelines & <strong>Electric</strong> Utility <strong>Sector</strong> <strong>Supplement</strong><br />
Further information on the GRI and the<br />
Sustainability <strong>Reporting</strong> Guidelines may be<br />
obtained from:<br />
www.globalreporting.org<br />
info@globalreporting.org<br />
<strong>Global</strong> <strong>Reporting</strong> <strong>Initiative</strong><br />
PO Box 10039<br />
1001 EA Amsterdam<br />
The Netherlands<br />
Tel: +31 (0) 20 531 00 00<br />
Fax: +31 (0) 20 531 00 31<br />
© 2000-2009 <strong>Global</strong> <strong>Reporting</strong> <strong>Initiative</strong>.<br />
All rights reserved.<br />
Sustainability <strong>Reporting</strong> Guidelines, Version 3.0 © 2006<br />
<strong>Electric</strong> Utility <strong>Sector</strong> <strong>Supplement</strong>, Version Pilot © 2007<br />
<strong>Electric</strong> Utility <strong>Sector</strong> <strong>Supplement</strong>, Final Version © 2009<br />
RG<br />
&<br />
EUSS<br />
EU<br />
Copyright and Trademark Notice<br />
This document is copyright-protected by Stichting<br />
<strong>Global</strong> <strong>Reporting</strong> <strong>Initiative</strong> (GRI). The reproduction and<br />
distribution of this document for information and/or<br />
use in preparing a sustainability report is permitted<br />
without prior permission from GRI. However, neither this<br />
document nor any extract from it may be reproduced,<br />
stored, translated, or transferred in any form or by any<br />
means (electronic, mechanical, photocopied, recorded,<br />
or otherwise) for any other purpose without prior<br />
written permission from GRI.<br />
<strong>Global</strong> <strong>Reporting</strong> <strong>Initiative</strong>, the <strong>Global</strong> <strong>Reporting</strong><br />
<strong>Initiative</strong> logo, Sustainability <strong>Reporting</strong> Guidelines, and<br />
GRI are trademarks of the <strong>Global</strong> <strong>Reporting</strong> <strong>Initiative</strong>.<br />
RG Version 3.0/EUSS Final Version<br />
61
EU<br />
GRI Application Levels<br />
© 2000-2011 GRI Version 3.0
© 2000-2011 GRI Version 3.1
GRI Application Levels<br />
AL<br />
GRI Application Levels<br />
Brief overview<br />
To indicate that a report is GRI-based, report makers<br />
should declare the level to which they have applied the<br />
GRI <strong>Reporting</strong> Framework via the “Application Levels”<br />
system.<br />
To meet the needs of beginners, advanced reporters,<br />
and those somewhere in between, there are three levels<br />
in the system. They are titled C, B, and A. The reporting<br />
criteria at each level reflect a measure of the extent of<br />
application or coverage of the GRI <strong>Reporting</strong> Framework.<br />
A “plus” (+) is available at each level (ex., C+, B+, A+) if<br />
external assurance was utilized for the report.<br />
How the system works<br />
A report maker self-declares a Level based on its own<br />
assessment of its report content against the criteria in<br />
the GRI Application Levels (see overleaf).<br />
In addition to the self-declaration, reporting<br />
organizations can choose one or both of the following<br />
options:<br />
• Have a third party offer an opinion on the selfdeclaration<br />
• Request that the GRI check the self-declaration.<br />
Value of the Levels<br />
The Levels aim to provide:<br />
• Report readers with a measure of the extent to<br />
which the GRI Guidelines and other <strong>Reporting</strong><br />
Framework elements have been applied in the<br />
preparation of a report.<br />
• Report makers with a vision or path for<br />
incrementally expanding application of the GRI<br />
<strong>Reporting</strong> Framework over time.<br />
Declaring an Application Level clearly communicates<br />
which elements of the GRI <strong>Reporting</strong> Framework have<br />
been applied in the preparation of a report.<br />
• Incentives for beginners: The Levels provide a<br />
starting point for first-time report makers, and<br />
also reinforce the importance and value of an<br />
incremental approach to reporting which expands<br />
over time.<br />
• Recognizing advanced reporters: A growing<br />
number of organizations have developed<br />
sophisticated reporting systems based on the<br />
GRI Framework, that include assurance, and are<br />
looking to communicate this to readers in a quick<br />
and easy-to-understand way.<br />
Version 3.0<br />
1
AL<br />
GRI Application Levels<br />
Application Level Criteria<br />
Reports intended to qualify for level C, C+, B, B+, A or A+<br />
must contain each of the criteria that are presented in<br />
the column for the relevant Level.<br />
GRI recommends reporting organizations include the<br />
Application Level table in their report as it illustrates the<br />
value and requirements of the system to report readers.<br />
APPENDIX A – FINAL VERSION GRI APPLICATION LEVELS APPROVED BY THE GRI BOARD OF DIRECTORS JULY 2006<br />
Report<br />
Application Level<br />
C C + B B + A A +<br />
Standard Disclosures<br />
Profile<br />
Disclosures<br />
Disclosures on<br />
Management<br />
Approach<br />
Performance<br />
Indicators &<br />
<strong>Sector</strong> <strong>Supplement</strong><br />
Performance Indicators<br />
OUTPUT OUTPUT<br />
OUTPUT<br />
Report on:<br />
1.1<br />
2.1 - 2.10<br />
3.1 - 3.8, 3.10 - 3.12<br />
4.1 - 4.4 , 4.14 - 4.15<br />
Not Required<br />
Report fully on a minimum of any 10<br />
Performance Indicators, including<br />
at least one from each of: social,<br />
economic, and environment.**<br />
Report Externally Assured<br />
Report on all criteria listed for<br />
Level C plus:<br />
1.2<br />
3.9, 3.13<br />
4.5 - 4.13, 4.16 - 4.17<br />
Management Approach Disclosures<br />
for each Indicator Category<br />
Report fully on a minimum of any 20<br />
Performance Indicators, at least<br />
one from each of: economic,<br />
environment, human rights, labor,<br />
society, product responsibility.***<br />
Report Externally Assured<br />
Same as requirement for Level B<br />
Management Approach disclosed for<br />
each Indicator Category<br />
Respond on each core and <strong>Sector</strong><br />
<strong>Supplement</strong>* indicator with due<br />
regard to the materiality Principle<br />
by either: a) reporting on the<br />
indicator or b) explaining the reason<br />
for its omission.<br />
Report Externally Assured<br />
* <strong>Sector</strong> supplement in final version<br />
** Performance Indicators may be selected from any finalized <strong>Sector</strong> <strong>Supplement</strong>, but 7 of the 10 must be from the original GRI Guidelines<br />
*** Performance Indicators may be selected from any finalized <strong>Sector</strong> <strong>Supplement</strong>, but 14 of the 20 must be from the original GRI Guidelines<br />
Declaring an Application Level<br />
A GRI Application Level declaration should be included<br />
in the report. It needs to be indicated who has made this<br />
assessment.<br />
<strong>Reporting</strong> organizations may exercise their option<br />
to seek opinions from a third party or request a GRI<br />
Application Level Check to confirm their self-declaration.<br />
Both self-declarations and third party statements should<br />
be indicated in the report by including appropriate text.<br />
More information on ‘Options for Declaration’ can be<br />
found at www.globalreporting.org.<br />
Having successfully completed a GRI Application Level<br />
Check, reporting organizations should include the<br />
customized GRI Application Level Check Statement in<br />
their report, which incorporates the special GRI-Checked<br />
icon.<br />
The GRI Application Level Check Statement serves as the<br />
formal confirmation of the Application Level Check.<br />
GRI recommends reporting organizations publish this<br />
Statement near the GRI Content Index.<br />
GRI will only recognize reports on its website as GRIbased<br />
if they contain, at minimum, a GRI Content Index.<br />
The GRI Content Index lists every Guidelines disclosure<br />
addressed in a report. The Index complements, and<br />
should correspond to, an Application Level declaration.<br />
It communicates which GRI disclosures have been<br />
reported, and the reason why certain disclosures have<br />
not been reported. The Index is also the gateway for<br />
finding all reported sustainability information. It should<br />
be able to easily have clear and direct referencing, and<br />
if used online, can be an interactive navigation tool. By<br />
using the Index, report users should be able to easily<br />
find specific data.<br />
2<br />
© 2000-2011 GRI
GRI Application Levels<br />
AL<br />
Application Level check methodology<br />
The most important aspect of the GRI Application<br />
Level Check revolves around the GRI Content Index.<br />
This Index is the basis for determining whether or not<br />
an organization has reported on the required set and<br />
number of standard disclosures (Profile Disclosures,<br />
Disclosures on Management Approach, Performance<br />
Indicators) for a particular Application Level.<br />
When GRI finds that the Index does not meet the<br />
requirements for the Application Level declared by the<br />
organization, a set of action points will be provided to<br />
the reporting organization in order to correct this.<br />
A GRI Content Index template (Excel file) can be<br />
downloaded from GRI’s website, which a reporting<br />
organization is required to complete for the GRI<br />
Application Level Check and can also be included in its<br />
report.<br />
As a secondary step, GRI takes a sample of the standard<br />
disclosures and determines whether the reporting<br />
claims made in the Index can be substantiated. For this<br />
purpose, GRI checks the text to see if:<br />
• A quantitative standard disclosure has been<br />
answered with a quantitative response in-line with<br />
the disclosure.<br />
• A qualitative standard disclosure has been<br />
answered with a qualitative response in-line with<br />
the disclosure.<br />
Application Levels and assurance<br />
GRI recommends the use of external assurance.<br />
For each of the Application Levels, a “+” can be added<br />
to the Level when a reporting organization has had its<br />
reporting externally assured. GRI has identified six key<br />
qualities for external assurance of reports. The external<br />
assurance:<br />
• should be conducted by groups or individuals<br />
external to the organization who are demonstrably<br />
competent in both the subject matter and<br />
assurance practices;<br />
• is implemented in a manner that is systematic,<br />
documented, evidence-based, and is characterized<br />
by defined procedures;<br />
• assesses whether the report provides a reasonable<br />
and balanced presentation of performance, taking<br />
into consideration the veracity of the data in a<br />
report as well as the overall selection of content;<br />
• utilizes groups or individuals to conduct the<br />
assurance who are not unduly limited by<br />
their relationship with the organization or its<br />
stakeholders to reach and publish an independent<br />
and impartial conclusion on the report;<br />
• assesses the extent to which the report preparer<br />
has applied the GRI <strong>Reporting</strong> Framework<br />
(including the <strong>Reporting</strong> Principles) in the course<br />
of reaching its conclusions; and<br />
• results in an opinion or set of conclusions that is<br />
publicly available in written form, and a statement<br />
from the assurance provider on their relationship<br />
to the report preparer.<br />
If GRI is requested to check a “plus” (+) level report it<br />
will check for the presence of a statement from the<br />
assurance provider but will not conduct reviews to<br />
determine whether external assurance has met the<br />
above-listed criteria.<br />
The Application Levels are intended to demonstrate a<br />
pathway for incrementally expanding approaches to<br />
reporting using the GRI <strong>Reporting</strong> Framework. They are<br />
in no way intended as substitutes for or equivalents to<br />
external assurance.<br />
Version 3.0<br />
3
EU<br />
Indicator Protocols Set<br />
Economic (EC)<br />
© 2000-2011 GRI Version 3.0/EUSS Final Version
Economic<br />
<strong>Electric</strong> <strong>Utilities</strong> <strong>Sector</strong> Specific<br />
Disclosures on Management<br />
Approach<br />
Aspect: Availability and Reliability<br />
CO R E<br />
EU6. Management approach to ensure short and<br />
long-term electricity availability and reliability.<br />
Aspect: Demand-Side Management<br />
EU7. Demand-side management programs<br />
including residential, commercial, institutional<br />
and industrial programs.<br />
Aspect: Research and Development<br />
EU<br />
CO R E<br />
CO R E<br />
EU8. Research and development activity and<br />
expenditure aimed at providing reliable<br />
electricity and promoting sustainable<br />
development.<br />
Aspect: Plant Decommissioning<br />
CO R E<br />
EU9. Provisions for decommissioning of nuclear<br />
power sites.<br />
Aspect: Market Presence<br />
A D D<br />
CO R E<br />
CO R E<br />
EC5<br />
EC6<br />
EC7<br />
Indicator Protocols Set: EC<br />
Range of ratios of standard entry level<br />
wage compared to local minimum wage at<br />
significant locations of operation.<br />
Policy, practices, and proportion of spending<br />
on locally-based suppliers at significant<br />
locations of operation.<br />
Procedures for local hiring and proportion of<br />
senior management hired from the local<br />
community at significant locations of operation.<br />
Aspect: Indirect Economic Impacts<br />
CO R E<br />
EC8<br />
Development and impact of infrastructure<br />
investments and services provided primarily for<br />
public benefit through commercial, in-kind, or<br />
pro bono engagement.<br />
IP<br />
&<br />
EUSS<br />
Performance Indicators<br />
A D D<br />
EC9<br />
Understanding and describing significant<br />
indirect economic impacts, including the<br />
extent of impacts.<br />
EU<br />
Aspect: Economic Performance<br />
Aspect: Availability and Reliability<br />
CO R E CO R E CO R E<br />
EC1<br />
EC2<br />
EC3<br />
Direct economic value generated and<br />
distributed, including revenues, operating<br />
costs, employee compensation, donations<br />
and other community investments, retained<br />
earnings, and payments to capital providers<br />
and governments.<br />
Financial implications and other risks and<br />
opportunities for the organization’s activities<br />
due to climate change.<br />
Coverage of the organization’s defined benefit<br />
plan obligations.<br />
CO R E<br />
EU10. Planned capacity against projected electricity<br />
demand over the long term, broken down by<br />
energy source and regulatory regime.<br />
Aspect: Demand-Side Management<br />
CO R E<br />
EU11. Average generation efficiency of thermal<br />
plants by energy source and by regulatory<br />
regime.<br />
Aspect: System Efficiency<br />
CO R E<br />
EU12. Transmission and distribution losses as a<br />
percentage of total energy.<br />
EU<br />
CO R E<br />
EC4<br />
Significant financial assistance received from<br />
government.<br />
Version 3.0/EUSS Final Version<br />
1
IP<br />
&<br />
EUSS<br />
Indicator Protocols Set: EC<br />
Relevance<br />
Performance data generated in response to the<br />
Indicators in this section are expected to illustrate:<br />
in other Protocols, including:<br />
• <br />
EC1-2.1c, EC5, and LA14 regarding wages;<br />
• The flow of capital amongst different stakeholders;<br />
and<br />
• The major economic impacts of the organization<br />
throughout society.<br />
• <br />
• <br />
EC1-2.1c, EC3, and LA3 regarding employee<br />
benefits;<br />
EC1-2.1f, EC6, EC8, and SO1 regarding interactions<br />
with local communities;<br />
EU<br />
An organization’s economic performance is fundamental<br />
to understanding the organization and its basis for<br />
sustainability. However, this information is already well<br />
reported in many countries in annual financial accounts<br />
and reports. Financial statements provide information<br />
about the financial position, performance, and changes<br />
in the financial position of an entity. They also indicate<br />
the results achieved in managing the financial capital<br />
provided to the organization.<br />
What is reported less frequently, but often desired by<br />
readers of sustainability reports, is the organization’s<br />
contribution to the sustainability of the economic<br />
systems in which the organization operates. An<br />
organization may be financially viable, but this may<br />
have been achieved by creating significant externalities<br />
that impact other stakeholders. Economic Performance<br />
Indicators are intended to measure the economic<br />
outcomes of an organization’s activities and the effect of<br />
these outcomes on a broad range of stakeholders.<br />
The Indicators in this section are divided into three<br />
categories:<br />
1. Economic Performance. This category of Indicators<br />
addresses the direct economic impacts of the<br />
organization’s activities and the economic value<br />
added by these activities.<br />
2. Market Presence. These Indicators provide<br />
information about interactions in specific markets.<br />
3. Indirect Economic Impacts. These Indicators measure<br />
the economic impacts created as a result of the<br />
organization’s economic activities and transactions.<br />
There are several linkages between different Economic<br />
Indicators. Elements of the value-added table in EC1 are<br />
related to other Economic Indicators, and there are also<br />
connections between wages and benefits (EC1-2.1c and<br />
EC5), transactions with governments (EC1-2.1e and EC4),<br />
and community investments (EC1-2.1f and EC8). The<br />
Economic Indicators are also closely related to Indicators<br />
• <br />
• <br />
EC2 (climate change risk) and EN3 (direct energy<br />
consumption); and<br />
EC10 (indirect economic impacts) and SO1 (socioeconomic<br />
impacts on communities).<br />
Definitions<br />
Significant locations of operation<br />
Locations where single-market revenues, costs, stakeholder<br />
payments, production, or employee numbers<br />
represent a significant share of the organization’s global<br />
total, and are sufficient to be particularly important to<br />
decision-making by the organization or its stakeholders.<br />
Combined, these locations would likely represent the<br />
majority of the above figures. <strong>Reporting</strong> organizations<br />
should identify and explain the specific criteria used to<br />
determine what is significant. <strong>Reporting</strong> organizations<br />
should use International Accounting Standards 14 (IAS14)<br />
as a reference in defining significant locations of operation.<br />
General References<br />
• <br />
The International Accounting Standards Board<br />
(IASB) website (www.iasb.org) provides information<br />
about relevant International Financial <strong>Reporting</strong><br />
Standards (IFRS).<br />
• In preparing responses to the Economic Indicators,<br />
data should be compiled from figures in the<br />
organization’s audited financial accounts or<br />
its internally audited management accounts,<br />
wherever possible. In all cases, the data should be<br />
compiled using either:<br />
• <br />
The relevant International Financial <strong>Reporting</strong><br />
Standards (IFRS) and Interpretations of Standards,<br />
published by the International Accounting<br />
Standards Board (IASB) (some Indicator Protocols<br />
reference specific International Accounting<br />
Standards, which should be consulted); or<br />
2<br />
© 2000-2009 GRI
Indicator Protocols Set: EC<br />
IP<br />
&<br />
EUSS<br />
• National or regional standards recognized<br />
inter-nationally for the purpose of financial<br />
reporting.<br />
The reporting organization should clearly indicate which<br />
standards were applied and provide clear references to<br />
the relevant sources.<br />
Segmental reporting<br />
<strong>Reporting</strong> organizations should use International<br />
Accounting Standards 14 (IAS14) as a reference in<br />
defining ‘local’, as required by Indicators EC1, EC5, EC6,<br />
and EC7.<br />
EU<br />
Version 3.0/EUSS Final Version<br />
3
IP<br />
&<br />
EUSS<br />
EU<br />
Indicator Protocols Set: EC<br />
EU6: Management approach to ensure<br />
short and long-term electricity availability<br />
and reliability.<br />
1. Relevance<br />
This provides information on the reporting organization’s<br />
plans and processes to ensure reliability, delivering<br />
sufficient capacity to the market and ensuring the grid<br />
capacity to transport or distribute to the customer. This<br />
is an important sustainability issue since electricity is an<br />
essential service for socio-economic stability. Daily lives<br />
are increasingly dependent on electricity,which is key for<br />
enabling access to many technologies and services.<br />
This indicator is closely linked to EU10 which describes<br />
the planned capacity (in MW) against projected<br />
electricity demand.<br />
2. Compilation<br />
2.1 Identify approaches to assess key challenges<br />
related to meeting the balance of supply and<br />
demand (e.g. timing of investments) or market<br />
needs. These approaches can include scenario<br />
planning or alternatives analysis (e.g. Integrated<br />
Resource Planning) to evaluate different sites,<br />
technologies and social, environmental, regulatory<br />
and economic implications.<br />
2.2 Report management approaches to address each<br />
challenge. These approaches can include:<br />
• Short and long-term maintenance practices;<br />
• Peak load management, such as orderly planned<br />
interruptible supply agreements to ensure<br />
electricity supply.<br />
• Investment or divestment in generation,<br />
transmission and distribution and demand<br />
management, (e.g. maintain reserve levels,<br />
smart grids).<br />
3. Definitions<br />
None.<br />
4. Documentation<br />
Resource planning department, operations and<br />
distribution services and public records/information<br />
5. References<br />
None.<br />
<strong>Electric</strong> Utility <strong>Sector</strong> <strong>Supplement</strong><br />
EU<br />
4<br />
© 2000-2009 GRI
Indicator Protocols Set: EC<br />
IP<br />
&<br />
EUSS<br />
EU7: Demand-side management<br />
programs including residential,<br />
commercial, institutional and industrial<br />
programs.<br />
1. Relevance<br />
The primary objective of most demand-side<br />
management (DSM) programs is to provide costeffective<br />
energy and capacity resources to help defer<br />
the need for new sources of power, including generating<br />
facilities, power purchases, and transmission and<br />
distribution capacity additions. Some electric utilities<br />
are also using DSM as a way to enhance customer service<br />
and demonstrate action on climate change.<br />
2. Compilation<br />
2.1 Programs will involve different forms of interaction<br />
between the utility and the customer. For<br />
example, the interaction could be based on<br />
provision of advisory services, energy-saving<br />
equipment, or tariff incentives or it could be based<br />
on the customer receiving information such as<br />
educational brochures.<br />
3. Definitions<br />
Demand-Side Management<br />
The planning, implementation and monitoring of utility<br />
activities designed to encourage customers to modify<br />
patterns of electricity usage is called Demand Side<br />
Management (DSM). DSM affects the timing and level<br />
of electricity demand by encouraging the use of energy<br />
efficient devices and enhanced customer behaviour to<br />
reduce demand and waste of energy.<br />
4. Documentation<br />
This information may come from regulatory filings<br />
by regulatory regime and project information. For<br />
deregulated markets information can be derived from<br />
operational information or agreements with customers.<br />
5. References<br />
None.<br />
2.2 Identify demand side management initiatives in<br />
terms of:<br />
• Investments;<br />
• Program objectives;<br />
• Methodology used to monitor and evaluate<br />
programs<br />
• <strong>Initiative</strong>s mandated and incentivized by<br />
government; and<br />
• Results identified including MWh saved or MW<br />
load shifted and underlying assumptions.<br />
DSM covers the complete range of load-shaped<br />
objectives, including strategic conservation and<br />
load management, as well as strategic load growth.<br />
It refers to any energy and load-shape modifying<br />
activities in response to utility-administered<br />
programs.<br />
2.3 Report separately on demand-side programs and<br />
broken down by:<br />
• Residential;<br />
• Commercial;<br />
• Institutional (e.g. government, health, nonprofits);<br />
and<br />
• Industrial customers.<br />
EU<br />
EU<br />
Version 3.0/EUSS Final Version<br />
5
IP<br />
&<br />
EUSS<br />
EU<br />
Indicator Protocols Set: EC<br />
EU8: Research and development activity<br />
and expenditure aimed at providing<br />
reliable electricity and promoting<br />
sustainable development.<br />
1. Relevance<br />
Research and development into providing reliable and<br />
sustainable electricity is an important part of today’s<br />
energy landscape. In particular, it is important that<br />
energy utilities find new, more sustainable ways of<br />
providing energy.<br />
2. Compilation<br />
2.1 Report Research and Development (R&D)<br />
activities in areas of direct expenditures and<br />
research collaboration. Provide a breakdown of<br />
R&D expenditure, drawing particular attention to<br />
categories relating to sustainable development.<br />
These categories might include:<br />
• Energy efficiency;<br />
• Renewable energy technologies;<br />
• Distributed energy;<br />
• Transmission and distribution technologies e.g.<br />
smart grids and micro grids;<br />
• Advanced generation and technologies, e.g.<br />
carbon capture storage; and<br />
• Innovative sustainability related services e.g.<br />
smart metering.<br />
<strong>Electric</strong> Utility <strong>Sector</strong> <strong>Supplement</strong><br />
EU<br />
2.2 Report how these research and development<br />
activities are related to disclosures under EU5 and<br />
indicators associated with access to electricity.<br />
3. Definitions<br />
None.<br />
4. Documentation<br />
Potential information sources include R&D department,<br />
financial department, and embedded R&D functions<br />
within business units.<br />
5. References<br />
None.<br />
6<br />
© 2000-2009 GRI
EU9: Provisions for decommissioning of<br />
nuclear power sites.<br />
1. Relevance<br />
With new nuclear power sites coming on line and old<br />
sites being decommissioned it is essential that those<br />
energy utilities concerned have provisions in place for<br />
the safe decommissioning of their sites. This indicator<br />
provides information on the reporting organization’s<br />
means for decommissioning nuclear power sites. It<br />
ensures that the reporting organization has plans in<br />
place for the decommissioning of its sites and that they<br />
are carried out in a safe and secure manner that complies<br />
with international regulations. EU8 applies to electric<br />
utilities with existing or planned nuclear assets.<br />
Indicator Protocols Set: EC<br />
IP<br />
&<br />
EUSS<br />
2. Compilation<br />
2.1 Identify the discount rate and other financial<br />
assumptions used to report the provisions to give<br />
context to the estimated costs.<br />
2.2 Identify how the decommissioning will be funded.<br />
2.3 Identify how the relevant regulatory regime<br />
influences this issue.<br />
2.4 Identify the schedule of activities and progress.<br />
2.5 Report provisions, including estimated cost for<br />
closure and decommissioning of plants, and for site<br />
decontamination and restoration.<br />
3. Definitions<br />
Decommissioning of nuclear power sites<br />
Decommissioning involves a clean-up of all radioactive<br />
and any other harmful material and a progressive<br />
demolition of the plant.<br />
EU<br />
EU<br />
4. Documentation<br />
The financial statements will include details of costs,<br />
including the discount rates used.<br />
5. References<br />
• IAEA Safety Glossary, 2007 Edition<br />
http://www-pub.iaea.org/MTCD/publications/PDF/<br />
Pub1290_web.pdf provides examples of provisions.<br />
Version 3.0/EUSS Final Version<br />
7
IP<br />
&<br />
EUSS<br />
EU<br />
Indicator Protocols Set: EC<br />
EC1 Direct economic value generated<br />
and distributed, including revenues,<br />
operating costs, employee compensation,<br />
donations and other community investments,<br />
retained earnings, and payments<br />
to capital providers and governments.<br />
1. Relevance<br />
Data on the creation and distribution of economic value<br />
provide a basic indication of how the organization has<br />
created wealth for stakeholders. Several components of<br />
the Economic Value Generated and Distributed (EVG&D)<br />
table also provide an economic profile of the reporting<br />
organization, which may be useful for normalizing<br />
other performance figures. If presented in country-level<br />
detail, EVG&D can provide a useful picture of the direct<br />
monetary value added to local economies.<br />
2. Compilation<br />
2.1 Presentation:<br />
• The EVG&D data should be compiled, where<br />
possible, from data in the organization’s audited<br />
financial or profit and loss (P&L) statement, or<br />
its internally audited management accounts. It<br />
is also recommended that the economic value<br />
data be presented on an accruals basis in a table<br />
that includes the basic components for the<br />
organization’s global operations as included<br />
in the table below. Data can also be presented<br />
on a cash basis where this can be justified and<br />
disclosed in a table that includes the basic<br />
components as listed below.<br />
To better assess local economic impacts, EVG&D<br />
should be presented separately at country,<br />
regional, or market levels, where significant.<br />
<strong>Reporting</strong> organizations should identify and<br />
explain their criteria for defining significance.<br />
2.2 Guidance on EVG&D Table Line Entries<br />
a) Revenues:<br />
• Net sales equal gross sales from products<br />
and services minus returns, discounts, and<br />
allowances.<br />
• <br />
Revenue from financial investments<br />
includes cash received as interest<br />
on financial loans, as dividends from<br />
shareholdings, as royalties, and as direct<br />
income generated from assets (e.g.,<br />
property rental).<br />
• Revenues from sale of assets include<br />
physical assets (property, infrastructure,<br />
equipment) and intangibles (e.g.,<br />
intellectual property rights, designs, and<br />
brand names).<br />
Component<br />
Comment<br />
Direct economic value generated<br />
a) Revenues Net sales plus revenues from financial investments and<br />
sales of assets<br />
Economic value distributed<br />
b) Operating costs Payments to suppliers, non-strategic investments,<br />
royalties, and facilitation payments<br />
c) Employee wages and benefits Total monetary outflows for employees (current<br />
payments, not future commitments)<br />
d) Payments to providers of capital All financial payments made to the providers of the<br />
organization’s capital.<br />
e) Payments to government (by country – see note Gross taxes<br />
below)<br />
f) Community investments Voluntary contributions and investment of funds in the<br />
broader community (includes donations)<br />
Economic value retained (calculated as Economic Investments, equity release, etc.<br />
value generated less Economic value distributed)<br />
8<br />
© 2000-2009 GRI
Indicator Protocols Set: EC<br />
IP<br />
&<br />
EUSS<br />
b) Operating costs:<br />
• Cash payments made outside the reporting<br />
organization for materials, product<br />
components, facilities, and services<br />
purchased. This includes property rental,<br />
license fees, facilitation payments (since<br />
these have a clear commercial objective),<br />
royalties, payments for contract workers,<br />
employee training costs (where outside trainers<br />
are used), employee protective clothing, etc.<br />
c) Employee wages and benefits:<br />
• Total payroll means employee salaries,<br />
including amounts paid to government<br />
institutions (employee taxes, levies,<br />
and unemployment funds) on behalf of<br />
employees. Non-employees working in an<br />
operational role should normally not be<br />
included here, but rather under Operating<br />
Costs as a service purchased.<br />
• Total benefits include regular contributions<br />
(e.g., to pensions, insurance, company vehicles,<br />
and private health), as well as other employee<br />
support such as housing, interest-free loans,<br />
public transport assistance, educational grants,<br />
and redundancy payments. They do not<br />
include training, costs of protective equipment,<br />
or other cost items directly related to the<br />
employee’s job function.<br />
d) Payments to providers of funds:<br />
• Dividends to all shareholders;<br />
• Interest payments made to providers of loans.<br />
• This includes interest on all forms of debt and<br />
borrowings (not only long-term debt) and also<br />
arrears of dividends due to preferred shareholders.<br />
e) Payments to government:<br />
• All company taxes (corporate, income,<br />
property, etc.) and related penalties paid at<br />
the international, national, and local levels.<br />
This figure should not include deferred<br />
taxes because they may not be paid. For<br />
organizations operating in more than one<br />
country, report taxes paid by country. The<br />
organization should report which definition<br />
of segmentation has been used.<br />
f) Community investments:<br />
3. Definitions<br />
None<br />
• Voluntary donations and investment of funds<br />
in the broader community where the target<br />
beneficiaries are external to the company.<br />
These include contributions to charities,<br />
NGOs and research institutes (unrelated<br />
to the company’s commercial R&D), funds<br />
to support community infrastructure (e.g.,<br />
recreational facilities) and direct costs of social<br />
programs (including arts and educational<br />
events). The amount included should account<br />
for actual expenditures in the reporting<br />
period, not commitments.<br />
• For infrastructure investments, the calculation<br />
of the total investment should include costs<br />
of goods and labor in addition to capital costs.<br />
For support of ongoing facilities or programs<br />
(e.g., an organization funds the daily<br />
operations of a public facility), the reported<br />
investment should include operating costs.<br />
• This excludes legal and commercial activities<br />
or where the purpose of the investment is<br />
exclusively commercial. Donations to political<br />
parties are included but are also addressed<br />
separately in more detail in SO6.<br />
• Any infrastructure investment that is driven<br />
primarily by core business needs (e.g., building<br />
a road to a mine or factory) or to facilitate the<br />
business operations of the organization should<br />
not be included. The calculation of investment<br />
may include infrastructure built outside the<br />
main business activities of the reporting<br />
organization, such as a school or hospital for<br />
employees and their families.<br />
4. Documentation<br />
Finance, treasury, or accounting departments should<br />
have the information required by this Indicator.<br />
5. References<br />
• International Accounting Standard (IAS) 12 on<br />
Income Taxes, IAS 14 on segment <strong>Reporting</strong>, IAS<br />
18 on Revenues, and IAS 19 on Employee Benefits<br />
should be consulted.<br />
EU<br />
Version 3.0/EUSS Final Version<br />
9
IP<br />
&<br />
EUSS<br />
EU<br />
Indicator Protocols Set: EC<br />
EC2 Financial implications and<br />
other risks and opportunities for the<br />
organization’s activities due to climate<br />
change.<br />
1. Relevance<br />
Climate change presents risks and opportunities to<br />
organizations, their investors, and their stakeholders.<br />
Organizations may face physical risks due to changes<br />
in the climate system and weather patterns. These risks<br />
may include the impact of increased storms; changes in<br />
sea level, ambient temperature, and water availability;<br />
impacts on the workforce such as health effects (e.g.,<br />
heat-related illness or disease); or the need to relocate<br />
operations.<br />
As governments move to regulate activities that<br />
contribute to climate change, organizations that are<br />
directly or indirectly responsible for emissions face<br />
regulatory risk through increased costs or other factors<br />
impacting competitiveness. Limits on greenhouse gas<br />
emissions can also create opportunities for organizations<br />
as new technologies and markets are created. This is<br />
especially the case for organizations that can use or<br />
produce energy and energy products more efficiently.<br />
EN16 allows for disclosure on total amount of greenhouse<br />
gas emissions, while EN18 discloses total reductions<br />
achieved and initiatives for reducing the amount of<br />
emissions the reporting organization produces.<br />
2. Compilation<br />
2.1 Report whether the organization’s senior<br />
governance body considered climate change<br />
and the risks and opportunities it presents to the<br />
organization.<br />
• Potential competitive advantages created<br />
for the organization by regulatory or other<br />
technology changes linked to climate change.<br />
2.3 Report whether management has quantitatively<br />
estimated the financial implications (e.g., cost of<br />
insurance and carbon credits) of climate change<br />
for the organization. Where possible, quantification<br />
would be beneficial. If quantified, disclose financial<br />
implications and the tools used to quantify.<br />
3. Definitions<br />
None.<br />
4. Documentation<br />
Records or minutes of the organization’s governance<br />
bodies, including environmental committees may have<br />
the information required by this Indicator.<br />
5. References<br />
None.<br />
2.2 Report risks and/or opportunities posed by climate<br />
change that have potential financial implications<br />
for the organization, including:<br />
• Risks due to physical changes associated with<br />
climate change (e.g., impacts of modified<br />
weather patterns and heat-related illness);<br />
• Regulatory risks (e.g., the cost of activities and<br />
systems to comply with new regulations);<br />
• Opportunities to provide new technologies,<br />
products, or services to address challenges<br />
related to climate change; and<br />
10<br />
© 2000-2009 GRI
EC3 Coverage of the organization’s<br />
defined benefit plan obligations.<br />
1. Relevance<br />
When an organization provides a retirement plan for its<br />
workforce, these benefits could become commitments<br />
that members of the schemes plan on for their longterm<br />
economic well-being. Defined benefits plans have<br />
potential implications for employers in terms of the<br />
obligations that need to be met. Other types of plans,<br />
like defined contributions, do not guarantee access to<br />
a retirement plan or the quality of benefits. The type of<br />
plan chosen has implications for both employees and<br />
employers. Conversely, a properly funded pension plan<br />
can help to attract and maintain a stable workforce and<br />
support long-term financial and strategic planning on<br />
the part of the employer.<br />
2. Compilation<br />
2.1 Identify whether the structure of retirement plans<br />
offered to employees are based on:<br />
• Defined benefit plans; or<br />
• Other types of benefits.<br />
2.2 For defined benefit plans, identify whether the<br />
employer’s obligations to pay pensions under the<br />
plan are to be met directly by the organization’s<br />
general resources or through a fund held and<br />
maintained separately from the resources of the<br />
organization.<br />
2.3 Where the plan’s liabilities are met by the<br />
organization’s general resources, report the<br />
estimated value of those liabilities.<br />
2.4 Where a separate fund exists to pay the plan’s<br />
pension liabilities, report:<br />
Indicator Protocols Set: EC<br />
2.5 Where a fund set up to pay the plan’s pension<br />
liabilities is not fully covered, explain the strategy, if<br />
any, adopted by the employer to work towards full<br />
coverage, and the timescale, if any, by which the<br />
employer hopes to achieve full coverage.<br />
2.6 Report the percentage of salary contributed by<br />
employee or employer.<br />
2.7 Report the level of participation in retirement plans<br />
(e.g., participation in mandatory or voluntary<br />
schemes, regional or country-based schemes, or<br />
those with financial impact).<br />
2.8 Different jurisdictions (e.g., countries) have<br />
varying interpretations and guidance regarding<br />
calculations used to determine plan coverage.<br />
Calculate in accordance with the regulations and<br />
methods for relevant jurisdictions, and report<br />
aggregated totals. Consolidation techniques<br />
should be the same as those applied in preparing<br />
the financial accounts of the organization.<br />
Note that benefit pension plans are part of the<br />
International Accounting Standard (IAS) 19,<br />
however, IAS 19 covers more issues.<br />
3. Definitions<br />
Full coverage<br />
Plan assets that meet or exceed plan obligations.<br />
4. Documentation<br />
Finance or accounting departments should have the<br />
information required by this Indicator.<br />
5. References<br />
• International Accounting Standard (IAS) 19 on<br />
Employee Benefits .<br />
IP<br />
&<br />
EUSS<br />
EU<br />
• The extent to which the scheme’s liabilities<br />
are estimated to be covered by the assets that<br />
have been set aside to meet them;<br />
• The basis on which that estimate has been<br />
arrived at; and<br />
• When that estimate was made.<br />
Version 3.0/EUSS Final Version<br />
11
IP<br />
&<br />
EUSS<br />
Indicator Protocols Set: EC<br />
EC4 Significant financial assistance<br />
received from government.<br />
1. Relevance<br />
This Indicator provides a measure of host governments’<br />
contributions to the reporting organization. The<br />
significant financial assistance received from a<br />
government, in comparison with taxes paid, can<br />
be useful for developing a balanced picture of the<br />
transactions between the reporting organization and<br />
government.<br />
2. Compilation<br />
2.1 Report significant estimated aggregate financial<br />
value on an accruals basis for the following:<br />
4. Documentation<br />
Financial accountants include items of IAS 20 individually<br />
but these are not consolidated, as this Indicator requires.<br />
5. References<br />
• International Accounting Standard (IAS) 20 on<br />
Accounting for Government Grants and Disclosure<br />
of Government Assistance.<br />
• Tax relief/credits;<br />
• Subsidies;<br />
• Investment grants, research and development<br />
grants, and other relevant types of grants;<br />
• Awards;<br />
EU<br />
• Royalty holidays;<br />
• Financial assistance from Export Credit<br />
Agencies (ECAs);<br />
• Financial incentives; and<br />
• Other financial benefits received or receivable<br />
from any government for any operation.<br />
2.2 Report whether the government is present in the<br />
shareholding structure.<br />
3. Definitions<br />
Significant financial assistance<br />
Significant direct or indirect financial benefits that do not<br />
represent a transaction of goods and services, but which<br />
are an incentive or compensation for actions taken, the<br />
cost of an asset, or expenses incurred. The provider of<br />
financial assistance does not expect a direct financial<br />
return from the assistance offered.<br />
12<br />
© 2000-2009 GRI
EC5 Range of ratios of standard entry<br />
level wage compared to local minimum<br />
wage at significant locations of<br />
operation.<br />
1. Relevance<br />
Economic well-being is one of the ways in which an<br />
organization invests in its employees. This Indicator<br />
helps demonstrate how an organization contributes to<br />
the economic well-being of employees in significant<br />
locations of operation. The Indicator also provides an<br />
indication of the competitiveness of the organization’s<br />
wages, and information relevant for assessing the effect<br />
of wages on the local labor market. Offering wages<br />
above the minimum can be one factor in building<br />
strong community relations, employee loyalty, and<br />
strengthening an organization’s social license to operate.<br />
This Indicator is most relevant for organizations in which<br />
a substantial portion of their workforce is compensated<br />
in a manner or scale that is closely linked to laws or<br />
regulations on minimum wage.<br />
2. Compilation<br />
2.1 Identify whether a significant proportion of the<br />
workforce is compensated based on wages subject<br />
to minimum wage rules.<br />
2.2 In percentage terms, compare local minimum<br />
wage to the reporting organization’s entry level<br />
wage at significant locations of operation.<br />
3. Definitions<br />
Local minimum wage<br />
Indicator Protocols Set: EC<br />
Minimum wage refers to compensation per hour or other<br />
unit of time for employment allowed under law. Since<br />
some countries have numerous minimum wages (e.g.,<br />
by state/province or by employment category) identify<br />
which minimum wage is being used.<br />
Entry level wage<br />
Entry level wage should be defined by the full-time<br />
wage offered to an employee in the lowest employment<br />
category. Intern or apprentice wages should not be<br />
considered.<br />
4. Documentation<br />
Potential sources of information include the payroll<br />
department of the organization or finance, treasury,<br />
or accounting departments. Pertinent legislation in<br />
each country/region of operation may also provide<br />
information for this Indicator.<br />
5. References<br />
None.<br />
IP<br />
&<br />
EUSS<br />
EU<br />
2.3 Identify the variation in the ratios across significant<br />
locations of operation.<br />
2.4 Report the distribution of the ratio of the entry<br />
level wage to the minimum wage.<br />
2.5 Report the definition used for ‘significant locations’.<br />
2.6 For organizations that only offer salaried<br />
employment, the salary should be converted into<br />
an hourly estimate.<br />
2.7 Indicate whether a local minimum wage is absent<br />
or variable in significant locations of operation. In<br />
circumstances in which different minimums could<br />
be used as a reference, explain which minimum<br />
wage is being used.<br />
Version 3.0/EUSS Final Version<br />
13
IP<br />
&<br />
EUSS<br />
EU<br />
Indicator Protocols Set: EC<br />
EC6 Policy, practices, and proportion of<br />
spending on locally-based suppliers at<br />
significant locations of operation.<br />
1. Relevance<br />
The influence an organization can have on a local<br />
economy goes beyond direct jobs and payment of<br />
wages and taxes. By supporting local business in the<br />
supply chain, an organization can indirectly attract<br />
additional investment to the local economy.<br />
<strong>Reporting</strong> organizations can gain or retain their ‘social<br />
license to operate’ in part by demonstrating positive<br />
local economic impacts. Local sourcing can be a strategy<br />
to help ensure supply, support a stable local economy,<br />
and can prove to be more efficient for remote settings.<br />
The proportion of local spending can also be an<br />
important factor in contributing to the local economy<br />
and maintaining community relations. However, the<br />
overall impact of local sourcing will also depend on the<br />
sustainability of the supplier over the long term.<br />
2. Compilation<br />
2.1 Report the organization’s geographic definition of<br />
‘local’.<br />
2.2 For the following calculations, note that<br />
percentages should be based on invoices or<br />
commitments made during the reporting period<br />
(i.e., accruals accounting).<br />
3. Definitions<br />
Locally-based suppliers<br />
Providers of materials, products, and services that are<br />
based in the same geographic market as the reporting<br />
organization (i.e., no trans-national payments to the<br />
supplier are made). The geographic definition of ‘local’<br />
may vary because, in some circumstances, cities, regions<br />
within a country, and even small countries could be<br />
reasonably viewed as ‘local’.<br />
4. Documentation<br />
None.<br />
5. References<br />
None.<br />
2.3 Report whether the organization has a policy or<br />
common practices for preferring locally based<br />
suppliers either organization-wide or for specific<br />
locations.<br />
2.4 If so, state the percentage of the procurement<br />
budget used for significant locations of operation<br />
that is spent on suppliers local to that operation<br />
(e.g., % of goods and supplies purchased locally).<br />
Local purchases can be made either from a budget<br />
managed at the location of operation or at the<br />
organization’s headquarters.<br />
2.5 Indicate the factors that influence supplier<br />
selection (e.g., costs, environmental and social<br />
performance) in addition to their geographic<br />
location.<br />
14<br />
© 2000-2009 GRI
EC7 Procedures for local hiring and<br />
proportion of senior management hired<br />
from the local community at significant<br />
locations of operation.<br />
1. Relevance<br />
Selection of staff and senior management is based<br />
on a range of considerations. Ensuring that senior<br />
management is populated with local residents can<br />
benefit the local community and the organization’s<br />
ability to understand local needs. Diversity within a<br />
management team and the inclusion of members from<br />
the local area can enhance human capital, the economic<br />
benefit to the local community, and the organization’s<br />
ability to understand local needs.<br />
Indicator Protocols Set: EC<br />
IP<br />
&<br />
EUSS<br />
2. Compilation<br />
2.1 Report whether the organization has a global<br />
policy or common practices for granting<br />
preference to local residents when hiring in<br />
significant locations of operation.<br />
2.2 If so, report the proportion of senior management<br />
in significant locations of operation from the local<br />
community. Use data on full-time employees to<br />
calculate this percentage.<br />
2.3 Report the definition of ‘senior management’ used.<br />
EU<br />
3. Definitions<br />
Local<br />
Local refers to individuals either born in or who have the<br />
legal right to reside indefinitely (e.g., naturalized citizens<br />
or permanent visa holders) in the same geographic<br />
market as the operation. <strong>Reporting</strong> organizations can<br />
choose their own definition of ‘local’ because, in some<br />
cases, cities, regions, and even small countries could<br />
be reasonably viewed as local. However, the definition<br />
should be clearly disclosed.<br />
4. Documentation<br />
Personnel or human resources departments should have<br />
the information required by this Indicator.<br />
5. References<br />
None.<br />
Version 3.0/EUSS Final Version<br />
15
IP<br />
&<br />
EUSS<br />
Indicator Protocols Set: EC<br />
EC8 Development and impact of infrastructure<br />
investments and services<br />
provided primarily for public benefit<br />
through commercial, in-kind, or pro bono<br />
engagement.<br />
1. Relevance<br />
As well as generating and distributing economic value, an<br />
organization can affect an economy through its investments<br />
in infrastructure. The impacts of infrastructure investment<br />
can extend beyond the scope of the organization’s own<br />
business operations and over a longer timescale. This might<br />
include transport links, utilities, community social facilities,<br />
sports centers, health and welfare centers, etc. Along with<br />
investment in its own operations, this is one measure of an<br />
organization’s capital contribution to the economy.<br />
2. Compilation<br />
2.1 Explain the extent of development (e.g., size, cost,<br />
duration) of significant investments and support,<br />
and the current or expected impacts (positive or<br />
negative) on communities and local economies.<br />
Indicate whether these investments and services<br />
are commercial, in-kind, or pro bono engagement.<br />
EU<br />
2.2 Report whether the organization conducted<br />
a community needs assessment to determine<br />
infrastructure and other services needed. If so,<br />
briefly explain the results of the assessment.<br />
3. Definitions<br />
Infrastructure<br />
Facilities (e.g., water supply facility, road, school, or hospital)<br />
built primarily to provide a public service or good<br />
rather than a commercial purpose, and from which the<br />
organization does not seek to gain direct economic benefit.<br />
Services supported<br />
Providing a public benefit either through direct payment<br />
of operating costs or through staffing the facility/service<br />
with the reporting organization’s own employees. Public<br />
benefit can also include public services.<br />
4. Documentation<br />
Finance, treasury, or accounting departments should<br />
have the information required by this Indicator.<br />
5. References<br />
None.<br />
16<br />
© 2000-2009 GRI
EC9 Understanding and describing<br />
significant indirect economic impacts,<br />
including the extent of impacts.<br />
1. Relevance<br />
Indirect economic impacts are an important part of<br />
an organization’s economic influence in the context of<br />
sustainable development. Whereas direct economic impacts<br />
and market influence tend to focus on the immediate<br />
consequences of monetary flows to stakeholders, indirect<br />
economic impacts include the additional impacts generated<br />
as money circulates through the economy.<br />
Direct economic impacts are often measured as the value<br />
of transactions between the reporting organization and<br />
its stakeholders, while indirect economic impacts are the<br />
results - sometimes non-monetary - of the transaction.<br />
Indirect impacts are an important aspect of an organization’s<br />
role as a participant or agent in socio-economic change,<br />
particularly in developing economies. Indirect impacts are<br />
particularly important to assess and report in relation to<br />
local communities and regional economies.<br />
For management purposes, indirect economic impacts<br />
are an important indication of where risks to reputation<br />
may develop, or where opportunities may emerge to<br />
expand market access or a social license to operate.<br />
2. Compilation<br />
2.1 Explain work undertaken to understand the<br />
indirect economic impacts the organization has at<br />
the national, regional, or local level.<br />
2.2 Report examples of indirect economic impacts,<br />
both positive and negative, such as:<br />
• Changing the productivity of organizations,<br />
sectors, or the whole economy (e.g., through<br />
greater adoption or distribution of information<br />
technology);<br />
• Economic development in areas of high<br />
poverty (e.g., number of dependents<br />
supported through income from one job);<br />
• Economic impact of improving or deteriorating<br />
social or environmental conditions (e.g.,<br />
changing job market in an area converted from<br />
small family farms to large plantations or the<br />
economic impacts of pollution);<br />
• Availability of products and services for those<br />
on low incomes (e.g., preferential pricing of<br />
Indicator Protocols Set: EC<br />
pharmaceuticals contributes to a healthier<br />
population that can participate more fully in<br />
the economy; pricing structures that exceed the<br />
economic capacity of those on low incomes);<br />
• Enhancing skills and knowledge amongst a<br />
professional community or in a geographical<br />
region (e.g., need for a supplier base creates<br />
a magnet for companies with skilled workers,<br />
which in turn engenders new learning institutes);<br />
• Jobs supported in the supply chain or distribution<br />
chain (e.g., assessing the impacts of growth or<br />
contraction of the organization on its suppliers)<br />
• Stimulating, enabling, or limiting foreign direct<br />
investment (e.g., expansion or closure of an infrastructure<br />
service in a developing country can lead<br />
to increased or reduced foreign direct investment);<br />
• Economic impact of change in location of<br />
operations or activities (e.g., outsourcing of<br />
jobs to an overseas location); and<br />
• Economic impact of the use of products and<br />
services (e.g., linkage between economic<br />
growth patterns and use of particular products<br />
and services).<br />
2.3 Report the significance of the impacts in the<br />
context of external benchmarks and stakeholder<br />
priorities, such as national and international<br />
standards, protocols, and policy agendas<br />
3. Definitions<br />
Indirect economic impact<br />
An additional consequence of the direct impact of<br />
financial transactions and the flow of money between an<br />
organization and its stakeholders.<br />
Economic impact<br />
A change in the productive potential of the economy that<br />
can have an influence on a community’s or stakeholder’s<br />
well-being and longer-term prospects for development.<br />
4. Documentation<br />
None.<br />
5. References<br />
None.<br />
IP<br />
&<br />
EUSS<br />
EU<br />
Version 3.0/EUSS Final Version<br />
17
IP<br />
&<br />
EUSS<br />
Indicator Protocols Set: EC<br />
EU10: Planned capacity against projected<br />
electricity demand over the long term,<br />
broken down by energy source and<br />
regulatory regime.<br />
1. Relevance<br />
This indicator provides information on the utility’s<br />
planned electricity capacity and its projected future<br />
energy requirements. It aims to show whether the<br />
reporting organization is planning to install enough<br />
energy capacity to meet future demand. There are<br />
utilities in certain markets which are not involved in<br />
planning and therefore are not expected to report on<br />
this indicator.<br />
This indicator is closely linked to EU6 which describes<br />
the planning processes in place to ensure availability<br />
and reliability of supply.<br />
Regulatory Regime<br />
<strong>Electric</strong> Utility <strong>Sector</strong> <strong>Supplement</strong><br />
Regulatory regime refers to local, sub-national, national<br />
or regional area where there is a common regulatory<br />
framework.<br />
Capacity<br />
Capacity is the maximum amount of power, in MW,<br />
that an entity can produce. <strong>Utilities</strong> are asked to report<br />
net capacity, i. e. maximum capacity a power station is<br />
designed to deliver to the grid. Internal use of electricity<br />
for auxiliary systems is excluded.<br />
4. Documentation<br />
None.<br />
5. References<br />
None.<br />
EU<br />
2. Compilation<br />
2.1 Calculate planned capacity in MW, including<br />
purchased power and reserve margins, for each<br />
regulatory regime broken down by both energy<br />
source and by:<br />
• Capacity under construction<br />
• P lanned<br />
future investments including<br />
commitments made by the utility<br />
EU<br />
This should factor in, for example, new<br />
energy storage. It should describe changes to net<br />
capacity.<br />
2.2 Identify uncertainties of planned capacity and/or<br />
any constraints, for example, the intermittency of<br />
wind generation. Information should be reported<br />
by regulatory regime.<br />
2.3<br />
2.4<br />
Report the comparison of planned capacity<br />
against projected demand over the same time<br />
period.<br />
Report the results of 2.1<br />
18<br />
© 2000-2009 GRI
Indicator Protocols Set: EC<br />
IP<br />
&<br />
EUSS<br />
EU11: Average generation efficiency of<br />
thermal plants by energy source and by<br />
regulatory regime.<br />
1. Relevance<br />
Improved operational efficiency contributes towards<br />
sustainable development through cost reduction and<br />
emissions reduction. It can also influence national<br />
energy security. Improvements in generation efficiency<br />
reduce the volumes of oil/gas and other fuel required<br />
for electricity and useful heat generation and reduces<br />
emissions.<br />
2. Compilation<br />
2.1 Indicate assumptions and confidence level of the<br />
figures reported for this indicator.<br />
2.2 Identify overall efficiency (electricity sent-out<br />
+ heat supplied/ energy input), in addition to<br />
electricity efficiency, if operating a combined heat<br />
and power plant.<br />
2.3 Report the average annual efficiency of the fleet by<br />
energy source and by regulatory regime. Express<br />
the net efficiency as a percentage (electricity sentout/energy<br />
input )<br />
3. Definitions<br />
Refer to G3 definition of Primary (Energy) Source.<br />
Thermal plants<br />
Thermal plants are power plants fueled by hydrocarbon<br />
energy sources.<br />
Generation efficiency<br />
Generation efficiency is the ratio of gross energy going<br />
into a plant against the net energy (electricity, and if CHP,<br />
heat) supplied.<br />
Regulatory regime<br />
Regulatory regime refers to local, sub-national, national<br />
or regional area where there is a common regulatory<br />
framework.<br />
EU<br />
EU<br />
4. Documentation<br />
Plant manuals, engineering and operational reports.<br />
5. References<br />
None.<br />
Version 3.0/EUSS Final Version<br />
19
IP<br />
&<br />
EUSS<br />
Indicator Protocols Set: EC<br />
EU12: Transmission and distribution<br />
losses as a percentage of total energy.<br />
1. Relevance<br />
Information on transmission and distribution efficiency<br />
captures information on technical and non-technical<br />
losses (including unauthorized connections). Losses<br />
can increase costs to consumers, increase emissions<br />
intensity and provide an indication that there are illegal<br />
connections. Illegal connections can be linked to public<br />
health and safety. Year-on-year reporting will enable<br />
companies and their stakeholders to see variation in<br />
losses and identify where improvements can be made.<br />
<strong>Electric</strong> Utility <strong>Sector</strong> <strong>Supplement</strong><br />
2. Compilation<br />
2.1 For distribution efficiency differentiate between<br />
technical and non-technical losses, and describe<br />
key assumptions of the estimates.<br />
2.2 Report transmission and distribution losses<br />
separately. Losses are measured as energy lost /<br />
energy entering the system over a one year period.<br />
EU<br />
3. Definitions<br />
Transmission<br />
Transmission is the process of transferring electrical<br />
power from power stations to substations.<br />
Distribution<br />
Distribution is the process of transferring electrical<br />
power from substations to customers.<br />
EU<br />
4. Documentation<br />
None.<br />
5. References<br />
None.<br />
20<br />
© 2000-2009 GRI
EU<br />
Indicator Protocols Set<br />
Environment (EN)<br />
© 2000-2011 GRI Version 3.0/EUSS Final Version
Environment<br />
Performance Indicators<br />
Indicator Protocols Set: EN<br />
IP<br />
&<br />
EUSS<br />
Aspect: Materials<br />
Aspect: Biodiversity<br />
Co r e<br />
Co r e<br />
Co r e<br />
EN1<br />
EN2<br />
Materials used by weight or volume.<br />
See<br />
<strong>Sector</strong> Specific Commentary in Protocol.<br />
Percentage of materials used that are recycled<br />
input materials.<br />
EU<br />
Co r e<br />
Co r e<br />
EN11 Location and size of land owned, leased,<br />
managed in, or adjacent to, protected areas<br />
and areas of high biodiversity value outside<br />
protected areas.<br />
EN12 Description of significant impacts of activities,<br />
products, and services on biodiversity in<br />
protected areas and areas of high biodiversity<br />
value outside protected areas.<br />
Aspect: Energy<br />
Co r e<br />
EN3<br />
Direct energy consumption by primary energy<br />
source.<br />
Co r e<br />
See<br />
<strong>Sector</strong> Specific Commentary in Protocol.<br />
EU<br />
Co r e<br />
EN4<br />
Indirect energy consumption by primary<br />
source.<br />
Co r e<br />
EU13 Biodiversity of offset habitats compared to the<br />
biodiversity of the affected areas.<br />
EU<br />
A d d<br />
EN5<br />
Energy saved due to conservation and<br />
efficiency improvements.<br />
EN13 Habitats protected or restored.<br />
A d d<br />
EN6<br />
<strong>Initiative</strong>s to provide energy-efficient<br />
or renewable energy-based products<br />
and services, and reductions in energy<br />
requirements as a result of these initiatives.<br />
A d d<br />
A d d<br />
EN14 Strategies, current actions, and future plans for<br />
managing impacts on biodiversity.<br />
EU<br />
A d d<br />
EN7<br />
<strong>Initiative</strong>s to reduce indirect energy<br />
consumption and reductions achieved.<br />
A D D<br />
See<br />
<strong>Sector</strong> Specific Commentary in Protocol.<br />
EU<br />
Aspect: Water<br />
Co r e<br />
EN8 Total water withdrawal by source.<br />
A d d<br />
EN15 Number of IUCN Red List species and national<br />
conservation list species with habitats in areas<br />
affected by operations, by level of extinction<br />
risk.<br />
Co r e<br />
A d d<br />
A d d<br />
EN9<br />
See<br />
<strong>Sector</strong> Specific Commentary in Protocol.<br />
Water sources significantly affected by<br />
withdrawal of water.<br />
EN10 Percentage and total volume of water recycled<br />
and reused.<br />
EU<br />
Aspect: Emissions, Effluents, and Waste<br />
Co r e<br />
Co r e<br />
Co r e<br />
EN16 Total direct and indirect greenhouse gas<br />
emissions by weight.<br />
See<br />
<strong>Sector</strong> Specific Commentary in Protocol.<br />
EN17 Other relevant indirect greenhouse gas<br />
emissions by weight.<br />
EU<br />
Version 3.0/EUSS Final Version<br />
1
IP<br />
&<br />
EUSS<br />
Indicator Protocols Set: EN<br />
A d d<br />
A D D<br />
Co r e<br />
Co r e<br />
EN18 <strong>Initiative</strong>s to reduce greenhouse gas emissions<br />
and reductions achieved.<br />
See<br />
<strong>Sector</strong> Specific Commentary in Protocol.<br />
EN19 Emissions of ozone-depleting substances by<br />
weight.<br />
EN20 NO x<br />
, SO x<br />
, and other significant air emissions by<br />
type and weight.<br />
EU<br />
Aspect: Products and Services<br />
Co r e<br />
Co r e<br />
EN26 <strong>Initiative</strong>s to mitigate environmental impacts<br />
of products and services, and extent of impact<br />
mitigation.<br />
EN27 Percentage of products sold and their<br />
packaging materials that are reclaimed by<br />
category.<br />
Aspect: Compliance<br />
Co r e<br />
EN28 Monetary value of significant fines and total<br />
number of non-monetary sanctions for noncompliance<br />
with environmental laws and<br />
regulations.<br />
Co r e<br />
Co r e<br />
See<br />
<strong>Sector</strong> Specific Commentary in Protocol.<br />
EN21 Total water discharge by quality and<br />
destination.<br />
EU<br />
Aspect: Transport<br />
A d d<br />
EN29 Significant environmental impacts of<br />
transporting products and other goods<br />
and materials used for the organization’s<br />
operations, and transporting members of the<br />
workforce.<br />
Co r e<br />
See<br />
<strong>Sector</strong> Specific Commentary in Protocol.<br />
EU<br />
Aspect: Overall<br />
EU<br />
Co r e<br />
EN22 Total weight of waste by type and disposal<br />
method.<br />
A d d<br />
EN30 Total environmental protection expenditures<br />
and investments by type.<br />
Co r e<br />
See<br />
<strong>Sector</strong> Specific Commentary in Protocol.<br />
EU<br />
Co r e<br />
EN23 Total number and volume of significant spills.<br />
A d d<br />
EN24 Weight of transported, imported, exported, or<br />
treated waste deemed hazardous under the<br />
terms of the Basel Convention Annex I, II, III,<br />
and VIII, and percentage of transported waste<br />
shipped internationally.<br />
A d d<br />
EN25 Identity, size, protected status, and<br />
biodiversity value of water bodies and related<br />
habitats significantly affected by the reporting<br />
organization’s discharges of water and runoff.<br />
2<br />
© 2000-2009 GRI
Relevance<br />
The Aspects in the Environment Indicator set are<br />
structured to reflect the inputs, outputs, and modes of<br />
impact an organization has on the environment. Energy,<br />
water, and materials represent three standard types of<br />
inputs used by most organizations. These inputs result<br />
in outputs of environmental significance, which are<br />
captured under the Aspects of Emissions, Effluents, and<br />
Waste. Biodiversity is also related to the concepts of<br />
inputs to the extent that it can be viewed as a natural<br />
resource. However, biodiversity is also directly impacted<br />
by outputs such as pollutants.<br />
The Aspects of Transport and Products and Services<br />
represent areas in which an organization can further<br />
impact the environment, but often through other parties<br />
such as customers or suppliers of logistics services.<br />
Compliance and Overall Aspects are specific measures<br />
the organization takes to manage environmental<br />
performance.<br />
The Aspects of Energy, Water, Emissions, and Biodiversity<br />
each contain several Indicators whose relationships are<br />
explained in more detail below:<br />
Energy Aspect<br />
The Energy Indicators cover the five most important<br />
areas of organizational energy use, which include both<br />
direct and indirect energy. Direct energy use is energy<br />
consumed by the organization and its products and<br />
services. Indirect energy use, on the other hand, is<br />
energy that is consumed by others who are serving the<br />
organization. The five different areas of energy use are to<br />
be reported as follows:<br />
• In EN3, the direct energy consumption of the reporting<br />
organization is reported, including energy produced<br />
on-site (e.g., through the burning of gas).<br />
• EN4 provides information on energy consumption<br />
required to produce energy purchased externally, such<br />
as electricity.<br />
• EN5 asks for energy saved due to conservation and<br />
efficiency improvements.<br />
• EN6 addresses the development of energy-efficient<br />
products and services.<br />
• Finally, EN7 covers the indirect energy consumption of<br />
the reporting organization’s activities.<br />
Indicator Protocols Set: EN<br />
Measurement of energy consumption is relevant to<br />
greenhouse gas emissions and climate change. The<br />
burning of fossil fuels to generate energy creates<br />
emissions of carbon dioxide (a greenhouse gas). To meet<br />
the aims formulated in the Kyoto Protocol and to reduce<br />
the risk of severe climate change, energy demand needs<br />
to be lowered. This can be achieved through more<br />
efficient energy use (measured under EN5 and EN6) and<br />
replacing fossil fuel energy sources with renewable ones<br />
(measured under EN3 and EN4). In addition to lowering<br />
the direct consumption of energy, designing energyefficient<br />
product and services (EN6) and reducing<br />
indirect energy consumption (EN7) (e.g., the selection of<br />
low energy-intensive raw materials or the use of services<br />
such as travel) are important strategies.<br />
Emissions Aspect<br />
The ‘emissions, effluents, and waste’ aspect includes<br />
Indicators that measure standard releases to the<br />
environment considered to be pollutants. These<br />
Indicators include different types of pollutants (e.g.,<br />
air emissions, effluents, solid waste) that are typically<br />
recognized in regulatory frameworks (EN20-EN23,<br />
EN24). In addition, there are Indicators for two types<br />
of emissions that are the subject of international<br />
conventions- greenhouse gases (EN16 and EN17)<br />
and ozone depleting substances (EN19). EN16 can be<br />
calculated using the data reported under EN3 and EN4.<br />
EN18 addresses the emissions reductions achieved and<br />
initiatives to reduce emissions.<br />
Definitions<br />
Direct energy<br />
Forms of energy that enter the reporting organization’s<br />
operational boundaries. It can be consumed either<br />
by the organization within its boundaries, or it can be<br />
exported to another user. Direct energy can appear<br />
in either primary (e.g., natural gas for heating) or<br />
intermediate (e.g., electricity for lighting) forms. It can<br />
be purchased, extracted (e.g., coal, natural gas, oil),<br />
harvested (e.g., biomass energy), collected (e.g., solar,<br />
wind), or brought into the reporting organization’s<br />
boundaries by other means.<br />
Greenhouse gas emissions (GHG)<br />
The six main greenhouse gas emissions are:<br />
• Carbon dioxide (CO2);<br />
• Methane (CH4);<br />
IP<br />
&<br />
EUSS<br />
EU<br />
Version 3.0/EUSS Final Version<br />
3
IP<br />
&<br />
EUSS<br />
Indicator Protocols Set: EN<br />
• Nitrous oxide (N2O);<br />
• Hydrofluorocarbons (HFCs- a group of several<br />
compounds);<br />
• Perfluorocarbons (PFCs- a group of several<br />
compounds); and<br />
• Sulphur hexafluoride (SF6).<br />
Indirect energy<br />
Energy produced outside the reporting organization’s<br />
organizational boundary that is consumed to supply<br />
energy for the organization’s intermediate energy<br />
needs (e.g., electricity or heating and cooling). The<br />
most common example is fuel consumed outside the<br />
reporting organization’s boundary in order to generate<br />
electricity to be used inside the organization’s boundary.<br />
Intermediate energy<br />
EU<br />
Forms of energy that are produced by converting<br />
primary energy into other forms. For most<br />
organizations, electricity will be the only significant<br />
form of intermediate energy. For a small percentage of<br />
organizations, other intermediate energy products might<br />
also be important, such as steam or water provided from<br />
a district heating plant or chilled water plant, or refined<br />
fuels such as synthetic fuels, biofuels, etc.<br />
Primary source<br />
The initial form of energy consumed to satisfy the<br />
reporting organization’s energy demand. This energy<br />
is used either to provide final energy services (e.g.,<br />
space heating, transport) or to produce intermediate<br />
forms of energy, such as electricity and heat. Examples<br />
of primary energy include non-renewable sources<br />
such as coal, natural gas, oil, and nuclear energy. It also<br />
includes renewable sources such as biomass, solar, wind,<br />
geothermal, and hydro energy. Primary energy might be<br />
consumed on-site (e.g., natural gas to heat the reporting<br />
organization’s buildings) or off-site (e.g., natural gas<br />
consumed by the power plants that provide electricity to<br />
the reporting organization’s facilities).<br />
Renewable energy<br />
Renewable energy is derived from natural processes that<br />
are replenished constantly. This includes electricity and<br />
heat generated from solar, wind, ocean, hydropower,<br />
biomass, geothermal resources, biofuels, and hydrogen<br />
derived from renewable resources.<br />
4<br />
© 2000-2009 GRI
EN1 Materials used by weight or volume.<br />
1. Relevance<br />
3. Definitions<br />
Direct materials<br />
Indicator Protocols Set: EN<br />
IP<br />
&<br />
EUSS<br />
This Indicator describes the reporting organization’s<br />
contribution to the conservation of the global resource<br />
base and efforts to reduce the material intensity and<br />
increase the efficiency of the economy. These are<br />
expressed goals of the OECD Council and various<br />
national sustainability strategies. For internal managers<br />
and others interested in the financial state of the<br />
organization, material consumption relates directly to<br />
overall costs of operation. Tracking this consumption<br />
internally, either by product or product category,<br />
facilitates the monitoring of material efficiency and cost<br />
of material flows.<br />
2. Compilation<br />
2.1 Identify total materials used, including materials<br />
purchased from external suppliers and those<br />
obtained from internal sources (captive production<br />
and extraction activities). This can include:<br />
Materials that are present in a final product.<br />
Non-renewable materials<br />
Resources that do not renew in short time periods, such<br />
as minerals, metals, oil, gas, coal, etc.<br />
4. Documentation<br />
Potential information sources include billing and<br />
accounting systems, and the procurement or supply<br />
management department.<br />
5. References<br />
• OECD, Recommendation of the Council on Material<br />
Flows and Resource Productivity, 2004.<br />
• Raw materials (i.e., natural resources used for<br />
conversion to products or services such as ores,<br />
minerals, wood, etc.);<br />
• Associated process materials (i.e., materials<br />
that are needed for the manufacturing process<br />
but are not part of the final product, such as<br />
lubricants for manufacturing machinery);<br />
EU<br />
• Semi-manufactured goods or parts, including<br />
all forms of materials and components other<br />
than raw materials that are part of the final<br />
product; and<br />
• Materials for packaging purposes.<br />
2.2 Identify non-renewable and direct materials used.<br />
Convert any measurements into estimated weight<br />
or volume, calculated ‘as is’ rather than by ‘dry<br />
substance/weight’.<br />
2.3 Report the total weight or volume of :<br />
• Non-renewable materials used; and<br />
• Direct materials used.<br />
• Report in-use inventory of solid and liquid<br />
high level and low level PCBs contained in<br />
equipment.<br />
EU<br />
Version 3.0/EUSS Final Version<br />
5
IP<br />
&<br />
EUSS<br />
Indicator Protocols Set: EN<br />
EN2 Percentage of materials used that<br />
are recycled input materials.<br />
1. Relevance<br />
This Indicator seeks to identify the reporting<br />
organization’s ability to use recycled input materials.<br />
Using these materials helps to reduce the demand for<br />
virgin material and contribute to the conservation of the<br />
global resource base. For internal managers and others<br />
interested in the financial condition of the reporting<br />
organization, substituting recycled materials can<br />
contribute to lowering overall costs of operation.<br />
2. Compilation<br />
2.1 Identify the total weight or volume of materials<br />
used as reported under EN1.<br />
2.2 Identify the total weight or volume of recycled<br />
input materials. If estimation is required, state the<br />
estimation methods.<br />
2.3 Report the percentage of recycled input materials<br />
used by applying the following formula:<br />
EN2= Total recycled input materials used x100<br />
Input matertials used<br />
EU<br />
3. Definitions<br />
Recycled input materials<br />
Materials that replace virgin materials that are purchased<br />
or obtained from internal or external sources, and that<br />
are not by-products and non-product outputs (NPO)<br />
produced by the reporting organization.<br />
4. Documentation<br />
Potential information sources include billing and<br />
accounting systems, the procurement or supply<br />
management department, and internal production and<br />
waste disposal records.<br />
5. References<br />
• OECD Working Group on Waste Prevention and<br />
Recycling.<br />
6<br />
© 2000-2009 GRI
EN3 Direct energy consumption by<br />
primary energy source.<br />
1. Relevance<br />
The ability of the reporting organization to use energy<br />
efficiently can be revealed by calculating the amount of<br />
energy it consumes. Energy consumption has a direct<br />
effect on operational costs and exposure to fluctuations<br />
in energy supply and prices. The environmental footprint<br />
of the organization is shaped in part by its choice of<br />
energy sources. Changes in the balance of these sources<br />
can indicate the organization’s efforts to minimize its<br />
environmental impacts.<br />
Information on the consumption of primary energy<br />
sources supports an assessment of how the organization<br />
might be affected by emerging environmental<br />
regulations such as the Kyoto Protocol. The consumption<br />
of fossil fuels is a major source of greenhouse gas<br />
emissions, and energy consumption is directly linked to<br />
the organization’s greenhouse gas emissions.<br />
Replacing fossil fuel energy sources with renewable<br />
ones is essential for combating climate change and<br />
other environmental impacts created by the extraction<br />
and processing of energy. Supporting renewable and<br />
efficient energy technology also reduces the reporting<br />
organization’s current and future dependency on nonrenewable<br />
energy sources, and its exposure to potential<br />
volatility in prices and supply.<br />
This Indicator measures the reporting organization’s<br />
consumption of direct primary energy sources. The<br />
Indicator covers scope 1 of the WRI/WBCSD GHG<br />
Protocol. Indicator EN4 measures the consumption<br />
of primary energy sources to supply the reporting<br />
organization with intermediate energy such as<br />
electricity, heating and cooling, etc.<br />
2. Compilation<br />
2.1 Direct energy sources purchased<br />
Identify primary energy sources purchased by the<br />
reporting organization for its own consumption.<br />
This includes:<br />
Indicator Protocols Set: EN<br />
• Fuel distilled from crude oil, including<br />
gasoline, diesel, liquefied petroleum gas<br />
(LPG), compressed natural gas (CNG),<br />
liquefied natural gas (LNG), butane,<br />
propane, ethane, etc.<br />
• Direct renewable energy sources including:<br />
• Biofuels;<br />
• Ethanol; and<br />
• Hydrogen.<br />
Note: Biomass is excluded from direct<br />
renewable energy sources for the purpose of<br />
reporting to the WRI/WBCSD GHG Protocol.<br />
For alignment with the WRI/WBCSD GHG<br />
Protocol, direct CO 2<br />
emissions from the<br />
combustion of biomass should be reported<br />
separately.<br />
2.2 Direct energy sources produced<br />
Identify the amount of primary energy the<br />
reporting organization acquires by producing,<br />
extracting, harvesting, collecting, or converting it<br />
from other forms of energy in joules or multiples.<br />
This can include the same energy sources listed<br />
under 2.1.<br />
2.3 Direct energy sources sold<br />
Identify the amount of primary energy exported<br />
outside the reporting boundary in joules or<br />
multiples.<br />
2.4 Calculate total energy consumption in joules or<br />
multiples such as gigajoules (one billion joules or<br />
109 joules) using the following equation:<br />
Total direct energy consumption = direct<br />
primary energy purchased + direct primary<br />
energy produced- direct primary energy sold<br />
Refer to the following table to convert volumes of<br />
primary sources to gigajoules:<br />
IP<br />
&<br />
EUSS<br />
EU<br />
• Direct non-renewable energy sources<br />
including:<br />
• Coal;<br />
• Natural gas; and<br />
Version 3.0/EUSS Final Version<br />
7
IP<br />
&<br />
EUSS<br />
Indicator Protocols Set: EN<br />
Coal GJ Crude Oil GJ Gasoline GJ Natural Gas GJ <strong>Electric</strong>ity GJ<br />
tonne (metric) 26,00 barrel 6,22 gallon 0,125 therm 0,1055 kilowatt-hour 0,0036<br />
ton (short) 23,59 tonne (metric) 44,80 tonne (metric) 44,80 1000 cubic feet 1,1046 megawatt-hour 3,6000<br />
ton (long) 26,42 ton (short) 40,64 Diesel 1000 cubic meters 39,01 gigawatt-hour 3600,0<br />
ton (long) 45,52 gallon 0,138 MMBtu 1,055<br />
tonne (metric) 43,33<br />
Fuel Oil<br />
gallon 0,144<br />
tonne (metric) 40,19<br />
2.5 Report total direct energy consumption in joules<br />
or multiples by renewable primary source.<br />
2.6 Report total direct energy consumption in joules<br />
or multiples by non-renewable primary source.<br />
3. Definitions<br />
Renewable resources<br />
EU<br />
Resources capable of being replenished within a short<br />
time through ecological cycles (as opposed to resources<br />
such as minerals, metals, oil, gas, coal that do not renew<br />
in short time periods).<br />
4. Documentation<br />
Information can be obtained from invoices, measured (or<br />
calculated) heat/fuel accounting, estimations, defaults,<br />
etc. Amounts of joules can be taken directly or converted<br />
from invoices or delivery notes. Information about<br />
the combination of primary sources used to generate<br />
intermediate energy can be obtained from suppliers.<br />
5. References<br />
• The Greenhouse Gas Protocol (GHG) <strong>Initiative</strong> -<br />
A corporate accounting and reporting standard<br />
(Revised Edition, 2004) of the World Resources<br />
Institute (WRI) and the World Business Council for<br />
Sustainable Development (WBCSD).<br />
8<br />
© 2000-2009 GRI
EN4 Indirect energy consumption by<br />
primary source.<br />
1. Relevance<br />
The amount and primary source of energy the reporting<br />
organization uses indirectly through the purchase of<br />
electricity, heat, or steam, can indicate efforts by the<br />
organization to manage environmental impacts and<br />
reduce its contribution to climate change. The particular<br />
effect indirect energy usage has on climate change<br />
depends on the type of primary energy used to generate<br />
intermediate energy.<br />
Intermediate energy refers to forms of energy that are<br />
produced by converting primary energy into other<br />
forms. For most organizations, electricity will be the<br />
only significant form of intermediate energy. For a small<br />
percentage of organizations, other intermediate energy<br />
products might also be important, such as steam or<br />
water provided from a district heating plant or chilled<br />
water plant, or refined fuels such as synthetic fuels,<br />
biofuels, etc.<br />
This Indicator measures the energy required to produce<br />
and deliver purchased electricity and any other<br />
intermediate energy products (such as district heat) that<br />
involve significant energy consumption upstream from<br />
the organization’s reporting boundary. This information<br />
also enables calculations of indirect greenhouse gas<br />
emissions. It covers Scope 2 of the WRI/WBCSD GHG<br />
Protocol.<br />
2. Compilation<br />
2.1 Identify the amount of intermediate energy<br />
purchased and consumed from sources external to<br />
the reporting organization in joules or multiples,<br />
such as gigajoules (one billion joules, or 10 9 joules).<br />
This includes:<br />
Intermediate energy purchased and consumed<br />
from non-renewable energy sources as listed<br />
under EN3, including:<br />
• <strong>Electric</strong>ity;<br />
• Heating and Cooling;<br />
• Steam;<br />
• Nuclear energy; and<br />
Indicator Protocols Set: EN<br />
Intermediate energy purchased and consumed<br />
from renewable energy sources including:<br />
• Solar;<br />
• Wind;<br />
• Geothermal;<br />
• Hydro energy;<br />
• Biomass based intermediate energy; and<br />
• Hydrogen based intermediate energy.<br />
2.2 Identify the amount of primary fuels consumed<br />
to produce intermediate energy based on the<br />
total amount of energy purchased from external<br />
suppliers (EN3- Energy Purchased). To estimate the<br />
fuels consumed to produce purchased energy, use<br />
either:<br />
• Fuel consumption data acquired from the<br />
electricity provider if these data are available;<br />
• Default data for electricity and heat; or<br />
• Estimations where default figures are not<br />
available.<br />
2.3 Using data from 2.1, report:<br />
• The total amount of indirect energy used by<br />
indirect non-renewable sources and indirect<br />
renewable sources in terms of intermediate<br />
energy; and<br />
• The corresponding primary energy consumed<br />
in its production.<br />
3. Definitions<br />
None.<br />
Note: The sum of primary energy sources<br />
(expressed in joules) used to generate<br />
intermediate energy will, depending on the<br />
primary source used, significantly exceed the<br />
amount of intermediate energy purchased (in<br />
joules) due to grid and efficiency losses when<br />
converting and transporting energy.<br />
IP<br />
&<br />
EUSS<br />
EU<br />
• Other forms of imported energy.<br />
Version 3.0/EUSS Final Version<br />
9
IP<br />
&<br />
EUSS<br />
Indicator Protocols Set: EN<br />
4. Documentation<br />
Suppliers of energy and related services are the most<br />
important informational source for this Indicator. Other<br />
information can be obtained from invoices, measured (or<br />
calculated) heat/fuel accounting, estimations, defaults,<br />
etc. Besides default data drawn from the International<br />
Energy Agency (IEA), information can be obtained from<br />
the annual reports submitted by governments to the<br />
United Nations Framework Convention on Climate<br />
Change (UNFCC). These reports will detail country<br />
energy use and associated emissions for country specific<br />
defaults, etc.<br />
5. References<br />
• International Energy Agency’s (IAE) annual<br />
publication of Energy Balances for OECD and non-<br />
OECD countries.<br />
• The Greenhouse Gas Protocol (GHG) <strong>Initiative</strong> -<br />
A corporate accounting and reporting standard<br />
(Revised Edition, 2004) of the World Resources<br />
Institute (WRI) and the World Business Council for<br />
Sustainable Development (WBCSD).<br />
• Kyoto Protocol, 1997.<br />
EU<br />
10<br />
© 2000-2009 GRI
EN5 Energy saved due to conservation<br />
and efficiency improvements.<br />
1. Relevance<br />
This Indicator demonstrates the results of proactive<br />
efforts to improve energy-efficiency through<br />
technological improvements of processes and other<br />
energy conservation initiatives. Improved energy<br />
efficiency can result in cost savings and can lead to<br />
competitive advantages and market differentiation.<br />
Supporting efficient energy technology has a direct<br />
impact on operational costs, and reduces the reporting<br />
organization’s future dependency on non-renewable<br />
energy sources. Efficient energy use is one key strategy<br />
in combating climate change and other environmental<br />
impacts created by the extraction and processing of<br />
energy.<br />
2. Compilation<br />
2.1 Identify total energy saved by efforts to reduce<br />
energy use and increase energy efficiency.<br />
Reduced energy consumption from reduced<br />
production capacity or outsourcing should not be<br />
included in this Indicator.<br />
4. Documentation<br />
Indicator Protocols Set: EN<br />
Information can be obtained from internal energy<br />
measurements and supplier information (e.g., energy<br />
related specification of new machinery, light bulbs, etc.).<br />
5. References<br />
None.<br />
IP<br />
&<br />
EUSS<br />
2.2 Report the total amount of energy saved in joules<br />
or multiples, such as gigajoules (one billion joules<br />
or 10 9 joules). Take into consideration energy saved<br />
due to:<br />
EU<br />
• Process redesign;<br />
• Conversion and retrofitting of equipment; and<br />
• Changes in personnel behavior.<br />
3. Definitions<br />
Energy saved<br />
The reduced amount of energy needed to carry out<br />
the same processes or tasks. The term does not include<br />
overall reduction in energy consumption from reduced<br />
organizational activities (e.g., partial outsourcing of<br />
production).<br />
Conservation and efficiency improvements<br />
Organizational or technological innovations that allow<br />
a defined process or task to be carried out at a reduced<br />
level of energy consumption. This includes process<br />
redesign, the conversion and retrofitting of equipment<br />
(e.g., energy-efficient lighting), or the elimination of<br />
unnecessary energy use due to changes in behavior.<br />
Version 3.0/EUSS Final Version<br />
11
IP<br />
&<br />
EUSS<br />
EU<br />
Indicator Protocols Set: EN<br />
EN6 <strong>Initiative</strong>s to provide energyefficient<br />
or renewable energy based<br />
products and services, and reductions in<br />
energy requirements as a result of these<br />
initiatives.<br />
1. Relevance<br />
Energy consumption is a major contributor to climate<br />
change since the burning of fossil fuel energy sources<br />
ultimately generates carbon dioxide (a greenhouse gas).<br />
Using energy more efficiently is essential to combating<br />
climate change, which is the aim of the Kyoto Protocol.<br />
Providing energy efficient products and services is an<br />
important part of product stewardship initiatives. These<br />
products and services can be a source of competitive<br />
advantage by enhancing product differentiation and<br />
reputation. Energy-efficient technologies can also<br />
reduce the cost of consumer goods. When initiatives of<br />
different organizations in the same sector are compared,<br />
it can give an indication of likely trends in the market for<br />
a product or service.<br />
2. Compilation<br />
2.1 Report existing initiatives to reduce the energy<br />
requirements of major products/product groups or<br />
services.<br />
5. References<br />
• Energy efficiency standards and relevant testing<br />
procedures are available from the International<br />
Organization for Standardization (ISO).<br />
• Energy efficiency standards and relevant testing<br />
procedures are available from the International<br />
Electrotechnical Commission (IEC).<br />
2.2 Report quantified reductions in the energy<br />
requirements of products and services achieved<br />
during the reporting period.<br />
2.3 If use-oriented figures are employed (e.g., energy<br />
requirements of a computer), clearly report any<br />
assumptions about underlying consumption<br />
patterns or normalization factors (e.g., 10% less<br />
energy use per average working day, assuming<br />
operation for 8 hours with changing processor<br />
load). Refer to available industry standards (e.g.,<br />
fuel consumption of cars for 100 km at 90 km/h).<br />
3. Definitions<br />
None.<br />
4. Documentation<br />
Information can be obtained from internal product<br />
testing/measurements, research concerning usage<br />
patterns, industry standards, etc.<br />
12<br />
© 2000-2009 GRI
<strong>Electric</strong> Utility <strong>Sector</strong> <strong>Supplement</strong><br />
EN7 <strong>Initiative</strong>s to reduce indirect energy<br />
consumption and reductions achieved.<br />
1. Relevance<br />
Indirect energy use occurs through purchasing<br />
materials and components or services such as travel,<br />
commuting, and subcontracted production. When<br />
monitored comprehensively, indirect energy use can be<br />
reduced effectively (e.g., by carefully selecting energyefficient<br />
materials, services, or production capacities, or<br />
substituting phone or video conferences for travel).<br />
Quantifying indirect energy use provides a basis for<br />
calculating ‘other relevant indirect greenhouse gas<br />
emissions’ as requested in EN19. Tracking and reducing<br />
indirect energy use can improve the overall life-cycle<br />
performance of products and services, and serve as part<br />
of a comprehensive design-for-environment program.<br />
3. Definitions<br />
None.<br />
4. Documentation<br />
Indicator Protocols Set: EN<br />
Relevant data can be drawn from supplier information,<br />
life-cycle calculations/estimations (carried out internally<br />
or by research organizations), etc.<br />
5. References<br />
• International Energy Agency’s (IAE) annual<br />
publication of Energy Balances for OECD and non-<br />
OECD countries.<br />
IP<br />
&<br />
EUSS<br />
Finally, this Indicator covers energy savings achieved<br />
in the indirect energy consumption of the reporting<br />
organization’s activities.<br />
2. Compilation<br />
2.1 For this Indicator, exclude indirect energy use<br />
associated with the purchase of intermediate<br />
energy sources as reported in EN4.<br />
2.2 Identify relevant upstream/downstream indirect<br />
energy use in the following four areas:<br />
EU<br />
• Use of energy-intensive materials;<br />
• Subcontracted production;<br />
• Business-related travel; and<br />
• Employee commuting.<br />
2.3 Report initiatives to reduce indirect energy use.<br />
2.4 Report quantitatively the extent to which indirect<br />
energy use has been reduced during the reporting<br />
period for the four areas listed in 2.2.<br />
2.5 Indicate underlying assumptions and<br />
methodologies used to calculate other indirect<br />
energy use and indicate the source of information.<br />
Version 3.0/EUSS Final Version<br />
13
IP<br />
&<br />
EUSS<br />
EU<br />
Indicator Protocols Set: EN<br />
EN8 Total water withdrawal by source.<br />
1. Relevance<br />
<strong>Reporting</strong> the total volume of water withdrawn by<br />
source contributes to an understanding of the overall<br />
scale of potential impacts and risks associated with the<br />
reporting organization’s water use. The total volume<br />
withdrawn provides an indication of the organization’s<br />
relative size and importance as a user of water, and<br />
provides a baseline figure for other calculations relating<br />
to efficiency and use.<br />
The systematic effort to monitor and improve the<br />
efficient use of water in the reporting organization<br />
is directly linked to water consumption costs. Total<br />
water use can also indicate the level of risk posed by<br />
disruptions to water supplies or increases in the cost<br />
of water. Clean freshwater is becoming increasingly<br />
scarce, and can impact production processes that rely<br />
on large volumes of water. In regions where water<br />
sources are highly restricted, the organization’s water<br />
consumption patterns can also influence relations with<br />
other stakeholders.<br />
2. Compilation<br />
2.1 Identify the total volume of water withdrawn<br />
from any water source that was either withdrawn<br />
directly by the reporting organization or through<br />
intermediaries such as water utilities. This includes<br />
the abstraction of cooling water.<br />
3. Definitions<br />
Total water withdrawal<br />
The sum of all water drawn into the boundaries of<br />
the reporting organization from all sources (including<br />
surface water, ground water, rainwater, and municipal<br />
water supply) for any use over the course of the<br />
reporting period.<br />
4. Documentation<br />
Information on organizational water withdrawal can<br />
be drawn from water meters, water bills, calculations<br />
derived from other available water data or (if neither<br />
water meters nor bills or reference data exist) the<br />
organization’s own estimates.<br />
5. References<br />
None.<br />
2.2 Report overall water usage for processing, cooling<br />
and consumption in thermal and nuclear power<br />
plants, including use of water in ash handling and<br />
coal cleaning.<br />
EU<br />
2.3 Report the total volume of water withdrawn in<br />
cubic meters per year (m 3 /year) by the following<br />
sources:<br />
• Surface water, including water from wetlands,<br />
rivers, lakes, and oceans;<br />
• Ground water;<br />
• Rainwater collected directly and stored by the<br />
reporting organization;<br />
• Waste water from another organization; and<br />
• Municipal water supplies or other water<br />
utilities.<br />
14<br />
© 2000-2009 GRI
EN9 Water sources significantly affected<br />
by withdrawal of water.<br />
1. Relevance<br />
Withdrawals from a water system can affect the<br />
environment by lowering the water table, reducing<br />
volume of water available for use, or otherwise altering<br />
the ability of an ecosystem to perform its functions. Such<br />
changes have wider impacts on the quality of life in the<br />
area, including economic consequences.<br />
This Indicator measures the scale of impacts associated<br />
with the organization’s water use. In terms of relations<br />
with other users of the same water sources, this<br />
Indicator also enables an assessment of specific areas<br />
of risk or improvement, as well as the stability of the<br />
organization’s own water sources.<br />
2. Compilation<br />
2.1 Identify water sources significantly affected by<br />
water withdrawal by the reporting organization.<br />
Significant withdrawals meet one or more of the<br />
following criteria:<br />
• Withdrawals that account for an average of<br />
5 percent or more of the annual average<br />
volume of a given water body;<br />
• Withdrawals from water bodies that are<br />
recognized by professionals to be particularly<br />
sensitive due to their relative size, function,<br />
or status as a rare, threatened, or endangered<br />
system (or to their support of a particular<br />
endangered species of plant or animal); or<br />
Indicator Protocols Set: EN<br />
2.2 Report the total number of significantly affected<br />
water sources by type according to the criteria<br />
above, indicating the following:<br />
• Size of water source in cubic meters (m 3 );<br />
• Whether or not the source is designated<br />
as a protected area (nationally and/or<br />
internationally); and<br />
• Biodiversity value (e.g., species diversity and<br />
endemism, number of protected species).<br />
3. Definitions<br />
None.<br />
4. Documentation<br />
Information on the characteristics of a water source or<br />
protected area can be obtained from local or national<br />
water-related ministries or government departments, or<br />
research such as environmental impact assessments.<br />
5. References<br />
• IUCN Red List of Threatened Species.<br />
• Ramsar Convention on Wetlands, 1971.<br />
IP<br />
&<br />
EUSS<br />
EU<br />
• Any withdrawal from a Ramsar-listed wetland<br />
or any other nationally or internationally<br />
proclaimed conservation area regardless of the<br />
rate of withdrawal.<br />
Note: If the water is provided by a public or<br />
private water supplier, the original water body/<br />
source should be identified and reported.<br />
Version 3.0/EUSS Final Version<br />
15
IP<br />
&<br />
EUSS<br />
Indicator Protocols Set: EN<br />
EN10 Percentage and total volume of<br />
water recycled and reused.<br />
1. Relevance<br />
The rate of water reuse and recycling can be a measure<br />
of efficiency and can demonstrate the success of the<br />
organization in reducing total water withdrawals and<br />
discharges. Increased reuse and recycling can result<br />
in a reduction of water consumption, treatment, and<br />
disposal costs. The reduction of water consumption<br />
through reuse and recycling can also contribute to local,<br />
national, or regional goals for managing water supplies.<br />
2. Compilation<br />
2.1 This Indicator measures both water that was<br />
treated prior to reuse and water that was not<br />
treated prior to reuse. Grey water (i.e., collected<br />
rainwater and wastewater generated by household<br />
processes such as washing dishes, laundry, and<br />
bathing) is included.<br />
4. Documentation<br />
Information can be obtained from water meters,<br />
water bills, or (if neither water meters nor bills exist)<br />
calculations based on a water audit or inventory, or from<br />
water retailer.<br />
5. References<br />
None.<br />
EU<br />
2.2 Calculate the volume of recycled/reused water<br />
based on the volume of water demand satisfied<br />
by recycled/reused water rather than further<br />
withdrawals. For example, if the organization has a<br />
production cycle that requires 20 cubic meters of<br />
water per cycle, the organization withdraws<br />
20 cubic meters of water for one production<br />
process cycle and then reuses it for an additional<br />
three cycles. The total volume of water recycled/<br />
reused for that process is 60 cubic meters.<br />
2.3 Report the total volume of water recycled/reused<br />
by the organization in cubic meters per year (m 3 /<br />
year) and also as a percentage of the total water<br />
withdrawal reported under Indicator EN8.<br />
3. Definitions<br />
Recycling/Reuse<br />
The act of processing used water/wastewater through<br />
another cycle before discharge to final treatment and/or<br />
discharge to the environment. In general, there are three<br />
types of water recycling/re-use:<br />
• Wastewater recycled back in the same process or<br />
higher use of recycled water in the process cycle;<br />
• Wastewater recycled/re-used in a different process,<br />
but within the same facility; and<br />
• Wastewater re-used at another of the reporting<br />
organization’s facilities.<br />
16<br />
© 2000-2009 GRI
EN11 Location and size of land owned,<br />
leased, managed in, or adjacent to,<br />
protected areas and areas of high biodiversity<br />
value outside protected areas.<br />
1. Relevance<br />
By reporting on the potential impact on land that lies within,<br />
contains, or is adjacent to legally protected areas, as well<br />
as areas of high biodiversity value outside protected areas,<br />
an organization can identify and understand certain risks<br />
associated with biodiversity. Monitoring which activities<br />
are taking place in both protected areas and areas of high<br />
biodiversity value outside protected areas makes it possible<br />
for the reporting organization to reduce the risks of impacts.<br />
It also makes it possible for the organization to manage<br />
impacts on biodiversity or avoid mismanagement. Failure to<br />
adequately manage such impacts may result in reputational<br />
damage, delays in obtaining planning permission, and the<br />
loss of a social license to operate.<br />
2. Compilation<br />
2.1 Identify operational sites owned, leased, managed<br />
in, located in, adjacent to, or that contain protected<br />
areas and areas of high biodiversity value outside<br />
protected areas. Include sites for which future<br />
operations have been formally announced.<br />
2.2 Report the following information for each<br />
operational site identified above:<br />
• Geographic location;<br />
• Subsurface and/or underground land that may be<br />
owned, leased, or managed by the organization;<br />
• Position in relation to protected area (in the<br />
area, adjacent to, or containing portions of the<br />
protected area) and high biodiversity value<br />
area outside protected area;<br />
• Type of operation (office, manufacturing/<br />
production, or extractive);<br />
• Size of operational site in km 2 ;<br />
• Biodiversity value characterized by:<br />
- The attribute of the protected area and high<br />
biodiversity value area outside protected<br />
area (terrestrial, freshwater, or maritime<br />
ecosystem); and<br />
- Listing of protected status (e.g., IUCN<br />
Protected Area Management Category,<br />
Ramsar Convention, national legislation,<br />
Natura 2000 site, etc.).<br />
3. Definitions<br />
Protected area<br />
Indicator Protocols Set: EN<br />
A geographically defined area that is designated, regulated,<br />
or managed to achieve specific conservation objectives.<br />
Areas of high biodiversity value<br />
Areas not subject to legal protection but recognized<br />
for important biodiversity features by a number of<br />
governmental and non-governmental organizations. These<br />
include habitats that are a priority for conservation (often<br />
defined in National Biodiversity Strategies and Action Plans<br />
prepared under the Convention on Biological Diversity). In<br />
addition, several international conservation organizations<br />
have identified particular areas of high biodiversity value.<br />
4. Documentation<br />
Sources of information for the required data could<br />
include purchase contracts, lease contracts, or the<br />
national/regional land registry.<br />
On the national level, public agencies responsible for<br />
environmental protection and conservation might keep<br />
information on internationally and nationally protected<br />
areas and areas of high biodiversity value. In addition,<br />
National Biodiversity Strategies and Action Plans often<br />
include information and registers of protected areas and<br />
areas of high biodiversity value.<br />
5. References<br />
• Ramsar Convention on Wetlands, 1971.<br />
• UNESCO World Heritage Sites.<br />
• United Nations Biosphere Reserves.<br />
• National Biodiversity Strategies and Action Plans<br />
prepared under the Convention on Biological<br />
Diversity.<br />
• Conservation International’s Biodiversity Hotspots<br />
and Wilderness Areas.<br />
• WWF’s <strong>Global</strong> 200 Ecoregion.<br />
• Bird Life International’s Important Bird Areas.<br />
• IUCN’s Centres of Plant Diversity.<br />
IP<br />
&<br />
EUSS<br />
EU<br />
Version 3.0/EUSS Final Version<br />
17
IP<br />
&<br />
EUSS<br />
Indicator Protocols Set: EN<br />
<strong>Electric</strong> Utility <strong>Sector</strong> <strong>Supplement</strong><br />
EU<br />
EN12 Description of significant impacts<br />
of activities, products, and services<br />
on biodiversity in protected areas and<br />
areas of high biodiversity value outside<br />
protected areas.<br />
1. Relevance<br />
This Indicator provides information on the significant<br />
direct and indirect impacts of the reporting organization<br />
on biodiversity in protected areas and areas of high<br />
biodiversity value outside protected areas. It also<br />
provides the background for understanding (and<br />
developing) an organizational strategy to mitigate<br />
these impacts. By asking for structured, qualitative<br />
information, the Indicator enables comparison across<br />
organizations and over time of the relative size, scale,<br />
and nature of impacts.<br />
2. Compilation<br />
2.1 Identify significant impacts on biodiversity<br />
associated with activities, products, and services of<br />
the reporting organization, including both direct<br />
impacts as well as indirect impacts (e.g., in the<br />
supply chain).<br />
2.2 Report the nature of significant direct and indirect<br />
impacts on biodiversity with reference to one or<br />
more of the following:<br />
• Construction or use of manufacturing plants,<br />
mines, and transport infrastructure;<br />
• Pollution (introduction of substances that do<br />
not naturally occur in the habitat from point<br />
and non-point sources);<br />
• Introduction of invasive species, pests, and<br />
pathogens;<br />
• Reduction of species;<br />
• Habitat conversion;<br />
• Changes in ecological processes outside the<br />
natural range of variation (e.g., salinity or<br />
changes in groundwater level).<br />
• Maintenance of transmission line corridors;<br />
• Fragmentation and isolation (islandization);<br />
and<br />
• Impacts of thermal discharge.<br />
EU<br />
2.3 Report significant direct and indirect positive and<br />
negative impacts with reference to the following:<br />
• Species affected;<br />
• Extent of areas impacted (this may not be<br />
limited to areas that are formally protected<br />
and should include consideration of impacts<br />
on buffer zones as well as formally designated<br />
areas of special importance or sensitivity);<br />
• Duration of impacts; and<br />
• Reversibility or irreversibility of the impacts.<br />
3. Definitions<br />
Significant impact<br />
Impacts that may adversely affect the integrity of a<br />
geographical area/region, either directly or indirectly.<br />
This occurs by substantially changing its ecological<br />
features, structures, and functions across its whole area<br />
and over the long term. This means that the habitat, its<br />
population level, and/or the particular species that make<br />
that habitat important cannot be sustained.<br />
On a species level, a significant impact causes a<br />
population decline and/or change in distribution so that<br />
natural recruitment (reproduction or immigration from<br />
unaffected areas) cannot return to former levels within a<br />
limited number of generations. A significant impact can<br />
also affect subsistence or commercial resource use to the<br />
degree that the well-being of users is affected over the<br />
long term.<br />
Thermal Discharges<br />
Waste heat from power plant operations released into<br />
the environment. This usually refers to water that is<br />
pumped from a nearby body for use as condenser<br />
cooling water, where it picks up heat and then is<br />
discharged back into the water body. The heated water<br />
thus adds thermal energy to the water body, which may<br />
have an effect on the local ecosystems.<br />
4. Documentation<br />
Information for this Indicator can be found in the<br />
reporting organization’s environmental management<br />
system or other internal documentation. If available,<br />
information can also be obtained from environmental<br />
and social impact assessments and/or lifecycle<br />
assessments, and from other organizations upstream/<br />
downstream in the supply chain.<br />
EU<br />
5. References<br />
• GRI Cross-Reference: GRI Biodiversity Resource<br />
Document.<br />
18<br />
© 2000-2009 GRI
EN13 Habitats protected or restored.<br />
1. Relevance<br />
A biodiversity strategy contains a combination of<br />
elements related to the prevention, management, and<br />
remediation of damage to natural habitats resulting<br />
from the organization’s activities. This Indicator measures<br />
the implementation of a specific strategy for preventing<br />
or redressing negative impacts associated with activities.<br />
Ensuring the integrity of natural habitats can enhance<br />
the reputation of the organization, the stability of its<br />
surrounding natural environment and resources, and its<br />
acceptance by surrounding communities.<br />
2. Compilation<br />
2.1 This Indicator refers to areas in which remediation<br />
has been completed or the area is actively<br />
protected (see Definitions). Areas in which<br />
operations are still active can be counted if<br />
they conform to the definitions of ’restored’ or<br />
’protected’.<br />
4. Documentation<br />
Indicator Protocols Set: EN<br />
Information on protected areas can be found in the<br />
documentation of the organization’s environmental<br />
management system, site plans, environmental and<br />
social impact assessments, or organizational policies.<br />
Information on land restoration (i.e., requirements for<br />
land restoration) can be found in lease, rent, or purchase<br />
contracts of the land, or in environmental and social<br />
impact assessments or risk registers.<br />
5. References<br />
None.<br />
IP<br />
&<br />
EUSS<br />
2.2 Assess the status of the area based on its condition<br />
at the close of the reporting period.<br />
2.3 Report the size and location of all habitat<br />
protected areas and/or restored areas (in hectares),<br />
and whether the success of the restoration<br />
measure was/is approved by independent external<br />
professionals. If the area is larger than one km 2 ,<br />
report in km 2 .<br />
EU<br />
2.4 Report whether partnerships exist with third<br />
parties to protect or restore habitat areas distinct<br />
from where the organization has overseen and<br />
implemented restoration or protection measures.<br />
3. Definitions<br />
Area restored<br />
Areas that were used during or affected by operational<br />
activities, and where remediation measures have either<br />
restored the environment to its original state or to a<br />
state where it is a healthy and functioning ecosystem.<br />
Area protected<br />
Areas that are protected from any harm during<br />
operational activities, and the environment remains in its<br />
original state with a healthy functioning ecosystem.<br />
Version 3.0/EUSS Final Version<br />
19
IP<br />
&<br />
EUSS<br />
Indicator Protocols Set: EN<br />
EU13:<br />
compared to the biodiversity of the<br />
3. D<br />
Offset Habitat<br />
<strong>Electric</strong> Utility <strong>Sector</strong> <strong>Supplement</strong><br />
1. Relevance<br />
The presence of electricity utility infrastructure can<br />
result in impacts on biodiversity which may not be<br />
readily mitigated. Wildlife habitats can be adversely<br />
wind farms, transmission lines, dams) are installed.<br />
habitats. This indicator describes the extent to which the<br />
standards are currently being developed. This indicator is<br />
particularly relevant to organizations that have activities<br />
in sensitive natural habitats. Additional measures related<br />
to biodiversity conservation are captured in G3, EN11<br />
-15.<br />
replace land or a water body where biodiversity has been<br />
adversely affected by the presence of utility activities.<br />
4. Documentation<br />
Environmental management plans in Environmental<br />
Impact Assessment relating to construction and<br />
operation of plant, Voluntary action plans related to<br />
biodiversity conservation, and Regulatory guidelines.<br />
5. References<br />
• EN 11, EN12, EN15<br />
• IUCN Red List of Threatened Species<br />
2. Compilation<br />
EU<br />
2.1.<br />
• Area (km 2 ) of habitats;<br />
• Major species conserved / protected; and<br />
• Habitat description (e.g. wetland, grassland,<br />
forest, etc).<br />
2.2. Compare biodiversity of original habitat before<br />
company activities take place, with the biodiversity<br />
2.3.<br />
EN12.<br />
EU<br />
work being done to improve the biodiversity of the<br />
2.4<br />
Report the period for monitoring and reporting<br />
2.5<br />
Report the results of 2.2<br />
20<br />
© 2000-2009 GRI
EN14 Strategies, current actions, and<br />
future plans for managing impacts on<br />
biodiversity.<br />
1. Relevance<br />
Performance against biodiversity policies, objectives,<br />
and commitments depends on having structured<br />
programs in place for managing impacts. The presence<br />
and structure of programs is particularly important<br />
when national regulations do not provide clear reference<br />
points for an organization planning its biodiversity<br />
management.<br />
This Indicator enables both internal and external<br />
stakeholders to analyze how well the reporting<br />
organization’s strategies, current actions, and future<br />
plans address potential impacts on biodiversity. The<br />
quality of the organization’s approach to managing<br />
impacts on biodiversity (as identified in EN11 and EN12)<br />
will affect its exposure to risks such as reputational<br />
damage, fines, or rejection of planning or operating<br />
permissions. Actions to protect or restore habitats and<br />
species are of particular relevance.<br />
2. Compilation<br />
2.1 If national regulations have influenced the specific<br />
strategies, actions, or plans reported under this<br />
Indicator, this should be noted.<br />
2.2 Report the organization’s strategy for achieving its<br />
policy on biodiversity management including:<br />
• Integration of biodiversity considerations in<br />
analytical tools such as environmental site<br />
impact assessments;<br />
Indicator Protocols Set: EN<br />
2.4 Report the approaches to assess impacts<br />
(including fragmentation and isolation), develop<br />
mitigation measures and monitor residual effects<br />
at new and existing sites on the following:<br />
• Forested areas (e.g., alterations to tree crown<br />
density,loss of indigenous species);<br />
• Landscape (e.g., impacts of wind farms,<br />
transmission lines); and<br />
• Marine, freshwater and wetland ecosystems<br />
(e.g., downstream water quality including<br />
turbidity, sedimentation, siltation and water<br />
quality of reservoir and other water bodies).<br />
Assessment and mitigation should consider<br />
conservation plans for indigenous species,<br />
alterations in the migration, breeding, or habitat<br />
of animals (e.g., fish passage) from the reporting<br />
organization’s infrastructure (e.g., power lines and<br />
dams).<br />
3. Definitions<br />
None.<br />
4. Documentation<br />
Information on programs and targets can be found<br />
in management guidelines or obtained from the<br />
organization’s Environmental Management System,<br />
Environmental and Social Impact Assessments,<br />
Corporate Social Responsibility policies, or Risk Registers.<br />
5. References<br />
None.<br />
EU<br />
IP<br />
&<br />
EUSS<br />
EU<br />
• Methodology for establishing risk exposure to<br />
biodiversity;<br />
• Setting specific targets and objectives;<br />
• Monitoring processes; and<br />
• Public reporting.<br />
2.3 Report actions underway to manage biodiversity<br />
risks identified in EN11 and EN12, or plans to<br />
undertake such activities in the future.<br />
Version 3.0/EUSS Final Version<br />
21
IP<br />
&<br />
EUSS<br />
Indicator Protocols Set: EN<br />
EN15 Number of IUCN Red List species<br />
and national conservation list species<br />
with habitats in areas affected by<br />
operations, by level of extinction risk.<br />
1. Relevance<br />
This Indicator helps the reporting organization to<br />
identify where its activities can pose a threat to<br />
endangered plant and animal species. By identifying<br />
these threats, the organization can initiate appropriate<br />
steps to avoid harm and to prevent the extinction of<br />
species. The IUCN Red List and national conservation<br />
list species can serve as authorities on the sensitivity<br />
of habitat in areas affected by operations, and on<br />
the relative importance of these habitats from a<br />
management perspective.<br />
2. Compilation<br />
2.1 Identify the location of habitats affected by the<br />
operations of the reporting organization that<br />
include species on the IUCN Red List and on<br />
national conservation lists.<br />
4. Documentation<br />
Information on the presence of species on the IUCN<br />
Red List and national conservation lists can be obtained<br />
from national/regional conservation agencies, local<br />
authorities, or environmental NGOs. For organizations<br />
operating in or adjacent to protected areas or areas<br />
of high-biodiversity value, planning studies or other<br />
permit materials may also contain information about the<br />
biodiversity within the protected areas.<br />
5. References<br />
• IUCN Red List of Threatened Species.<br />
EU<br />
2.2 Report the number of species in habitats identified<br />
as affected by the reporting organization,<br />
indicating one of the following levels of extinction<br />
risk:<br />
• Critically endangered;<br />
• Endangered;<br />
• Vulnerable;<br />
• Near threatened; and<br />
• Least concern.<br />
3. Definitions<br />
IUCN Red List species<br />
An inventory of the global conservation status of plant<br />
and animal species developed by the International<br />
Union for the Conservation of Nature and Natural<br />
Resources (IUCN).<br />
22<br />
© 2000-2009 GRI
<strong>Electric</strong> Utility <strong>Sector</strong> <strong>Supplement</strong><br />
EN16 Total direct and indirect greenhouse<br />
gas emissions by weight.<br />
1. Relevance<br />
Greenhouse gas emissions are the main cause of climate<br />
change and are governed by the United Nations Framework<br />
Convention on Climate Change (UNFCC) and the<br />
subsequent Kyoto Protocol. As a result, different national<br />
and international regulations and incentive systems (such<br />
as trading climate certificates) aim to control the volume<br />
and reward the reduction of greenhouse gas emissions.<br />
This Indicator can be used in combination with EN17<br />
to explain targets for regulations or trading systems<br />
at international or national levels. The combination of<br />
direct and indirect emissions also provides insights into<br />
the potential cost implications of taxation or trading<br />
systems for reporting organizations.<br />
2. Compilation<br />
2.1 Different conversion methodologies are available<br />
to calculate the amount of greenhouse gas<br />
emissions per source. Indicate the standard used,<br />
and indicate the methodology associated with the<br />
data with reference to the following categories:<br />
• Direct measurement (e.g., continuous online<br />
analyzers, etc.);<br />
Indicator Protocols Set: EN<br />
• Transportation of materials, products, and waste;<br />
• Venting; and<br />
• Fugitive emissions.<br />
Emissions from combustion processes and sources<br />
will correspond to the direct primary energy from<br />
non-renewable and renewable sources as reported<br />
in EN3. Note that the direct CO 2<br />
emissions from the<br />
combustion of biomass shall not be included but<br />
reported separately under GHG Protocol Corporate<br />
Standard (revised edition).<br />
2.3 Identify indirect emissions of greenhouse gases<br />
resulting from the generation of purchased<br />
electricity, heat, or steam (this corresponds with<br />
energy consumption reported under EN4).<br />
Other indirect emissions (e.g., from organizational<br />
travel) are not included since they are accounted<br />
for in EN17.<br />
2.4 Report total greenhouse gas emissions as the sum<br />
of direct and indirect emissions (as identified in 2.2<br />
and 2.3) in tonnes of CO 2<br />
equivalent.<br />
2.5 Report CO 2<br />
e per MWh, broken down by regulatory<br />
regime, for:<br />
IP<br />
&<br />
EUSS<br />
EU<br />
• Calculation based on site specific data (e.g., for<br />
fuel composition analysis, etc.);<br />
• Calculation based on default data; and<br />
• Estimations. If estimations are used due to a<br />
lack of default figures, indicate which basis<br />
figures were obtained.<br />
Further details on the compilation of this Indicator are<br />
available in the WRI /WBCSD GHG Protocol and in the<br />
IPCC document as listed under references.<br />
2.2 Identify direct emissions of greenhouse gases from<br />
all sources owned or controlled by the reporting<br />
organization, including:<br />
• Generation of electricity, heat, or steam (as<br />
reported in EN3);<br />
• Other combustion processes such as flaring;<br />
• Physical or chemical processing;<br />
• Net generation from all generating capacity;<br />
• Net generation from all fossil fuel generation;<br />
and<br />
• Estimated net delivery to end users. This<br />
includes emissions from own generation, as<br />
well as purchased power.<br />
Explanation:<br />
The first bullet refers to the emissions intensity for all<br />
generating capacity, and the second bullet refers to that<br />
of the fossil generation capacity.<br />
A breakdown by regulatory regime is necessary because<br />
of the different CO 2<br />
e allocation schemes in place.<br />
3. Definitions<br />
Direct emissions<br />
Emissions from sources that are owned or controlled<br />
by the reporting organization. For example, direct<br />
emissions related to combustion would arise<br />
from burning fuel for energy within the reporting<br />
organization’s operational boundaries.<br />
EU<br />
Version 3.0/EUSS Final Version<br />
23
IP<br />
&<br />
EUSS<br />
Indicator Protocols Set: EN<br />
Indirect emissions<br />
Emissions that result from the activities of the reporting<br />
organization but are generated at sources owned or<br />
controlled by another organization. In the context of<br />
this Indicator, indirect emissions refer to greenhouse<br />
gas emissions from the generation of electricity, heat, or<br />
steam that is imported and consumed by the reporting<br />
organization.<br />
Carbon dioxide equivalent<br />
CO 2<br />
(Carbon Dioxide) equivalent is the measure used to<br />
compare the emissions from various greenhouse gases<br />
based on their global warming potential (GWP). The CO 2<br />
equivalent for a gas is derived by multiplying the tonnes<br />
of the gas by the associated GWP.<br />
Regulatory regime<br />
<strong>Electric</strong> Utility <strong>Sector</strong> <strong>Supplement</strong><br />
Regulatory regime refers to local, sub-national, national<br />
or regional area where there is a common regulatory<br />
framework.<br />
Net<br />
EU<br />
Net refers to electricity output to the grid from the<br />
power plant.<br />
4. Documentation<br />
EU<br />
Emissions resulting from direct and indirect energy use<br />
can be calculated from the data reported in EN3 and EN4.<br />
5. References<br />
• The Greenhouse Gas Protocol (GHG) <strong>Initiative</strong> -<br />
A corporate accounting and reporting standard<br />
(Revised Edition, 2004) of the World Resources<br />
Institute (WRI) and the World Business Council for<br />
Sustainable Development (WBCSD).<br />
• Kyoto Protocol, 1997.<br />
• Intergovernmental Panel on Climate Change<br />
(IPCC), Climate Change 2001, Working Group I: The<br />
Scientific Basis.<br />
24<br />
© 2000-2009 GRI
EN17 Other relevant indirect greenhouse<br />
gas emissions by weight.<br />
1. Relevance<br />
Greenhouse gas emissions are the main cause of climate<br />
change and are governed by the United Nations Framework<br />
Convention on Climate Change (UNFCC) and the<br />
subsequent Kyoto Protocol. For some organizations,<br />
indirect greenhouse gas emissions are significantly greater<br />
than their direct emissions. They are also sufficiently<br />
under the influence of the organization that changes in its<br />
practices can lead to significant reductions. Measuring and<br />
demonstrating efforts to reduce indirect emissions can<br />
demonstrate leadership in combating climate change and<br />
can enhance the organization’s reputation.<br />
2. Compilation<br />
2.1 Identify the greenhouse gas emissions resulting<br />
from indirect energy use. Exclude indirect<br />
emissions from imported electricity, heat, or steam,<br />
as these are covered by EN16.<br />
2.2 Additionally, identify which of the reporting<br />
organization’s activities cause indirect emissions<br />
and assess their amounts (e.g., employee<br />
commuting, business travel, etc).<br />
When deciding on the relevance of these activities,<br />
consider whether emissions of the activity:<br />
Carbon dioxide equivalent<br />
Indicator Protocols Set: EN<br />
CO 2<br />
(Carbon Dioxide) equivalent is the measure used<br />
to compare emissions from various greenhouse gases<br />
based on their global warming potential (GWP). The CO 2<br />
equivalent for a gas is derived by multiplying the tonnes<br />
of the gas by the associated GWP.<br />
4. Documentation<br />
Information can be obtained from external suppliers<br />
of products and services. For certain types of indirect<br />
emissions such as business travel, the organization may<br />
need to combine its own records with data from external<br />
sources to arrive at an estimate.<br />
5. References<br />
• The Greenhouse Gas Protocol (GHG) <strong>Initiative</strong> -<br />
A corporate accounting and reporting standard<br />
(Revised Edition, 2004) of the World Resources<br />
Institute (WRI) and the World Business Council for<br />
Sustainable Development (WBCSD).<br />
• Intergovernmental Panel on Climate Change<br />
(IPCC), Climate Change 2001, Working Group I: The<br />
Scientific Basis.<br />
• Kyoto Protocol, 1997.<br />
IP<br />
&<br />
EUSS<br />
EU<br />
• Are large compared to other activities<br />
generating direct emissions or energy related<br />
indirect emissions (as reported in EN16);<br />
• Are judged to be critical by stakeholders;<br />
• Could be substantially reduced through<br />
actions taken by the reporting organization.<br />
2.3 Report the sum of indirect GHG emissions<br />
identified in tonnes of CO 2<br />
equivalent.<br />
3. Definitions<br />
Indirect emissions<br />
Emissions that are consequences of the activities of the<br />
reporting organization but are generated at sources<br />
owned or controlled by another organization. In the<br />
context of this Indicator, indirect emissions do not<br />
include those generated from imported electricity, heat,<br />
or steam consumed by the reporting organization (e.g.,<br />
transport, packaging).<br />
Version 3.0/EUSS Final Version<br />
25
IP<br />
&<br />
EUSS<br />
Indicator Protocols Set: EN<br />
EN18 <strong>Initiative</strong>s to reduce greenhouse<br />
gas emissions and reductions achieved.<br />
This should be a CORE indicator for the sector.<br />
1. Relevance<br />
Greenhouse gas emissions are the main cause of climate<br />
change and are governed by the United Nations agreed<br />
on the Framework Convention on Climate Change<br />
(UNFCC) and the subsequent Kyoto Protocol. As a result,<br />
different national and international regulations and<br />
incentive systems (such as trading climate certificates)<br />
aim to control the volume and reward the reduction<br />
of greenhouse gas emissions. When monitored<br />
comprehensively, emissions can be reduced effectively<br />
(e.g., by carefully selecting energy-efficient materials,<br />
services, or production capacities).<br />
This Indicator can be used in combination with<br />
EN16 and EN17 to set and monitor reduction targets<br />
with reference to regulations or trading systems at<br />
international or national levels.<br />
EU<br />
4. Documentation<br />
Information can be drawn from data reported under<br />
EN16 and EN17, from emissions measurements,<br />
calculated from accounting data and defaults, or from<br />
estimates. Information on initiatives can likely be found<br />
in records maintained by departments responsible for<br />
environmental management.<br />
5. References<br />
• The Greenhouse Gas Protocol (GHG) <strong>Initiative</strong>- A<br />
corporate accounting and reporting standard<br />
(Revised Edition, 2004) of the World Resources<br />
Institute (WRI) and the World Business Council for<br />
Sustainable Development (WBCSD).<br />
• Kyoto Protocol, 1997.<br />
• Intergovernmental Panel on Climate Change<br />
(IPCC), Climate Change 2001, Working Group I: The<br />
Scientific Basis.<br />
EU<br />
Tracking and reducing greenhouse gas emissions can<br />
improve the overall life cycle performance of products<br />
and services, and serve as part of a comprehensive<br />
design-for-environment program.<br />
2. Compilation<br />
2.1 Identify emissions reductions from all sources<br />
owned or controlled by the reporting organization<br />
as reported under EN16 and resulting from<br />
indirect energy use and activities of the reporting<br />
organization as reported under EN17. Distinguish<br />
between mandatory and voluntary emissions<br />
reductions.<br />
2.2 Report initiatives to reduce greenhouse gas<br />
emissions, include the areas where the initiatives<br />
were implemented.<br />
2.3 Report quantitatively the extent greenhouse<br />
gas emissions reductions achieved during<br />
the reporting period as a direct result of the<br />
initiative(s) in tonnes of CO 2<br />
equivalent.<br />
3. Definitions<br />
None.<br />
26<br />
© 2000-2009 GRI
<strong>Electric</strong> Utility <strong>Sector</strong> <strong>Supplement</strong><br />
EN19 Emissions of ozone-depleting<br />
substances by weight.<br />
1. Relevance<br />
The ozone layer (O 3<br />
) filters out most of the sun’s<br />
biologically harmful ultraviolet (UV-B) radiation. The<br />
Montreal Protocol regulates the phase-out of ozonedepleting<br />
substances (ODS) internationally. Measuring<br />
ODS emissions enables an assessment of how well<br />
the reporting organization complies with current and<br />
future legislation, and its likely risks in this area. This is<br />
particularly relevant for organizations whose processes,<br />
products, and services have used ODS and must<br />
transition to new technologies in order to comply with<br />
phase-out commitments. The reporting organization’s<br />
results on ODS phase-out can help indicate its level<br />
of technology leadership and competitive position in<br />
markets for products and services affected by ODS rules.<br />
2. Compilation<br />
2.1 Ozone-depleting substances contained or emitted<br />
from products during their usage and disposal are<br />
not covered by this Indicator.<br />
2.2 Emissions of substances covered in Annexes A, B,<br />
C, and E of the Montreal Protocol on Substances<br />
that Deplete the Ozone Layer are included.<br />
2.3 Identify emissions of ozone-depleting substances<br />
using the following formulas:<br />
3. Definitions<br />
Ozone-depleting substance (ODS)<br />
Indicator Protocols Set: EN<br />
Any substance with an ozone depletion potential (ODP)<br />
greater than 0 that can deplete the stratospheric ozone<br />
layer. Most ozone-depleting substances are controlled<br />
under the Montreal Protocol and its amendments, and<br />
include CFCs, HCFCs, halons, and methyl bromide.<br />
CFC-11 equivalent<br />
CFC-11 is a measure used to compare various substances<br />
based on their relative ozone depletion potential. The<br />
reference level of 1 is the potential of CFC-11 and CFC-12<br />
to cause ozone depletion.<br />
4. Documentation<br />
Information can be derived from internal measurements<br />
and accounting.<br />
5. References<br />
• The Montreal Protocol on substances that deplete<br />
the ozone layer.<br />
• United Nations Environment Programme (UNEP)<br />
Halon Handbook.<br />
IP<br />
&<br />
EUSS<br />
EU<br />
Emissions = Production + Imports- Exports of<br />
Substances<br />
Production = Substances Produced- Substances<br />
Destroyed by Technology- Substances used<br />
entirely as feedstock in the manufacture of other<br />
chemicals<br />
Note: ODS that is recycled and reused is not<br />
considered production.<br />
2.4 Report the emissions of specific ozone-depleting<br />
substances in tonnes and tonnes of CFC-11<br />
equivalent.<br />
Version 3.0/EUSS Final Version<br />
27
IP<br />
&<br />
EUSS<br />
EU<br />
Indicator Protocols Set: EN<br />
EN20 NO x<br />
, SO x<br />
, and other significant air<br />
emissions by type and weight.<br />
1. Relevance<br />
This Indicator measures the scale of the organization’s<br />
air emissions and can demonstrate the relative size<br />
and importance of these emissions compared to other<br />
organizations.<br />
Air pollutants have adverse effects on habitats and<br />
human and animal health. Deterioration of air quality,<br />
acidification, forest degradation, as well as public health<br />
concerns has led to local and international regulations to<br />
control air emissions. Reductions in regulated pollutants<br />
lead to improved health conditions for workers and<br />
neighboring communities. Reductions or demonstrated<br />
performance beyond compliance can enhance relations<br />
with affected communities and workers, and the ability<br />
to maintain or expand operations. In regions with<br />
emission caps, the volume of emissions also has direct<br />
cost implications for the organization.<br />
2. Compilation<br />
2.1 Identify significant air emissions and calculate their<br />
weight.<br />
2.2 Since calculating certain air emissions such as NOx<br />
requires complex quantification efforts, indicate<br />
the methodology used for calculations, selecting<br />
one of the following approaches:<br />
• Direct measurement of emissions (e.g., online<br />
analyzers, etc.);<br />
• Calculation based on site specific data;<br />
• Calculation based on default data; or<br />
• Estimation (if estimations are used due to a<br />
lack of default figures, indicate on what basis<br />
figures were obtained).<br />
2.3 Report the weight of significant air emissions (in<br />
kilograms or multiples such as tonnes) for each of<br />
the following categories:<br />
• NO x<br />
;<br />
• SO x<br />
;<br />
• Persistent organic pollutants (POP);<br />
• Volatile organic compounds (VOC);<br />
• Hazardous air pollutants (HAP);<br />
• Stack and fugitive emissions;<br />
• Particulate matter (PM); or<br />
• Other standard categories of air emissions<br />
identified in regulations.<br />
2.4 Report emissions per MWh for:<br />
• Net generation from all generating capacity;<br />
• Net generation from all combustion power<br />
plants;<br />
Examples of “other significant air emissions”<br />
include but are not limited to mercury, coal pile<br />
dust, ash lagoons or ponds, precipitator dust, and<br />
reservoir draw down dust.<br />
3. Definitions<br />
Significant air emissions<br />
Air emissions that are regulated under international<br />
conventions and/or national laws or regulations,<br />
including those listed on environmental permits for the<br />
reporting organization’s operations.<br />
4. Documentation<br />
Information can be drawn from emissions<br />
measurements, calculated from accounting data and<br />
defaults, or estimated.<br />
5. References<br />
<strong>Electric</strong> Utility <strong>Sector</strong> <strong>Supplement</strong><br />
• Geneva Protocol to the Convention on Long-Range<br />
Transboundary Air Pollution, 1979.<br />
• Helsinki Protocol to the Convention on Long-<br />
Range Transboundary Air Pollution, 1985.<br />
• Rotterdam Convention on the Prior Informed<br />
Consent (PIC) Procedure, 1998.<br />
• Stockholm Convention on Persistent Organic<br />
Pollutants (POPs) (Annex A, B, and C), 2001.<br />
• Sofia Protocol to the Convention on Long-Range<br />
Transboundary Air Pollution, 1988.<br />
• Gothenburg Protocol to the 1979 Convention on<br />
Long-Range Transboundary Air Pollution to abate<br />
acidification, eutrophication, and ground-level<br />
ozone.<br />
EU<br />
28<br />
© 2000-2009 GRI
Indicator Protocols Set: EN<br />
IP<br />
&<br />
EUSS<br />
EN21 Total water discharge by quality<br />
and destination.<br />
1. Relevance<br />
vary depending on the organization’s products/<br />
services/operations. The selection of parameters<br />
should be consistent with those used in the<br />
organization’s sector.<br />
The amount and quality of the water discharged by the<br />
reporting organization is directly linked to ecological<br />
impact and operational costs. By progressively improving<br />
the quality of discharged water and/or reducing volumes,<br />
the reporting organization has the potential to reduce<br />
its impact on the surrounding environment. Unmanaged<br />
discharge of effluents with a high chemical or nutrient<br />
load (principally nitrogen, phosphorous, or potassium)<br />
can have a significant impact on receiving waters. This, in<br />
turn, can affect the quality of the water supply available<br />
to the organization and its relationship with communities<br />
and other water users.<br />
Discharging effluents or process water to a facility<br />
for treatment not only reduces pollution levels, but<br />
can also lower the organization’s financial costs and<br />
the risk of regulatory action for non-compliance with<br />
environmental regulation. All of this enhances the<br />
reporting organization’s social license to operate.<br />
Clean water refers to water that meets national<br />
regulations for freshwater quality when leaving the<br />
boundaries of the reporting organization. This can be<br />
either freshwater whose quality has not been affected by<br />
the organization’s use, or wastewater that is treated to<br />
meet freshwater standards prior to discharge.<br />
3. Definitions<br />
Total water discharge<br />
The sum of water effluents discharged over the course<br />
of the reporting period to subsurface waters, surface<br />
waters, sewers that lead to rivers, oceans, lakes, wetlands,<br />
treatment facilities, and ground water either through:<br />
• A defined discharge point (point source discharge);<br />
• Over land in a dispersed or undefined manner<br />
(non-point source discharge); or<br />
2. Compilation<br />
2.1 Identify planned and unplanned water discharges<br />
(including thermal discharges)<br />
(excluding collected rainwater and domestic<br />
sewage) by destination and indicate how it is<br />
treated. If the reporting organization does not<br />
have a meter to measure water discharges, this<br />
figure needs to be estimated by subtracting the<br />
approximate volume consumed on-site from the<br />
volume withdrawn as reported in EN8.<br />
2.2 Report the total volume of planned and unplanned<br />
water discharges in cubic meters per year<br />
(m 3 /year) by:<br />
• Destination;<br />
• Treatment method; and<br />
• Whether it was reused by another<br />
organization.<br />
EU<br />
• Wastewater removed from the reporting<br />
organization via truck. Discharge of collected<br />
rainwater and domestic sewage is not regarded as<br />
water discharge.<br />
Thermal Discharges<br />
Waste heat from power plant operations released into<br />
the environment. This usually refers to water that is<br />
pumped from a nearby body for use as condenser<br />
cooling water, where it picks up heat and then is<br />
discharged back into the water body. The heated water<br />
thus adds thermal energy to the water body, which may<br />
have an effect on the local ecosystems.<br />
4. Documentation<br />
Information sources about the volume of water<br />
discharged by the reporting organization include flow<br />
meters (point-source discharges or when discharges are<br />
released through a pipe) and regulatory permits.<br />
5. References<br />
EU<br />
EU<br />
2.3 <strong>Reporting</strong> organizations that discharge effluents<br />
or process water should report water quality in<br />
terms of total volumes of effluent using standard<br />
effluent parameters such as Biological Oxygen<br />
Demand (BOD), Total Suspended Solids (TSS),<br />
etc. The specific choice of quality parameters will<br />
• MARPOL Convention (International Convention for<br />
the Prevention of Pollution of Ships), 1973.<br />
• Stockholm Convention on Persistent Organic<br />
Pollutants (POPs), 2001.<br />
Version 3.0/EUSS Final Version<br />
29
IP<br />
&<br />
EUSS<br />
EU<br />
Indicator Protocols Set: EN<br />
EN22 Total weight of waste by type and<br />
disposal method.<br />
1. Relevance<br />
Data on waste generation figures over several years<br />
can indicate the level of progress the organization has<br />
made toward waste reduction efforts. It can also indicate<br />
potential improvements in process efficiency and<br />
productivity. From a financial perspective, the reduction<br />
of waste contributes directly to lower costs for materials,<br />
processing, and disposal.<br />
Information about the disposal destination reveals the<br />
extent to which a reporting organization has managed<br />
the balance between disposal options and uneven<br />
environmental impacts. For example, land filling and<br />
recycling create very different types of environmental<br />
impacts and residual effects. Most waste minimization<br />
strategies emphasize prioritizing options for recovery,<br />
reuse, or recycling over other disposal options, wherever<br />
possible.<br />
2. Compilation<br />
2.1 Identify the amount of waste created by the<br />
organization’s operations, by:<br />
• Hazardous waste (as defined by national<br />
legislation at the point of generation);<br />
• Incineration (or use as fuel);<br />
• Landfill;<br />
<strong>Electric</strong> Utility <strong>Sector</strong> <strong>Supplement</strong><br />
• Deep well injection;<br />
• On-site storage; and<br />
• Other (to be specified by the reporting<br />
organization).<br />
2.5 Report mass and activity of spent nuclear fuel<br />
sent for processing and reprocessing per year. In<br />
addition, report radioactive waste produced per<br />
net MWh nuclear generation per year.<br />
2.6 Report (in terms of mass and activity) low/<br />
intermediate level waste and high level waste<br />
separately, based on IAEA radioactive waste<br />
classification. This should also include waste<br />
produced from reprocessing activities, where data<br />
is available.<br />
2.7 Report how the method of disposal has been<br />
determined:<br />
• Disposed directly by the reporting<br />
organization or otherwise directly confirmed;<br />
EU<br />
• including PCB waste; and<br />
• Non-hazardous waste (all other forms of solid<br />
or liquid waste excluding wastewater).<br />
2.2 Report on nuclear waste using IAEA definitions<br />
and protocols.<br />
EU<br />
EU<br />
• Information provided by the waste disposal<br />
contractor; or<br />
• Organizational defaults of the waste disposal<br />
contractor.<br />
3. Definitions<br />
2.3 If no weight data are available, estimate the weight<br />
using available information on waste density<br />
and volume collected, mass balances, or similar<br />
information.<br />
2.4 Report the total amount of waste in tonnes by<br />
type as identified in 2.1 for each of the following<br />
disposal methods:<br />
• Composting;<br />
• Reuse;<br />
• Recycling;<br />
• Recovery;<br />
Disposal method<br />
The method by which waste is treated or disposed,<br />
including composting, reuse, recycling, recovery,<br />
incineration, landfill, deep well injection, and on-site<br />
storage.<br />
Polychlorinated Biphenyls (PCBs)<br />
A group of toxic, bioaccumulative, and persistent<br />
chemicals used as an insulating medium in<br />
transformers and capacitors.<br />
4. Documentation<br />
Potential information sources include external waste<br />
audits by providers of disposal services or waste balance<br />
sheets from these providers, as well as internal billing<br />
and accounting systems, and the procurement or supply<br />
management department.<br />
EU<br />
30<br />
© 2000-2009 GRI
Indicator Protocols Set: EN<br />
IP<br />
&<br />
EUSS<br />
5. References<br />
• Ban Amendment to the Basel Convention on<br />
the Control of Transboundary Movements of<br />
Hazardous Wastes and their Disposal, 1989.<br />
• London Dumping Convention, 1972.<br />
• MARPOL Convention (International Convention for<br />
the Prevention of Pollution of Ships), 1973.<br />
EU<br />
Version 3.0/EUSS Final Version<br />
31
IP<br />
&<br />
EUSS<br />
Indicator Protocols Set: EN<br />
EN23 Total number and volume of<br />
significant spills.<br />
1. Relevance<br />
Spills of chemicals, oils, and fuels can have significant<br />
negative impacts on the surrounding environment,<br />
potentially affecting soil, water, air, biodiversity,<br />
and human health. The systematic effort to avoid<br />
spills of hazardous materials is directly linked to the<br />
organization’s compliance with regulations, its financial<br />
risk from the loss of raw materials, remediation costs,<br />
the risk of regulatory action, as well as damage to<br />
reputation. This Indicator also serves as an indirect<br />
measure for evaluating the monitoring skills of the<br />
organization.<br />
2. Compilation<br />
2.1 Identify all recorded significant spills and the<br />
volume of these spills.<br />
Significant spill<br />
All spills that are included in the reporting organization’s<br />
financial statement (e.g., due to resulting liabilities) or<br />
recorded as a spill by the reporting organization.<br />
4. Documentation<br />
Potential information sources regarding spills of fuel, oils,<br />
and chemicals can be internal records within an existing<br />
environmental management system as well as official<br />
statements made to/by the relevant environmental<br />
regulatory agency.<br />
5. References<br />
None.<br />
2.2 Report the total number and total volume of<br />
recorded significant spills.<br />
EU<br />
2.3 For spills that were reported in the organization’s<br />
financial statement, report the additional following<br />
information for each such spill:<br />
• Location of spill;<br />
• Volume of spill; and<br />
• Material of spill, categorized by:<br />
- Oil spills (soil or water surfaces);<br />
- Fuel spills (soil or water surfaces);<br />
- Spills of wastes (soil or water surfaces);<br />
- Spills of chemicals (mostly soil or water<br />
surfaces); and<br />
- Other.<br />
2.4 Report the impacts of significant spills.<br />
3. Definitions<br />
Spill<br />
Accidental release of a hazardous substance that can<br />
affect human health, land, vegetation, water bodies, and<br />
ground water.<br />
32<br />
© 2000-2009 GRI
EN24 Weight of transported, imported,<br />
exported, or treated waste deemed<br />
hazardous under the terms of the Basel<br />
Convention Annex I, II, III, and VIII,<br />
and percentage of transported waste<br />
shipped internationally.<br />
1. Relevance<br />
Hazardous waste management is a key area of concern<br />
for many stakeholders. Improper transport of dangerous<br />
wastes, particularly to countries that lack the infrastructure<br />
and national regulations to handle such waste, can pose<br />
harm to both human health and the environment. In<br />
addition, poor management of hazardous waste creates<br />
liabilities associated with non-compliance with national<br />
and international regulations, as well as potential damage<br />
to reputation.<br />
2. Compilation<br />
2.1 Identify hazardous wastes transported by or on<br />
behalf of the reporting organization within the<br />
reporting period by destination.<br />
2.2 Identify the total weight of transported hazardous<br />
waste using the following equation:<br />
Total weight of hazardous waste transported by<br />
destination<br />
=<br />
Weight of hazardous waste transported to the<br />
reporting organization by destination from<br />
external sources/suppliers not owned by the<br />
reporting organization<br />
+<br />
Weight of hazardous waste transported from the<br />
reporting organization by destination to external<br />
sources/suppliers not owned by the reporting<br />
organization<br />
+<br />
Weight of hazardous waste transported nationally<br />
and/or internationally by destination between<br />
locations owned, leased, or managed by the<br />
reporting organization<br />
2.3 Identify the total weight of hazardous waste<br />
transported across international borders and<br />
which enters the boundaries of the reporting<br />
Indicator Protocols Set: EN<br />
organization, by destination. Waste transported<br />
between different locations of the organization is<br />
not counted as imported.<br />
2.4 Identify the proportion of the total amount of<br />
transported hazardous waste by destination that<br />
is transported from the reporting organization to<br />
locations abroad. Include all wastes that leave the<br />
boundaries of the reporting organization to cross<br />
international borders, excluding transportation<br />
between different locations of the reporting<br />
organization.<br />
2.5 Identify the portion of the total amount of<br />
transported and exported waste by destination<br />
that the organization has treated.<br />
2.6 Identify the portion of the total amount of waste<br />
by destination that is treated by external sources/<br />
suppliers, that has been transported, exported, or<br />
imported by the organization.<br />
2.7 Convert volumes to an estimate of weight with a<br />
brief explanation of the methodology used.<br />
2.8 Report the following information in kilograms or<br />
tonnes:<br />
• Total weight of hazardous waste transported;<br />
• Total weight of imported hazardous waste;<br />
• Total weight of exported hazardous waste; and<br />
• Total weight of treated hazardous waste.<br />
3. Definitions<br />
None.<br />
4. Documentation<br />
Potential information sources include billing data from<br />
logistic or disposal contractors, accounting systems,<br />
as well as the procurement or supply management<br />
department. Some countries require documentation<br />
to accompany hazardous waste shipments that would<br />
supply all relevant data for this Indicator.<br />
5. References<br />
• Ban Amendment to the Basel Convention on<br />
the Control of Transboundary Movements of<br />
Hazardous Wastes and their Disposal, 1989.<br />
IP<br />
&<br />
EUSS<br />
EU<br />
Version 3.0/EUSS Final Version<br />
33
IP<br />
&<br />
EUSS<br />
EU<br />
Indicator Protocols Set: EN<br />
EN25 Identity, size, protected status, and<br />
biodiversity value of water bodies and<br />
related habitats significantly affected by<br />
the reporting organization’s discharges<br />
of water and runoff.<br />
1. Relevance<br />
This Indicator is a qualitative counterpart to quantitative<br />
Indicators of water discharge that helps to describe<br />
the impact of these discharges. Discharges and runoff<br />
affecting aquatic habitats can have a significant impact<br />
on the availability of water resources. Identifying water<br />
bodies affected by discharges provides an opportunity<br />
to identify activities in regions of significant concern,<br />
or areas where the reporting organization may face<br />
specific risks due to community concerns, limited water<br />
resources, etc.<br />
2. Compilation<br />
2.1 Identify water bodies significantly affected by the<br />
reporting organization’s water discharges that<br />
meet one of more of the following criteria:<br />
• Discharges account for an average of 5% or<br />
more of the annual average volume of the<br />
water body;<br />
2.2 Report water bodies significantly affected by water<br />
discharges based on the criteria above, adding<br />
information on:<br />
• Size of water body in cubic meters (m 3 );<br />
• Whether the source is designated as<br />
a protected area (nationally and/or<br />
internationally); and<br />
• Biodiversity value (e.g., number of protected<br />
species).<br />
3. Definitions<br />
None.<br />
4. Documentation<br />
Information on the status of a water source or protected<br />
area can be obtained from local or national waterrelated<br />
ministries or government departments, or<br />
through research initiated by the organization or other<br />
institutions, such as environmental impact studies.<br />
5. References<br />
• IUCN Red List of Threatened Species.<br />
• Ramsar Convention on Wetlands.<br />
• Discharges that, on the advice of appropriate<br />
professionals (e.g., municipal authorities), are<br />
known to have or are highly likely to have<br />
significant impacts on the water body and<br />
associated habitats;<br />
• Discharges to water bodies that are recognized<br />
by professionals to be particularly sensitive<br />
due to their relative size, function, or status as<br />
a rare, threatened, or endangered system (or<br />
support a particular endangered species of<br />
plant or animal); or<br />
• Any discharge to a Ramsar-listed wetland<br />
or any other nationally or internationally<br />
proclaimed conservation area regardless of the<br />
rate of discharge.<br />
34<br />
© 2000-2009 GRI
EN26 <strong>Initiative</strong>s to mitigate<br />
environmental impacts of products<br />
and services, and extent of impact<br />
mitigation.<br />
1. Relevance<br />
For some sectors, the impacts of products and services<br />
during their use phase (e.g., water consumption of a<br />
washing machine) and at the end of their useful life<br />
can be equal to or greater in significance than the<br />
production phase. The significance of such impacts is<br />
determined by both customer behavior and general<br />
product/service design. Organizations are expected<br />
to take more proactive approaches to assessing and<br />
improving the environmental impacts of their products<br />
and services.<br />
This measure assesses the actions the reporting<br />
organization has taken to reduce the negative<br />
environmental impacts and enhance the positive<br />
impacts of its product and service design and delivery.<br />
Design for environment can help identify new business<br />
opportunities, differentiate products and services,<br />
and stimulate innovation in technology. Integrating<br />
environmental considerations into product and service<br />
design can also decrease the risk of incompatibility with<br />
future environmental legislation, as well as enhance<br />
reputation.<br />
Indicator Protocols Set: EN<br />
• Effluents (e.g., quality of water used during<br />
production and/or use);<br />
• Noise; and<br />
• Waste (e.g., non-reclaimable, toxic materials/<br />
compounds).<br />
2.3 Report quantitatively the extent to which<br />
environmental impacts of products and services<br />
have been mitigated during the reporting period.<br />
If use-oriented figures are employed (e.g., water<br />
use of washing machine), clearly indicate the<br />
underlying assumptions regarding consumption<br />
patterns or normalization factors (e.g., 10% less<br />
water use per 5 kg of laundry).<br />
3. Definitions<br />
None.<br />
4. Documentation<br />
Information can be drawn from product Lifecycle<br />
Assessments (LCA) or documents related to product<br />
design, development, and testing.<br />
5. References<br />
None.<br />
IP<br />
&<br />
EUSS<br />
EU<br />
2. Compilation<br />
2.1 In this Indicator, the following impacts are<br />
excluded since they are covered in other<br />
Environmental Indicators:<br />
• Reclaiming of products (EN27); and<br />
• Impacts on biodiversity (EN12).<br />
2.2 Report initiatives in the reporting period to<br />
mitigate the most significant environmental<br />
impacts of products/service groups in relation to:<br />
• Materials use (e.g., use of non-renewable,<br />
energy-intensive, toxic materials);<br />
• Water use (e.g., volumes used during<br />
production and/or use);<br />
• Emissions (e.g., GHG, toxic, ozone-depleting<br />
emissions);<br />
Version 3.0/EUSS Final Version<br />
35
IP<br />
&<br />
EUSS<br />
EU<br />
Indicator Protocols Set: EN<br />
EN27 Percentage of products sold<br />
and their packaging materials that are<br />
reclaimed by category.<br />
1. Relevance<br />
The disposal of products and packaging materials at the<br />
end of a use phase is a steadily growing environmental<br />
challenge. Establishing effective recycling and reuse<br />
systems to close product cycles can contribute<br />
significantly to increased material and resource<br />
efficiency. It also mitigates problems and costs related to<br />
disposal.<br />
This Indicator provides insight into the extent to which<br />
the reporting organization’s products, components,<br />
or materials are collected and successfully converted<br />
into useful materials for new production processes.<br />
It also provides insight into the degree to which the<br />
organization has designed products and packages<br />
capable of being recycled or reused. This measure can<br />
be a particular source of competitive differentiation in<br />
sectors facing formal requirements to recycle products<br />
and their packaging materials.<br />
2. Compilation<br />
2.1 Identify the amount of products and their<br />
packaging materials reclaimed (i.e., recycled or<br />
reused) at the end of their useful life within the<br />
reporting period. Rejects and recalls of products<br />
should not be counted. Recycling or reuse of<br />
packaging should also be reported separately.<br />
3. Definitions<br />
Reclaimed<br />
Refers to collecting, reusing, or recycling products and<br />
their packaging materials at the end of their useful life.<br />
Collection and treatment can be carried out by the<br />
manufacturer of the product or by a contractor. This<br />
refers to products and their packaging materials that are:<br />
• Collected by or on behalf of the reporting<br />
organization;<br />
• Separated into raw materials (e.g., steel, glass,<br />
paper, some kinds of plastic, etc.) or components;<br />
and<br />
• Used by the reporting organization or other users.<br />
4. Documentation<br />
None.<br />
5. References<br />
None.<br />
2.2 Report the percentage of reclaimed products and<br />
their packaging materials for each category of<br />
products (i.e., a group of related products sharing<br />
a common, managed set of features that satisfy<br />
the specific needs of a selected market) using the<br />
following formula:<br />
products and their packaging<br />
materials reclaimed within<br />
% of reclaimed the reporting period<br />
products =<br />
products sold within the<br />
reporting period<br />
x100<br />
2.3 Given potential variations in data sources, report<br />
how the data for this Indicator has been collected<br />
(e.g., data is gathered from an internal collection<br />
system or data is provided by external collection<br />
systems reclaiming products on behalf of the<br />
organization).<br />
36<br />
© 2000-2009 GRI
EN28 Monetary value of significant<br />
fines and total number of non-monetary<br />
sanctions for non-compliance with<br />
environmental laws and regulations.<br />
1. Relevance<br />
The level of non-compliance within the organization<br />
helps indicate the ability of management to ensure<br />
that operations conform to certain performance<br />
parameters. From an economic perspective, ensuring<br />
compliance helps to reduce financial risks that occur<br />
either directly through fines or indirectly through<br />
impacts on reputation. In some circumstances, noncompliance<br />
can lead to clean-up obligations or other<br />
costly environmental liabilities. The strength of the<br />
organization’s compliance record can also affect its<br />
ability to expand operations or gain permits.<br />
2. Compilation<br />
2.1 Identify administrative or judicial sanctions for<br />
failure to comply with environmental laws and<br />
regulations, including:<br />
• International declarations/conventions/<br />
treaties, and national, sub-national, regional,<br />
and local regulations. Include non-compliances<br />
related to spills as disclosed under EN23 that<br />
meet the criteria for EN28;<br />
Indicator Protocols Set: EN<br />
2.3 Where reporting organizations have not identified<br />
any non-compliance with laws or regulations, a<br />
brief statement to this fact is sufficient.<br />
3. Definitions<br />
Environmental laws and regulations<br />
Refers to regulations related to all types of<br />
environmental issues (i.e., emissions, effluents, and<br />
waste, as well as material use, energy, water, and<br />
biodiversity) applicable to the reporting organization.<br />
This includes binding voluntary agreements that are<br />
made with regulatory authorities and developed<br />
as a substitute for implementing a new regulation.<br />
Voluntary agreements can be applicable if the<br />
reporting organization directly joins the agreement or<br />
if public agencies make the agreement applicable to<br />
organizations in their territory through legislation or<br />
regulation.<br />
4. Documentation<br />
Data sources include audit results or regulatory tracking<br />
systems operated by the legal department. Information<br />
regarding monetary fines can be found in accounting<br />
departments.<br />
5. References<br />
None.<br />
IP<br />
&<br />
EUSS<br />
EU<br />
• Voluntary environmental agreements with<br />
regulating authorities that are considered<br />
binding and developed as a substitute for<br />
implementing new regulations. In certain<br />
jurisdictions, such agreements are referred to<br />
as ‘covenants’; and<br />
• Cases brought against the organization<br />
through the use of international dispute<br />
mechanisms or national dispute mechanisms<br />
supervised by government authorities.<br />
2.2 Report significant fines and non-monetary<br />
sanctions in terms of:<br />
• Total monetary value of significant fines;<br />
• Number of non-monetary sanctions; and<br />
• Cases brought through dispute resolution<br />
mechanisms.<br />
Version 3.0/EUSS Final Version<br />
37
IP<br />
&<br />
EUSS<br />
EU<br />
Indicator Protocols Set: EN<br />
EN29 Significant environmental<br />
impacts of transporting products and<br />
other goods and materials used for<br />
the organization’s operations, and<br />
transporting members of the workforce.<br />
1. Relevance<br />
The environmental impacts of transportation systems<br />
have a wide reach, from global warming to local smog<br />
and noise. For some companies, particularly those<br />
with extensive supply and distribution networks,<br />
environmental impacts associated with logistics can<br />
represent a major part of their environmental footprint.<br />
Assessing the impacts of transporting products, goods,<br />
and materials for logistical purposes, and transporting<br />
members of the organization’s workforce, is part of a<br />
comprehensive approach to planning environmental<br />
management strategies.<br />
2. Compilation<br />
2.1 Identify the significant environmental impacts<br />
of the modes of transportation used by the<br />
organization, including:<br />
• Energy use (e.g., oil, kerosene, fuel, electricity);<br />
• Emissions (e.g., greenhouse gas emissions,<br />
ozone-depleting substances, NO x<br />
, SO x<br />
, and<br />
other air emissions);<br />
• Effluents (e.g., different kinds of chemicals);<br />
• Waste (e.g., different types of packaging<br />
material);<br />
• Noise; and<br />
2.4 Report how the environmental impacts<br />
of transporting products, members of the<br />
organization’s workforce, and other goods and<br />
materials are mitigated.<br />
3. Definitions<br />
Transportation<br />
The act of transferring resources and goods from one<br />
location to another (between suppliers, production<br />
plants, warehouses, and the customer) using different<br />
modes of transport, including passenger transportation<br />
(e.g., employee commuting and business traveling).<br />
Logistical purposes<br />
The forward or reverse flow and storage of goods and<br />
services between the point of origin and the point of<br />
consumption.<br />
Transportation of the members of the<br />
organization’s workforce<br />
Transportation used for commuting to work by members<br />
of the workforce or travel for business purposes<br />
including air, train, bus, and other forms of motorized<br />
and non-motorized travel.<br />
4. Documentation<br />
Potential sources of data include invoices from logistical<br />
service providers and suppliers, reports from the logistics<br />
department, records of vehicle usage and maintenance,<br />
and monitoring/measurement conducted by, for<br />
example, the environment department.<br />
5. References<br />
• United Nations Recommendations on the<br />
Transport of Dangerous Goods.<br />
• Spills (e.g., spills of chemicals, oils, and fuels).<br />
2.2 Report the significant environmental impacts of<br />
transportation used for logistical purposes and for<br />
transportation of members of the organization’s<br />
workforce. Where quantitative data is not stated in<br />
the report, disclose the reason.<br />
2.3 Indicate the criteria and methodology used to<br />
determine which environmental impacts are<br />
significant.<br />
38<br />
© 2000-2009 GRI
EN30 Total environmental protection<br />
expenditures and investments by type.<br />
1. Relevance<br />
Measuring environmental mitigation and protection<br />
expenditures allows organizations to assess the<br />
efficiency of their environmental initiatives. It also<br />
provides valuable input for internal cost-benefit<br />
analyses. Data on environmental performance measured<br />
against environmental mitigation and protection<br />
expenditures offers insights into how effectively the<br />
organization uses resources to improve performance.<br />
When tracked and analyzed in a comprehensive<br />
fashion over time, this expenditures data allows the<br />
reporting organization to judge the value of complex<br />
organizational or technological investments for<br />
improving environmental performance.<br />
It is possible to establish a full environmental<br />
management accounting system within an organization<br />
that tracks multiple categories of information. This<br />
Indicator focuses on waste disposal, emissions<br />
treatment, remediation costs, as well as prevention and<br />
environmental management costs.<br />
2. Compilation<br />
2.1 The compilation of the expenditures in this<br />
Indicator should exclude the following categories<br />
as defined in the IFAC ‘International Guidance<br />
Document on Environmental Management<br />
Accounting’ document:<br />
• Costs of non-product output; and<br />
• Fines for non-compliance with environmental<br />
regulation.<br />
2.2 Identify waste disposal, emissions treatment, and<br />
remediation costs based on expenditures related<br />
to the following items:<br />
• Treatment and disposal of waste;<br />
• Treatment of emissions (e.g., expenditures for<br />
filters, agents);<br />
• Expenditures for the purchase and use of<br />
emissions certificates;<br />
• Depreciation of related equipment,<br />
maintenance, and operating material and<br />
services, and related personnel costs;<br />
Indicator Protocols Set: EN<br />
• Insurance for environmental liability; and<br />
• Clean-up costs, including costs for remediation<br />
of spills as reported in EN23.<br />
2.3 Identify prevention and environmental<br />
management costs based on expenditures related<br />
to the following items:<br />
• Personnel employed for education and training;<br />
• External services for environmental<br />
management;<br />
• External certification of management systems;<br />
• Personnel for general environmental<br />
management activities;<br />
• Research and development;<br />
• Extra expenditures to install cleaner<br />
technologies (e.g., additional cost beyond<br />
standard technologies);<br />
• Extra expenditures on green purchases; and<br />
• Other environmental management costs.<br />
2.4 Report total environmental protection<br />
expenditures broken down by:<br />
• Waste disposal, emissions treatment, and<br />
remediation costs; and<br />
• Prevention and environmental management<br />
costs.<br />
3. Definitions<br />
Environmental protection expenditures<br />
All expenditures on environmental protection by the<br />
reporting organization, or on its behalf, to prevent,<br />
reduce, control, and document environmental aspects,<br />
impacts, and hazards. It also includes disposal,<br />
treatment, sanitation, and clean-up expenditure.<br />
4. Documentation<br />
Potential information sources include billing and<br />
accounting systems (e.g., Environmental Management<br />
Accounting) as well as procurement, human resource,<br />
and legal departments.<br />
IP<br />
&<br />
EUSS<br />
EU<br />
Version 3.0/EUSS Final Version<br />
39
IP<br />
&<br />
EUSS<br />
Indicator Protocols Set: EN<br />
5. References<br />
• IFAC- The International Federation of Accountants<br />
(2005) ‘International Guidance Document on<br />
Environmental Management Accounting’.<br />
• UNDSD- United Nations Division for Sustainable<br />
Development (2003): Environmental Management<br />
Accounting Procedures and Principles (EMARIC<br />
Environmental Management Accounting Research<br />
and Information Center, 2003).<br />
EU<br />
40<br />
© 2000-2009 GRI
EU<br />
Indicator Protocols Set<br />
Labor Practices and Decent Work (LA)<br />
© 2000-2011 GRI Version 3.0/EUSS Final Version
Labor Practices & Decent Work<br />
<strong>Electric</strong> utilities sector specific<br />
disclosures on management<br />
approach<br />
Aspect: Employment<br />
Aspect: Labor/ Management Relations<br />
Indicator Protocols Set: LA<br />
IP<br />
&<br />
EUSS<br />
Co r e<br />
EU14. Programs and processes to ensure the<br />
availability of a skilled workforce.<br />
Co r e<br />
LA4<br />
Percentage of employees covered by<br />
collective bargaining agreements.<br />
Co r e<br />
EU15. Percentage of employees eligible to retire in<br />
the next 5 and 10 years broken down by job<br />
category and by region.<br />
EU<br />
Co r e<br />
See<br />
<strong>Sector</strong> Specific Commentary in Protocol.<br />
EU<br />
Co r e<br />
EU16. Policies and requirements regarding health<br />
and safety of employees and employees of<br />
contractors and subcontractors.<br />
Performance Indicators<br />
Aspect: Employment<br />
Co r e<br />
Co r e<br />
Co r e<br />
Co r e<br />
Co r e<br />
LA1<br />
LA2<br />
Total workforce by employment type,<br />
employment contract, and region.<br />
See<br />
<strong>Sector</strong> Specific Commentary in Protocol.<br />
Total number and rate of employee turnover<br />
by age group, gender, and region.<br />
See<br />
<strong>Sector</strong> Specific Commentary in Protocol.<br />
EU17. Days worked by contractor and subcontractor<br />
employees involved in construction, operation<br />
& maintenance activities.<br />
EU<br />
EU<br />
EU<br />
Co r e<br />
LA5<br />
Minimum notice period(s) regarding<br />
significant operational changes, including<br />
whether it is specified in collective<br />
agreements.<br />
Aspect: Occupational Health and Safety<br />
A d d<br />
Co r e<br />
Co r e<br />
Co r e<br />
LA6<br />
LA7<br />
LA8<br />
Percentage of total workforce represented<br />
in formal joint management-worker health<br />
and safety committees that help monitor<br />
and advise on occupational health and safety<br />
programs.<br />
Rates of injury, occupational diseases, lost<br />
days, and absenteeism, and total number of<br />
work-related fatalities by region.<br />
See<br />
<strong>Sector</strong> Specific Commentary in Protocol.<br />
Education, training, counseling, prevention,<br />
and risk-control programs in place to<br />
assist workforce members, their families,<br />
or community members regarding serious<br />
diseases.<br />
EU<br />
EU<br />
Co r e<br />
A d d<br />
EU18. Percentage of contractor and subcontractor<br />
employees that have undergone relevant<br />
health and safety training.<br />
LA3<br />
Benefits provided to full-time employees that<br />
are not provided to temporary or part-time<br />
employees, by major operations.<br />
A d d<br />
LA9<br />
Health and safety topics covered in formal<br />
agreements with trade unions.Health and<br />
safety topics covered in formal agreements<br />
with trade unions.<br />
Version 3.0/EUSS Final Version<br />
1
IP<br />
&<br />
EUSS<br />
Indicator Protocols Set: LA<br />
Aspect: Training and Education<br />
Co r e<br />
LA10 Average hours of training per year per<br />
employee by employee category.<br />
A d d<br />
LA11 Programs for skills management and<br />
lifelong learning that support the continued<br />
employability of employees and assist them in<br />
managing career endings.<br />
A d d<br />
LA12 Percentage of employees receiving regular<br />
performance and career development<br />
reviews.<br />
Aspect: Diversity and Equal Opportunity<br />
Co r e<br />
LA13 Composition of governance bodies and<br />
breakdown of employees per category<br />
according to gender, age group, minority<br />
group membership, and other indicators of<br />
diversity.<br />
Co r e<br />
LA14 Ratio of basic salary of men to women by<br />
employee category.<br />
EU<br />
2<br />
© 2000-2009 GRI
Relevance<br />
The ILO Decent Work Agenda is framed within the context<br />
of fair globalization, which aims to achieve both economic<br />
growth and equity through a combination of social and<br />
economic goals. The Agenda has four elements:<br />
• Employment;<br />
• Dialogue;<br />
• Rights; and<br />
• Protection.<br />
The structure of the Labor Indicators is broadly based<br />
on the concept of decent work. The set begins with<br />
disclosures on the scope and diversity of the reporting<br />
organization’s workforce, emphasizing aspects of gender<br />
and age distribution.<br />
The approach to dialogue between the organization and<br />
its employees, and the degree to which employees<br />
are organized in representative bodies are covered by<br />
Indicators LA4 (which complements Indicator HR5 on<br />
Freedom of Association and Collective Bargaining) and LA5.<br />
The physical protection and well-being of people at work<br />
is covered by Occupational Health and Safety Indicators<br />
(LA6, LA7, LA8, LA9), which address both the scope of<br />
programs as well as statistical performance on health<br />
and safety.<br />
The scope of employee benefits and contributions toward<br />
a broad social goal of diversity and equal treatment is<br />
addressed by LA14 (Pay Equity), LA13 (Diversity) and<br />
LA3 (Benefits). Indicators in the Economics category also<br />
provide relevant information. The support organizations<br />
provide to employees to enhance personal skills and<br />
potential (which also improves the organization’s human<br />
capital) is represented in Indicators LA10, LA11, and LA12.<br />
Definitions<br />
Total workforce<br />
The total number of persons working for the reporting<br />
organization at the end of the reporting period (i.e., the<br />
sum of all employees and supervised workers as defined<br />
above).<br />
Worker<br />
Generic term for any person performing work, regardless<br />
of the contractual relationship.<br />
Employee<br />
Indicator Protocols Set: LA<br />
An individual who is, according to national law or<br />
practices, recognized as an employee of the reporting<br />
organization.<br />
Supervised worker<br />
An individual who performs regular work on-site for, or on<br />
behalf of, the reporting organization but is not recognized<br />
as an employee under national law or practice.<br />
Independent contractor<br />
An individual legally recognized as being self-employed.<br />
Collective bargaining agreements<br />
There are two types of collective bargaining agreements,<br />
aimed either at employers or workers. Those aimed at<br />
employers are agreements in writing regarding working<br />
conditions and terms of employment concluded<br />
between an employer, a group of employers, or one or<br />
more employers’ organizations. Those aimed at workers<br />
are agreements between one or more representative<br />
workers’ organizations, or, in the absence of such<br />
organizations, the representatives of the workers duly<br />
elected and authorized by them in accordance with<br />
national laws and regulations.<br />
Employee categories<br />
General breakdown of employees based on the function<br />
or department within the organization (e.g., senior<br />
management, middle management, professional, technical,<br />
administrative, production, maintenance, etc.) derived from<br />
an organization’s own human resources system.<br />
General References<br />
• ILO Convention 135, ‘Workers’ Representatives<br />
Convention’, 1971.<br />
• ILO Convention 87, ‘Freedom of Association and<br />
Protection of the Right to Organise’, 1948.<br />
• ILO Convention 98, ‘Right to Organise and<br />
Collective Bargaining’, 1949.<br />
• ILO Declaration on Fundamental Principles and<br />
Rights at Work, 1998.<br />
• ILO Decent Work Agenda, 1999.<br />
• ILO Tripartite Declaration Concerning Multinationals<br />
and Social Policy, 1977, amended 2000.<br />
IP<br />
&<br />
EUSS<br />
EU<br />
Version 3.0/EUSS Final Version<br />
3
IP<br />
&<br />
EUSS<br />
Indicator Protocols Set: LA<br />
• OECD Principles of Corporate Governance, 2004.<br />
• OECD Guidelines for Multinational Enterprises,<br />
Revision 2000.<br />
• United Nations Millennium Declaration, 2000.<br />
EU<br />
4<br />
© 2000-2009 GRI
<strong>Electric</strong> Utility <strong>Sector</strong> <strong>Supplement</strong><br />
EU14: Programs and processes to ensure<br />
the availability of a skilled workforce.<br />
1. Relevance<br />
The operation of electrical utilities relies on large<br />
numbers of highly skilled workers. These workers are<br />
called upon to perform highly technical tasks which<br />
require specialized skills, and mental and physical<br />
readiness. Maintaining a highly skilled workforce is<br />
essential to the sustainability and reliability of the utility’s<br />
services upon which societies depend, and to ensure the<br />
safety of the workforce, equipment and operations, and<br />
the community. Often, the training (both formal and<br />
on-the-job) required to perform these jobs take years<br />
to acquire, therefore staff vacancies cannot be quickly or<br />
easily filled.<br />
Key issues include workforce retention, renewal and<br />
expansion. This is particularly important because of the<br />
global shortage and uneven demographic (including<br />
an aging of workforce) and geographic distribution of<br />
skills. Indeed in some cases, well-trained workers from<br />
less developed countries are often attracted to more<br />
industrialised countries to the detriment of their country<br />
of origin.<br />
Diversity is a key aspect of providing a skilled workforce<br />
as it widens the pool of potential talent available to<br />
electric utilities.<br />
Indicator Protocols Set: LA<br />
• Programs to attract and retain employees<br />
and include a reference to diversity including<br />
gender and race.<br />
3. Definitions<br />
None.<br />
4. Documentation<br />
This information can be obtained from Human Resources<br />
department.<br />
5. References<br />
None.<br />
EU<br />
IP<br />
&<br />
EUSS<br />
EU<br />
2. Compilation<br />
2.1 Report programs and processes including:<br />
• Program to assess skills needed in the<br />
workforce;<br />
• Training programmes including apprenticeship<br />
programs for new workers and specialised<br />
training on existing and new technologies for<br />
existing workers;<br />
• Ongoing higher education for qualified<br />
technical workers, for example electrical and<br />
mechanical engineers;<br />
• Training partnerships between utility and<br />
technical institutions to develop capacity;<br />
• The development of local employees when a<br />
utility is operating outside its national borders;<br />
• Programs to source workers from beyond<br />
national boundaries and country of origin<br />
recruitment policies and consideration of<br />
impact to the home country; and<br />
Version 3.0/EUSS Final Version<br />
5
IP<br />
&<br />
EUSS<br />
Indicator Protocols Set: LA<br />
EU15: Percentage of employees eligible<br />
to retire in the next 5 and 10 years<br />
broken down by job category and by<br />
region.<br />
1. Relevance<br />
Due to the critical nature of the <strong>Electric</strong> Utility industry<br />
and the fact that training in production, maintenance<br />
and distribution classifications can require as much<br />
as seven years, it is important for workforce planning<br />
purposes to assess how much of the workforce may<br />
be eligible for retirement in the foreseeable future.<br />
Furthermore, once employees become eligible for<br />
retirement, whatever their age, they become more<br />
vulnerable to recruitment by competitors in the industry.<br />
2. Compilation<br />
2.1 Identify assumptions around eligibility to retire by<br />
region.<br />
<strong>Electric</strong> Utility <strong>Sector</strong> <strong>Supplement</strong><br />
EU<br />
2.2 Identify job categories, these could include:<br />
• Line workers and splicers;<br />
• Power plant operators;<br />
• Engineers; and<br />
• Maintenance mechanics.<br />
2.3 Report the actual or estimated percentage of<br />
employees eligible to retire over the next 5 and<br />
10 year periods broken down by category and<br />
region.<br />
3. Definitions<br />
None.<br />
4. Documentation<br />
Human resources department.<br />
5. References<br />
None.<br />
EU<br />
6<br />
© 2000-2009 GRI
EU16: Policies and requirements<br />
regarding health and safety of<br />
employees and employees of contractors<br />
and subcontractors.<br />
1. Relevance<br />
Given that contractor and subcontractor employees may<br />
engage in high-risk activities, reporting organizations are<br />
expected to ensure that they are trained on health and<br />
safety issues (e.g. electrocution, falling objects, confined<br />
spaces, containers, etc) for their own protection. It is<br />
important to report on contractors and subcontractors<br />
since there is a trend in the electricity utility sector<br />
towards outsourcing work to third parties.<br />
This indicator does not directly address health and safety<br />
of the communities served, but relevant health and<br />
safety training of workers indirectly ensures health and<br />
safety of the surrounding communities.<br />
2. Compilation<br />
2.1 Identify policies on employee classification<br />
given health and safety training (e.g. employees,<br />
employees of contractors and subconctractors,<br />
office staff, plant workers, field workers, etc).<br />
2.2 Identify requirements of training provided (e.g.<br />
onsite, offsite, formal, informal, internal training,<br />
provided by external organisation, etc).<br />
2.3 Identify policies and requirements on health<br />
and safety programs to provide equipment for<br />
employees of all classes and the employees of<br />
contractors and subcontractors.<br />
2.4 Report the policies and requirements, including<br />
monitoring and compliance systems in place<br />
related to health and safety training of employees<br />
and employees of contractors and subcontractors.<br />
3. Definitions<br />
Contractor<br />
Indicator Protocols Set: LA<br />
Contractors are companies working onsite or offsite on<br />
behalf of the reporting organization with a relationship<br />
to the reporting organization determined by a contract.<br />
A contractor may hire their own staff directly and/or<br />
hire sub-contractors or independent contractors.<br />
Sub-contractor<br />
Sub-contractors are companies working onsite or offsite<br />
on behalf of the reporting organization and will have<br />
a direct contractual relationship with a contractor /<br />
sub-contractor but not necessarily with the reporting<br />
organization.<br />
A sub-contractor may hire their own staff directly or<br />
hire independent contractors.<br />
Independent contractor<br />
An independent contractor is an individual working<br />
for the reporting organization, a contractor, or a<br />
subcontractor who has a contract but is not a formal<br />
employee.<br />
4. Documentation<br />
This information can be obtained from Human<br />
Resources departments.<br />
5. References<br />
None.<br />
EU<br />
IP<br />
&<br />
EUSS<br />
EU<br />
Version 3.0/EUSS Final Version<br />
7
IP<br />
&<br />
EUSS<br />
EU<br />
Indicator Protocols Set: LA<br />
LA1 Total workforce by employment<br />
type, employment contract, and region.<br />
1. Relevance<br />
The size of a workforce provides insight into the scale<br />
of impacts created by labor issues. Breaking down the<br />
workforce by employment type, employment contract,<br />
and region (region refers to ‘country’ or ‘geographical<br />
area’) demonstrates how the organization structures<br />
its human resources to implement its overall strategy.<br />
It also provides insight into the organization’s business<br />
model, and offers an indication of job stability and the<br />
level of benefits the organization offers. As a basis for<br />
calculations in several other Indicators, the size of the<br />
workforce is a standard normalizing factor for many<br />
integrated Indicators. A rise or fall in net employment,<br />
evidenced by data reported over the course of three or<br />
more years, is an important element of the organization’s<br />
contribution to the overall economic development and<br />
sustainability of the workforce. 1<br />
2. Compilation<br />
2.1 Identify the total workforce (employees and<br />
supervised workers) working for the reporting<br />
organization at the end of the reporting period.<br />
Supply chain workers are not included in this<br />
Indicator.<br />
2.2 Identify the contract type and full-time and parttime<br />
status of employees based on the definitions<br />
under the national laws of the country where they<br />
are based.<br />
2.3 Combine country statistics to calculate global<br />
statistics and disregard differences in legal<br />
definitions. Although the definitions of what<br />
constitutes types of contract and a full-time or<br />
part-time employment relationship may vary<br />
between countries, the global figure will still reflect<br />
the relationships under law.<br />
2.4 Report the total workforce broken down by<br />
employees and supervised workers.<br />
2.5 If a substantial portion of the organization’s work is<br />
performed by workers who are legally recognized<br />
as self-employed, or by individuals other than<br />
employees or supervised workers, this should be<br />
reported.<br />
1<br />
See GRI Guidelines on expectations regarding reporting of<br />
multiple years’ data.<br />
2.6 Report the total number of employees broken<br />
down by type of employment contract.<br />
2.7 Report the total number of permanent employees<br />
broken down by employment type.<br />
2.8 Report the total workforce broken down by region,<br />
using a geographic breakdown based on the scale<br />
of the organization’s operations.<br />
2.9 If applicable, explain any significant seasonal<br />
variations in employment numbers (e.g., in the<br />
tourism or agricultural industries).<br />
2.10 Report on total contractor workforce (contractor,<br />
subcontractor, independent contractor) by<br />
employment type, employment contract and<br />
regulatory regime.<br />
3. Definitions<br />
Employment types<br />
Full time: A ‘full-time employee’ is defined according to<br />
national legislation and practice regarding working time<br />
(e.g., national legislation defines that ‘full-time’ means a<br />
minimum of nine months per year and a minimum of 30<br />
hours per week).<br />
Part-time: A ‘part-time employee’ is an employee whose<br />
working hours per week, month, or year are less than ‘full<br />
time’ as defined above.<br />
Employment Contract<br />
An employment contract as recognized under national<br />
law or practice that may be written, verbal, or implicit<br />
(i.e., when all the characteristics of employment are<br />
present but without a written or witnessed verbal<br />
contract).<br />
Indefinite or Permanent Contract:<br />
A permanent contract of employment is a contract<br />
with an employee for full-time or part-time work for an<br />
indeterminate period.<br />
Fixed Term or Temporary Contract:<br />
A fixed term contract is a contract of employment as<br />
defined above that ends when a specific time period<br />
expires, or when a specific task that has a time estimate<br />
attached is completed.<br />
A temporary contract of employment is of limited<br />
duration and terminated by a specific event, including<br />
the end of a project or work phase, return of replaced<br />
personnel, etc.<br />
EU<br />
8<br />
© 2000-2009 GRI
<strong>Electric</strong> Utility Indicator <strong>Sector</strong> <strong>Supplement</strong><br />
Protocols Set: LA<br />
IP<br />
&<br />
EUSS<br />
Contractor<br />
Contractors are companies working onsite or offsite on<br />
behalf of the reporting organization with a relationship<br />
to the reporting organization determined by a contract.<br />
A contractor may hire their own staff directly and/or hire<br />
sub-contractors or independent contractors.<br />
Sub-contractor<br />
Sub-contractors are companies working onsite or offsite<br />
on behalf of the reporting organization and will have<br />
a direct contractual relationship with a contractor /<br />
sub-contractor but not necessarily with the reporting<br />
organization.<br />
EU<br />
A sub-contractor may hire their own staff directly or hire<br />
independent contractors.<br />
Independent contractor<br />
An independent contractor is an individual working<br />
for the reporting organization, a contractor, or a<br />
subcontractor who has a contract but is not a formal<br />
employee.<br />
4. Documentation<br />
Payroll information available at the national or site level<br />
should provide data for this Indicator.<br />
EU<br />
5. References<br />
• ILO: International Classification of Status in<br />
Employment.<br />
• ILO: Key Indicators of the Labour Market.<br />
• ILO: LABORSTA Internet Indicators.<br />
• United Nations: World Macro Regions and<br />
Components.<br />
Version 3.0/EUSS Final Version<br />
9
IP<br />
&<br />
EUSS<br />
Indicator Protocols Set: LA<br />
LA2 Total number and rate of employee<br />
turnover by age group, gender, and<br />
region.<br />
1. Relevance<br />
A high turnover rate can indicate levels of uncertainty<br />
and dissatisfaction among employees, or may signal<br />
a fundamental change in the structure of the<br />
organization’s core operations. An uneven pattern of<br />
turnover by age or gender can indicate incompatibility<br />
or potential inequity in the workplace. Turnover results<br />
in changes to the human and intellectual capital of the<br />
organization and can impact productivity. Turnover<br />
has direct cost implications either in terms of reduced<br />
payroll or greater expenses for recruitment of workers.<br />
Employment net creation can be estimated using the<br />
data reported under Indicator LA1.<br />
2. Compilation<br />
2.1 Identify the total number of employees leaving<br />
employment during the reporting period.<br />
5. References<br />
None.<br />
EU<br />
2.2 Report the total number and rate of employees<br />
leaving employment during the reporting period,<br />
broken down by gender, age group (e.g., 50), and region.<br />
Rates should be calculated using the total<br />
employee numbers at the end of the reporting<br />
period.<br />
2.3 For the employees leaving employment during<br />
the reporting period, provide the average length<br />
of tenure of employees leaving broken down by<br />
gender and age group.<br />
EU<br />
3. Definitions<br />
Turnover<br />
Number of employees who leave the organization<br />
voluntarily or due to dismissal, retirement, or death in<br />
service.<br />
4. Documentation<br />
Potential sources of information include payroll<br />
information available at the national or site level.<br />
Operational plans and restatements of the organization’s<br />
key strategic targets may provide explanations for large<br />
variations in this figure.<br />
10<br />
© 2000-2009 GRI
<strong>Electric</strong> Utility <strong>Sector</strong> <strong>Supplement</strong><br />
EU17: Days worked by contractor and<br />
subcontractor employees involved in<br />
construction, operation & maintenance<br />
activities<br />
1. Relevance<br />
<strong>Electric</strong> utility companies sometimes employ contractors<br />
and subcontractors to carry out work for either economic<br />
reasons, to cover peak demand (i.e. during maintenance),<br />
due to lack of available staff or a lack of particular skill<br />
sets. A reliance on contractors and subcontractors can<br />
result in issues related to:<br />
• Lack of management control of high risk activities;<br />
• Safety of contractor and subcontractor employees;<br />
and<br />
• Reliability of operations.<br />
Construction, maintenance and operation activities are<br />
important for electricity utility companies.<br />
They are most likely to impact on the reliability of<br />
service and also present the highest risk to safety of<br />
employees and society. This indicator describes the<br />
reliance of the reporting organization on contractors and<br />
subcontractors.<br />
2. Compilation<br />
2.1 Identify and state which jobs are performed by<br />
contractors and subcontractors, for example:<br />
• Distribution and transmission line worker;<br />
• Splicer;<br />
• Substation operators and mechanics;<br />
• Operators and auxiliary operators;<br />
• Plant Mechanic (incl. Nuclear plant mechanics);<br />
• Welders;<br />
• Machinists;<br />
• Technicians;<br />
• Engineer; and<br />
• <strong>Electric</strong>ian.<br />
• Construction activities;<br />
• Operation activities; and<br />
• Maintenance activities.<br />
3. Definitions<br />
Contractor<br />
Indicator Protocols Set: LA<br />
Contractors are companies working onsite or offsite on<br />
behalf of the reporting organization with a relationship<br />
to the reporting organisation determined by a contract.<br />
A contractor may hire their own staff directly and/or hire<br />
sub-contractors or independent contractors.<br />
Sub-contractor<br />
Sub-contractors are companies working onsite or offsite<br />
on behalf of the reporting organisation and will have<br />
a direct contractual relationship with a contractor /<br />
sub-contractor but not necessarily with the reporting<br />
organization.<br />
A sub-contractor may hire their own staff directly or hire<br />
independent contractors.<br />
Independent contractor<br />
An independent contractor is an individual working<br />
for the reporting organisation, a contractor, or a<br />
subcontractor who has a contract but is not a formal<br />
employee.<br />
Full Time Equivalent Days<br />
‘Full time equivalent days’ is defined as the total number<br />
of hours worked by employees of contractors and<br />
subcontractors in a calendar year divided by 8.<br />
4. Documentation<br />
Human Resources Department.<br />
5. References<br />
LA 1<br />
EU<br />
IP<br />
&<br />
EUSS<br />
EU<br />
2.2 Report an estimate, based on the contract terms<br />
or actual time worked, full time equivalent<br />
days worked by contractor and subcontractor<br />
employees on electric utility systems, (generation,<br />
distribution, transmission) broken down by:<br />
Version 3.0/EUSS Final Version<br />
11
IP<br />
&<br />
EUSS<br />
EU<br />
Indicator Protocols Set: LA<br />
EU18: Percentage of contractor and<br />
subcontractor employees that have<br />
undergone relevant health and safety<br />
training<br />
1. Relevance<br />
This indicator reports specifically on health and safety<br />
training for contractor and subcontractor employees.<br />
This is one element of health and safety management,<br />
LA7 gives more information on reporting topics around<br />
rates of injuries.<br />
Given that contractor and subcontractor employees may<br />
engage in high-risk activities, reporting organizations are<br />
expected to ensure that they are trained on health and<br />
safety issues (e.g., electrocution, falling objects, confined<br />
spaces, containers, etc) for their own protection.<br />
This indicator does not directly address health and safety<br />
of the communities served, but relevant health and<br />
safety training of workers indirectly ensures health and<br />
safety of the surrounding communities.<br />
2. Compilation<br />
2.1 Training programmes reported in this section<br />
should be equivalent to the training that the<br />
electric utility gives its own employees, or that<br />
meets national international or industry standards.<br />
Sub-contractor<br />
Sub-contractors are companies working onsite or offsite<br />
on behalf of the reporting organisation and will have<br />
a direct contractual relationship with a contractor /<br />
sub-contractor but not necessarily with the reporting<br />
organization.<br />
A sub-contractor may hire their own staff directly or hire<br />
independent contractors.<br />
Independent contractor<br />
An independent contractor is an individual working<br />
for the reporting organisation, a contractor, or a<br />
subcontractor who has a contract but is not a formal<br />
employee.<br />
4. Documentation<br />
Information may be obtained through Human Resources<br />
department; management information systems, health<br />
and safety department, safety audit results, procurement<br />
department.<br />
5. References<br />
None.<br />
<strong>Electric</strong> Utility <strong>Sector</strong> <strong>Supplement</strong><br />
EU<br />
2.2 Report the total number of contractor and<br />
subcontractor employees (broken into the<br />
categories given in EU17 Section 2.1) that have<br />
undergone health and safety training.<br />
2.3 Report this value as a percentage of the<br />
total number of contractor employees and<br />
subcontractor employees (including independent<br />
contractor) in each category.<br />
3. Definitions<br />
Contractor<br />
Contractors are companies working onsite or offsite on<br />
behalf of the reporting organization with a relationship<br />
to the reporting organisation determined by a contract.<br />
A contractor may hire their own staff directly and/or hire<br />
sub-contractors or independent contractors.<br />
12<br />
© 2000-2009 GRI
LA3 Benefits provided to full-time<br />
employees that are not provided to<br />
temporary or part-time employees, by<br />
major operations.<br />
1. Relevance<br />
Data reported under this Indicator provides a measure<br />
of the organization’s investment in human resources and<br />
the minimum benefits it offers its full time employees.<br />
The quality of benefits for full-time staff is a key factor<br />
in retaining employees. The Indicator also offers an<br />
indication of the relative investment in different parts of<br />
the workforce.<br />
2. Compilation<br />
2.1 Identify benefits offered to all employees.<br />
2.2 Report which of the following benefits are standard<br />
for full-time employees of the organization but are<br />
not provided to temporary or part-time employees,<br />
by major operations:<br />
• Life insurance;<br />
• Health care;<br />
• Disability/invalidity coverage;<br />
• Maternity/paternity leave;<br />
• Retirement provision;<br />
• Stock ownership; and<br />
• Others.<br />
2.3 Standard benefits refer to those typically offered<br />
to at least the majority of full-time employees. This<br />
should not be interpreted as being offered to every<br />
single full-time employee of the organization. The<br />
intention of the Indicator is to disclose what fulltime<br />
employees can reasonably expect.<br />
3. Definitions<br />
Benefits<br />
This refers to either direct benefit provided in the form<br />
of financial contributions, care paid for by the reporting<br />
organization, or the reimbursement of expenses borne<br />
by the employee. Redundancy payments over and<br />
above legal minimums, lay-off pay, extra employment<br />
injury benefit, survivors’ benefits, and extra paid holiday<br />
entitlements could also be included under this Indicator.<br />
In-kind benefits such as provision of sports or child day<br />
Indicator Protocols Set: LA<br />
care facilities, free meals during working time, and<br />
similar general employee welfare programs are excluded<br />
from this Indicator.<br />
4. Documentation<br />
Potential sources of information include local or central<br />
collective agreements, which may provide examples of<br />
benefits paid beyond legal minimums. Other reference<br />
tools may include benefits summaries, employee<br />
orientation/commencement materials, and employee<br />
contracts.<br />
5. References<br />
• ILO Convention 102, ‘Social Security<br />
(Minimum Standards) Convention’, 1952.<br />
• ILO Convention 121, ‘Employment Injury Benefits<br />
Convention’, 1964.<br />
• ILO Convention 128, ‘Invalidity, Old-Age and<br />
Survivors’ Benefits Convention’, 1967.<br />
• ILO Convention 130, ‘Medical Care and Sickness<br />
Benefits Convention’, 1969.<br />
• ILO Convention 132, ‘Holidays with Pay Convention<br />
(Revised)’ 1970.<br />
• ILO Convention 140, ‘Paid Educational Leave<br />
Convention’, 1974.<br />
• ILO Convention 157, ‘Maintenance of Social<br />
Security Rights’, 1982.<br />
• ILO Convention 168, ‘Employment Promotion and<br />
Protection against Unemployment Convention’,<br />
1988.<br />
• ILO Convention 183, ‘Maternity Protection<br />
Convention’, 2000.<br />
• OECD Guidelines for Multinational Enterprises,<br />
Revision 2000.<br />
IP<br />
&<br />
EUSS<br />
EU<br />
Version 3.0/EUSS Final Version<br />
13
IP<br />
&<br />
EUSS<br />
Indicator Protocols Set: LA<br />
LA4 Percentage of employees covered<br />
by collective bargaining agreements.<br />
1. Relevance<br />
A contractor may hire their own staff directly and/or hire<br />
sub-contractors or independent contractors.<br />
Sub-contractor<br />
<strong>Electric</strong> Utility <strong>Sector</strong> <strong>Supplement</strong><br />
Freedom of association is a human right as defined by<br />
international declarations and conventions, particularly<br />
ILO Core Conventions 87 & 98. Collective bargaining<br />
is an important form of stakeholder engagement and<br />
particularly relevant for reporting guidelines. It is a form<br />
of stakeholder engagement that helps build institutional<br />
frameworks and is seen by many as contributing to a<br />
stable society. Together with corporate governance,<br />
collective bargaining is part of an overall framework<br />
that contributes to responsible management. It is an<br />
instrument used by parties to facilitate collaborative<br />
efforts to enhance the positive social impacts of an<br />
organization. The percentage of employees covered by<br />
collective bargaining agreements is the most direct way<br />
to demonstrate an organization’s practices in relation to<br />
freedom of association.<br />
2. Compilation<br />
2.1 Use data from LA1 as the basis for calculating<br />
percentages for this Indicator.<br />
Sub-contractors are companies working onsite or offsite<br />
on behalf of the reporting organization and will have<br />
a direct contractual relationship with a contractor /<br />
sub-contractor but not necessarily with the reporting<br />
organization.<br />
A sub-contractor may hire their own staff directly or hire<br />
independent contractors.<br />
Independent contractor<br />
An independent contractor is an individual working<br />
for the reporting organization, a contractor, or a<br />
subcontractor who has a contract but is not a formal<br />
employee.<br />
4. Documentation<br />
Records of formal recognition agreements and signed<br />
collective agreements with independent trade unions<br />
will normally be held by the human resources or<br />
personnel department of the reporting organization.<br />
EU<br />
EU<br />
2.2 Binding collective bargaining agreements include<br />
those signed by the reporting organization itself or<br />
by employer organizations of which it is a member.<br />
These agreements can be at the sector, national,<br />
regional, organizational, or workplace level.<br />
2.3 Identify the total number of employees covered by<br />
collective bargaining agreements.<br />
2.4 Report the percentage of total employees covered<br />
by collective bargaining agreements.<br />
2.5 Report on percentage of contractor employees<br />
(contractor, sub-contractor and independent<br />
contractor) working for the reporting organization<br />
covered by collective bargaining agreements by<br />
country or regulatory regime.<br />
3. Definitions<br />
EU<br />
5. References<br />
• ILO Convention 87, ‘Freedom of Association and<br />
Protection of the Right to Organise’, 1948.<br />
• ILO Convention 98, ‘Right to Organise and<br />
Collective Bargaining’, 1949.<br />
• ILO Convention 135, ‘Workers’ Representatives<br />
Convention’, 1971.<br />
• ILO Convention 154, ‘Collective Bargaining<br />
Convention’, 1981 and Recommendations 91,<br />
‘Collective Agreements Recommendation’ 1951,<br />
and 163, ‘Collective Bargaining Recommendation’,<br />
1981.<br />
• ILO Declaration on Fundamental Principles and<br />
Rights at Work, 86th Session, 1998, Article 2 (a).<br />
Contractor<br />
Contractors are companies working onsite or offsite on<br />
behalf of the reporting organization with a relationship<br />
to the reporting organization determined by a contract.<br />
EU<br />
• OECD Guidelines for Multinational Enterprises,<br />
Section IV, Paragraph 2 (a).<br />
14<br />
© 2000-2009 GRI
LA5 Minimum notice period(s) regarding<br />
significant operational changes,<br />
including whether it is specified in<br />
collective agreements.<br />
1. Relevance<br />
This Indicator provides insight into an organization’s<br />
practice of ensuring timely discussion of significant<br />
operational changes, and engaging with its employees<br />
and their representatives to negotiate and implement<br />
these changes (which may have positive or negative<br />
implications for workers). Timely and effective<br />
consultation with workers and other relevant parties,<br />
where practicable (such as with governmental<br />
authorities), helps to minimize any adverse impacts from<br />
operating changes on workers and related communities.<br />
Minimum notice period(s) are an Indicator of an<br />
organization’s ability to maintain employee satisfaction<br />
and motivation while implementing significant<br />
changes to operations. This Indicator also allows an<br />
assessment of an organization’s consultation practices<br />
in relation to expectations expressed in relevant<br />
international norms. Consultative practices that result<br />
in good industrial relations can help provide positive<br />
working environments, reduce turnover, and minimize<br />
operational disruptions.<br />
2. Compilation<br />
2.1 Report the minimum number of weeks notice<br />
typically provided to employees and their elected<br />
representatives prior to the implementation<br />
of significant operational changes that could<br />
substantially affect them.<br />
4. Documentation<br />
Indicator Protocols Set: LA<br />
Agreements specific to the organization will provide data<br />
for this Indicator.<br />
5. References<br />
• Declaration concerning the aims and purposes of<br />
the International Labour Organisation (Declaration<br />
of Philadelphia), 1944 - Annex to the ILO<br />
Constitution – Articles I (a) and III (e).<br />
• ILO Convention 158, ‘Termination of Employment<br />
Convention’, 1982.<br />
• ILO Tripartite Declaration of Principles Concerning<br />
Multinational Enterprises and Social Policy, 1997.<br />
• ILO Recommendation 94, ‘Co-operation at the<br />
Level of the Undertaking Recommendation’, 1952.<br />
• ILO Recommendation 135, ‘Workers’<br />
Representatives’ Convention’, 1971.<br />
• OECD Guidelines for Multinational Companies,<br />
Revision 2000, Article IV, (2) & (3).<br />
• OECD Principles of Corporate Governance, 2004<br />
(notably Article IV, C, D & E).<br />
IP<br />
&<br />
EUSS<br />
EU<br />
2.2 For organizations with collective bargaining<br />
agreements, report whether the notice period and/<br />
or provisions for consultation and negotiation are<br />
specified in collective agreements.<br />
3. Definitions<br />
Significant operational changes<br />
Alterations to the reporting organization’s pattern<br />
of operations that will have substantial positive or<br />
negative consequences for its employees. Such changes<br />
may include, for example, restructuring, outsourcing<br />
of operations, closures, expansions, new openings,<br />
takeovers, sale of all or part of the organization, or<br />
mergers.<br />
Version 3.0/EUSS Final Version<br />
15
IP<br />
&<br />
EUSS<br />
EU<br />
Indicator Protocols Set: LA<br />
LA6 Percentage of total workforce<br />
represented in formal joint managementworker<br />
health and safety committees<br />
that help monitor and advise on<br />
occupational health and safety programs.<br />
1. Relevance<br />
A health and safety committee with joint representation<br />
can facilitate a positive health and safety culture. The use<br />
of committees is one way to involve workers in driving<br />
the improvement of occupational health and safety in<br />
the workplace. This Indicator provides one measure of<br />
the extent to which the workforce is actively involved in<br />
health and safety.<br />
2. Compilation<br />
2.1 Identify formal health and safety committees that<br />
help monitor and advise on occupational safety<br />
programs at the facility level or higher with joint<br />
management/labor representation. ‘Formal’ refers<br />
to committees whose existence and function<br />
are integrated in the reporting organization’s<br />
organizational and authority structure, and that<br />
operate according to certain agreed, written rules.<br />
2.2 Report the percentage of the total workforce<br />
represented in formal joint management-worker<br />
health and safety committees:<br />
4. Documentation<br />
Potential sources of information include organizational<br />
procedures and minutes of occupational health & safety<br />
committee(s).<br />
5. References<br />
• ILO Convention 155, ‘Occupational Safety and<br />
Health Convention’ and Protocol 155, 1981.<br />
• ILO Convention 161, ‘Occupational Health Services<br />
Convention’, 1985.<br />
• None;<br />
• Up to 25%;<br />
• Between 25% and 50%;<br />
• Between 50% and 75%; and<br />
• Over 75%.<br />
2.3 Report the level(s) at which the committee(s)<br />
typically operates (e.g., at facility level and/or at<br />
multi-facility, region, group, or company levels). This<br />
may either be a result of a formal policy, procedure,<br />
or informal practice within the organization.<br />
3. Definitions<br />
None.<br />
16<br />
© 2000-2009 GRI
<strong>Electric</strong> Utility <strong>Sector</strong> <strong>Supplement</strong><br />
LA7 Rates of injury, occupational<br />
diseases, lost days, and absenteeism, and<br />
total number of work-related fatalities by<br />
region.<br />
1. Relevance<br />
Health and safety performance is a key measure of an<br />
organization’s duty of care. Low injury and absentee<br />
rates are generally linked to positive trends in staff morale<br />
and productivity. This Indicator will show whether health<br />
and safety management practices are resulting in fewer<br />
occupational health and safety incidents. Some electric<br />
utility workers engage in high-risk activities. This work can<br />
be equally high risk for contractors and subcontractors.<br />
2. Compilation<br />
2.1 This Indicator should provide a regional<br />
breakdown for the following:<br />
• The total workforce (i.e., total employees plus<br />
supervised workers); and<br />
• Independent contractors working on-site to<br />
whom the reporting organization is liable for<br />
the general safety of the working environment.<br />
2.2 Since some reporting organizations include minor<br />
(first-aid level) injuries in their data, indicate<br />
whether such injuries are included or excluded.<br />
EU<br />
• Occupational diseases rate (ODR)<br />
• Lost day rate (LDR)<br />
• Absentee rate (AR)<br />
Indicator Protocols Set: LA<br />
Note: The factor 200,000 is derived from 50<br />
working weeks @ 40 hours per 100 employees.<br />
By using this factor, the resulting rate is related to<br />
the number of employees, not the number of hours.<br />
2.5 Report fatalities in the reporting period using an<br />
absolute number, not a rate.<br />
2.6 Report the system of rules applied in recording<br />
and reporting accident statistics. The ‘ILO Code<br />
of Practice on Recording and Notification of<br />
Occupational Accidents and Diseases’ was<br />
developed for the reporting, recording, and<br />
notification of workplace accidents. Where<br />
national law follows the ILO recommendations, it is<br />
sufficient to state that fact and that practice follows<br />
the law. In situations where national law does not<br />
comply, indicate which system of rules it applies<br />
and their relationship to the ILO code.<br />
3. Definitions<br />
Injury<br />
A non-fatal or fatal injury arising out of or in the course<br />
of work.<br />
IP<br />
&<br />
EUSS<br />
EU<br />
2.3 Report on health and safety performance of<br />
contractors and subcontractors working onsite or<br />
on behalf of the reporting organization off site.<br />
2.4 In calculating ‘lost days’ indicate:<br />
• Whether ‘days’ means ‘calendar days’ or<br />
‘scheduled work days’; and<br />
• At what point the ‘lost days’ count begins (e.g., the<br />
day after the accident or 3 days after the accident).<br />
2.5 Report injury, occupational diseases, lost days, and<br />
absentee rates in the reporting period using the<br />
following formulas by region:<br />
• Injury rate (IR)<br />
Total # of injuries<br />
IR=<br />
x 200,000<br />
Total hours worked<br />
Note: The injury rate should capture fatalities.<br />
EU<br />
Injury rate<br />
The frequency of injuries relative to the total time<br />
worked by the total workforce in the reporting period.<br />
Occupational disease<br />
A disease arising from the work situation or activity (e.g.,<br />
stress or regular exposure to harmful chemicals), or from<br />
a work-related injury.<br />
Occupational disease rate<br />
The frequency of occupational diseases relative to the<br />
total time worked by the total workforce in the reporting<br />
period.<br />
Lost day<br />
Time (‘days’) that could not be worked (and is thus<br />
‘lost’) as a consequence of a worker or workers being<br />
unable to perform their usual work because of an<br />
occupational accident or disease. A return to limited<br />
duty or alternative work for the same organization does<br />
not count as lost days.<br />
Version 3.0/EUSS Final Version<br />
17
IP<br />
&<br />
EUSS<br />
Indicator Protocols Set: LA<br />
Lost day rate<br />
The impact of occupational accidents and diseases as<br />
reflected in time off work by the affected workers. It<br />
is expressed by comparing the total lost days to the<br />
total number of hours scheduled to be worked by the<br />
workforce in the reporting period.<br />
Absentee<br />
An employee absent from work because of incapacity<br />
of any kind, not just as the result of work-related injury<br />
or disease. Permitted leave absences such as holidays,<br />
study, maternity/paternity, and compassionate leave are<br />
excluded.<br />
Absentee rate<br />
Refers to a measure of actual absentee days lost as<br />
defined above, expressed as a percentage of total days<br />
scheduled to be worked by the workforce for the same<br />
period.<br />
Fatality<br />
The death of a worker occurring in the current<br />
reporting period, arising from an occupational injury or<br />
disease sustained or contracted while in the reporting<br />
organization’s employ.<br />
EU<br />
4. Documentation<br />
Employee records, employee contracts, attendance<br />
records, and accident records will provide relevant data<br />
for this Indicator.<br />
5. References<br />
• ILO Convention 155, ‘Occupational Health & Safety<br />
Convention’ and Protocol 155, 1981.<br />
• ILO Code of Practice on Recording and Notification<br />
of Occupational Accidents and Diseases, 1995.<br />
• ILO Guidelines on Occupational Safety and Health<br />
Management Systems, 2001.<br />
18<br />
© 2000-2009 GRI
LA8 Education, training, counseling,<br />
prevention, and risk-control programs<br />
in place to assist workforce members,<br />
their families, or community members<br />
regarding serious diseases.<br />
1. Relevance<br />
As part of a preventative strategy for managing the<br />
health and safety of its workforce, this Indicator is<br />
relevant for any organization. It also has specific<br />
relevance for organizations working in countries with<br />
a high risk or incidence of communicable diseases,<br />
and those in professions that have a high incidence<br />
of specific diseases. The Indicator helps demonstrate<br />
the extent to which such issues have been addressed<br />
in organizational programs and the degree to which<br />
best practices are applied. Preventing serious diseases<br />
contributes to the health, satisfaction, and stability of the<br />
workforce, and helps maintain the organization’s social<br />
license to operate in a community or region.<br />
2. Compilation<br />
2.1 Report the programs related to assisting workforce<br />
members, their families, or community members<br />
regarding serious diseases using the table below:<br />
Assistance Programs<br />
Serious diseases<br />
Indicator Protocols Set: LA<br />
Occupational or non-occupational related impairment of<br />
health with serious consequences for employees, their<br />
families, and communities, such as HIV/AIDS, diabetes,<br />
RSI, and stress.<br />
4. Documentation<br />
Potential sources of information include organizational<br />
policies and operating procedures, minutes of internal<br />
occupational health committee(s), and human resource<br />
and health center records.<br />
5. References<br />
• GRI Cross-Reference: <strong>Reporting</strong> Guidance on<br />
HIV/AIDS: A GRI Resource Document. LA8 is<br />
a standard Indicator relevant for HIV/AIDS.<br />
<strong>Reporting</strong> organizations operating in areas with<br />
high prevalence should consider expanding<br />
their reporting on this issue and can view the GRI<br />
Resource Document for examples.<br />
IP<br />
&<br />
EUSS<br />
EU<br />
Education/<br />
Training<br />
Counseling<br />
Prevention/<br />
Risk Control<br />
Treatment<br />
Program<br />
recipients<br />
Yes No Yes No Yes No Yes No<br />
Workers<br />
Workers’<br />
families<br />
Community<br />
members<br />
2.2 Report whether there are workers who are<br />
involved in occupational activities who have<br />
a high incidence or high risk of specific diseases.<br />
3. Definitions<br />
Risk control<br />
Practices that seek to limit exposure and transmission of<br />
diseases.<br />
Version 3.0/EUSS Final Version<br />
19
IP<br />
&<br />
EUSS<br />
Indicator Protocols Set: LA<br />
LA9 Health and safety topics covered in<br />
formal agreements with trade unions.<br />
1. Relevance<br />
This Indicator demonstrates one of the ways in which<br />
the health and safety of the workforce is ensured.<br />
Formal agreements can promote the acceptance of<br />
responsibilities by both parties and the development of a<br />
positive health and safety culture. This Indicator will reveal<br />
the extent to which the workforce is actively involved in<br />
formal, labor-management agreements that determine<br />
health and safety management arrangements.<br />
2. Compilation<br />
2.1 Report whether formal agreements (either local or<br />
global) with trade unions cover health and safety.<br />
(Yes/No)<br />
3. Definitions<br />
Formal agreements<br />
Written documents signed by both parties declaring<br />
a mutual intention to abide by what is contained in<br />
the documents. These can include, for example, local<br />
collective bargaining agreements as well as national and<br />
international framework agreements.<br />
4. Documentation<br />
Potential sources of information include collective<br />
agreements with trade unions.<br />
5. References<br />
• ILO Convention 155, ‘Occupational Safety and<br />
Health Convention’ and its Protocol 155, 1981.<br />
2.2 If yes, report the extent to which various health<br />
and safety topics are covered by local and global<br />
agreements signed by the organization.<br />
Agreements at the local level typically address<br />
topics such as:<br />
EU<br />
• Personal protective equipment;<br />
• Joint management-employee health and safety<br />
committees;<br />
• Participation of worker representatives in<br />
health and safety inspections, audits, and<br />
accident investigations;<br />
• Training and education;<br />
• Complaints mechanism;<br />
• Right to refuse unsafe work; and<br />
• Periodic inspections.<br />
Agreements at the global level typically address<br />
topics such as:<br />
• Compliance with the ILO;<br />
• Arrangements or structures for resolving<br />
problems; and<br />
• Commitments regarding target performance<br />
standards or level of practice to apply.<br />
20<br />
© 2000-2009 GRI
LA10 Average hours of training per year<br />
per employee by employee category.<br />
1. Relevance<br />
Maintaining and improving human capital, particularly<br />
through training that expands the knowledge base<br />
of employees, is a key element in organizational<br />
development. This Indicator provides insight into the<br />
scale of the organization’s investment in this area and the<br />
degree to which the investment is made across the entire<br />
employee base. Access to training opportunities can also<br />
support progress in other areas of social performance,<br />
such as ensuring equal opportunity in the workplace.<br />
It also contributes to motivating improvement at the<br />
personal and organizational level.<br />
2. Compilation<br />
2.1 Identify the total number of employees in each<br />
employment category across the organization’s<br />
operations at the end of the reporting year (e.g.,<br />
senior management, middle management,<br />
professional, technical, administrative, production,<br />
maintenance, etc.). The organization should define<br />
employment categories based on its human<br />
resources system.<br />
Training does not include on-site coaching by<br />
supervisors.<br />
4. Documentation<br />
Indicator Protocols Set: LA<br />
Potential sources of information include employee<br />
records and training schedules.<br />
5. References<br />
• ILO Convention 142, ‘Human Resources<br />
Development Convention’, 1975.<br />
• ILO Convention 140, ‘Paid Educational Leave<br />
Convention’, 1974.<br />
• ILO Convention 155, ‘Occupational Safety and<br />
Health Convention’, 1981.<br />
• OECD Guidelines for Multinational Enterprises,<br />
Revision 2000, Articles II, 4 & IV, 2 (c), 3 & 5.<br />
IP<br />
&<br />
EUSS<br />
2.2 Identify total hours devoted to training personnel<br />
within each employee category.<br />
EU<br />
2.3 Report the average number of hours of training per<br />
year per employee by employee category using<br />
the following formula:<br />
LA10 =<br />
Total hours per employee category<br />
Total employees per employee<br />
3. Definitions<br />
Training<br />
Refers to:<br />
• All types of vocational training and instruction;<br />
• Paid educational leave provided by the reporting<br />
organization for its employees;<br />
• Training or education pursued externally and<br />
paid for in whole or in part by the reporting<br />
organization; and<br />
• Training on specific topics such as health and safety.<br />
Version 3.0/EUSS Final Version<br />
21
IP<br />
&<br />
EUSS<br />
EU<br />
Indicator Protocols Set: LA<br />
LA11 Programs for skills management<br />
and lifelong learning that support the<br />
continued employability of employees and<br />
assist them in managing career endings.<br />
1. Relevance<br />
Programs for skills management allow organizations to<br />
plan skills acquisitions that will equip employees to meet<br />
strategic targets in a changing work environment. A more<br />
skilled and aware workforce enhances the organization’s<br />
human capital and contributes to employee satisfaction,<br />
which correlates strongly with improved performance. For<br />
those facing retirement, confidence and quality of work<br />
relations is improved by the knowledge that they will be<br />
supported in their transition from work to retirement. The<br />
goal of lifelong learning is to promote the development<br />
of knowledge and competencies that will enable each<br />
citizen to adapt to a rapidly-changing labor market and to<br />
participate actively in all spheres of economic life.<br />
2. Compilation<br />
2.1 Do employee training or assistance programs to<br />
upgrade skills provide any of the following?<br />
• Internal training courses;<br />
• Funding support for external training or<br />
education; and<br />
• The provision of sabbatical periods with<br />
guaranteed return to employment.<br />
3. Definitions<br />
Continued employability<br />
Adaptation to the changing demands of the workplace<br />
through the acquisition of new skills.<br />
Career endings<br />
Retirement by reaching statutory national retiring age<br />
or termination in the face of restructuring.<br />
Skills management<br />
Policies and programs that focus on developing<br />
employees’ skills to meet the evolving strategic needs<br />
of the organization and/or the industry.<br />
Lifelong learning<br />
Acquiring and updating abilities, knowledge,<br />
qualifications, and interests throughout life, from preschool<br />
years to post-retirement.<br />
4. Documentation<br />
Potential sources of information include organizational<br />
procedures for termination and employee records.<br />
5. References<br />
• ILO Convention 142, ‘Human Resources<br />
Development Convention’, 1975.<br />
• ILO Convention 168, ‘Employment Promotion and<br />
Protection against Unemployment Convention’,<br />
1988.<br />
2.2 Do transition assistance programs to support<br />
employees who are retiring or who have been<br />
terminated provide any of the following:<br />
• Pre-retirement planning for intended retirees;<br />
• Retraining for those intending to continue<br />
working;<br />
• Severance pay;<br />
• If severance pay is provided, does it take into<br />
account employee age and years of service;<br />
• Job placement services; and<br />
• Assistance (e.g., training, counseling) on<br />
transitioning to a non-working life.<br />
22<br />
© 2000-2009 GRI
LA12 Percentage of employees receiving<br />
regular performance and career<br />
development reviews.<br />
1. Relevance<br />
Appraising employee performance against<br />
common targets aids the personal development of<br />
individual employees and contributes to both skills<br />
management and the development of human capital<br />
within the organization. Employee satisfaction can<br />
also be enhanced, which correlates with improved<br />
organizational performance. This Indicator indirectly<br />
demonstrates how the reporting organization works<br />
to monitor and maintain the skill sets of its employees.<br />
When reported in conjunction with LA12, the Indicator<br />
helps illustrate how the organization approaches skills<br />
enhancement. The percentage of employees receiving<br />
regular performance and career development reviews<br />
demonstrates the extent to which this system is applied<br />
throughout the organization.<br />
2. Compilation<br />
2.1 Identify the total number of employees. The total<br />
number of employees should match that reported<br />
under LA1.<br />
2.2 Report the percentage of total employees who<br />
received a formal performance appraisal and<br />
review during the reporting period.<br />
Indicator Protocols Set: LA<br />
IP<br />
&<br />
EUSS<br />
EU<br />
3. Definitions<br />
Regular performance and career development<br />
review<br />
Performance targets and reviews are based on criteria<br />
known to the employee and his/her superior. This review<br />
is undertaken with the knowledge of the employee at<br />
least once per year. It can include an evaluation by the<br />
employee’s direct superior, peers, or a wider range of<br />
employees. The review may also involve personnel from<br />
the human resources department.<br />
4. Documentation<br />
Potential sources of information include personnel<br />
records.<br />
5. References<br />
• ILO Convention 142, ‘Human Resources<br />
Development’, 1975.<br />
Version 3.0/EUSS Final Version<br />
23
IP<br />
&<br />
EUSS<br />
EU<br />
Indicator Protocols Set: LA<br />
LA13 Composition of governance<br />
bodies and breakdown of employees per<br />
category according to gender, age group,<br />
minority group membership, and other<br />
indicators of diversity.<br />
1. Relevance<br />
This Indicator provides a quantitative measure of diversity<br />
within an organization and can be used in conjunction<br />
with sectoral or regional benchmarks. The level of diversity<br />
within an organization provides insights into the human<br />
capital of the organization. Comparisons between broad<br />
workforce diversity and management team diversity<br />
also offer information on equal opportunity. Detailed<br />
information on the composition of the workforce can<br />
also help in assessing which issues may be of particular<br />
relevance to certain segments of the workforce.<br />
2. Compilation<br />
2.1 Identify the diversity Indicators used by the<br />
reporting organization in its own monitoring and<br />
recording that may be relevant for reporting.<br />
2.2 Identify the total number of employees<br />
in each employee category (e.g., board,<br />
senior management, middle management,<br />
administrative, production, etc.). Categories of<br />
employment should be defined based on the<br />
reporting organization’s own human resources<br />
system. The total number of employees should<br />
match that reported in LA1.<br />
2.3 Report the percentage of employees in each of the<br />
following categories: (% of employees)<br />
• Gender: Female / Male<br />
• Minority groups<br />
• Age groups: Under 30 years old, 30-50 years<br />
old, over 50 years old<br />
2.4 Report the percentage of individuals within the<br />
organization’s governance bodies (e.g., the board<br />
of directors, management committee, or similar<br />
body for non-corporate reporting organizations) in<br />
each of the following categories:<br />
(% of Individuals within Governance Bodies)<br />
• Gender: Female / Male<br />
• Minority groups<br />
• Age groups: Under 30 years old, 30-50 years<br />
old, over 50 years old<br />
3. Definitions<br />
Governance bodies<br />
The committees or boards responsible for the strategic<br />
guidance of the organization, the effective monitoring of<br />
management, and the accountability of management to<br />
the broader organization and its stakeholders.<br />
Indicators of diversity<br />
Indicators for which the reporting organization gathers<br />
data may include, for example, citizenship, ancestry and<br />
ethnic origin, creed, and disability.<br />
4. Documentation<br />
Potential sources of information include employee<br />
records and minutes of equal opportunity committees.<br />
5. References<br />
• Convention on the Elimination of All Forms of<br />
Discrimination Against Women: UN GA: Resolution<br />
34/180 of 18 December 1979.<br />
• Declaration on the Elimination of All Forms of<br />
Intolerance and of Discrimination based on<br />
Religion or Belief: UN GA: Resolution 36/55 of 26<br />
November 1981.<br />
• Declaration on Race and Racial Prejudice: General<br />
Conference UNESCO 20th session on 27 November<br />
1978.<br />
• Declaration on the Rights of Persons Belonging<br />
to National or Ethnic, Religious and Linguistic<br />
Minorities: UN GA Resolution 47/135 of 18<br />
December 1992.<br />
• ILO Tripartite Declaration of Principles Concerning<br />
Multinational Enterprises and Social Policy: Art. 21,<br />
22, 23, 1977.<br />
• ILO Declaration on Fundamental Principles and<br />
Rights at Work, 1998.<br />
• ILO Convention concerning Discrimination in<br />
Respect of Employment and Occupation, 1958<br />
(No.111).<br />
24<br />
© 2000-2009 GRI
Indicator Protocols Set: LA<br />
IP<br />
&<br />
EUSS<br />
• International Convention on the Elimination of All<br />
Forms of Racial Discrimination of 4 January 1969.<br />
• OECD Guidelines for Multinational Enterprises,<br />
Revision 2000 (Employment and Industrial<br />
Relations Section).<br />
• United Nations <strong>Global</strong> Compact: Principle 6,<br />
26 July 2000.<br />
• United Nations Declaration on the Elimination<br />
of All Forms of Racial Discrimination: UN GA<br />
Resolution 1904 (XVlll) of 20 November 1963.<br />
EU<br />
Version 3.0/EUSS Final Version<br />
25
IP<br />
&<br />
EUSS<br />
Indicator Protocols Set: LA<br />
LA14 Ratio of basic salary of men to<br />
women by employee category.<br />
1. Relevance<br />
Many countries have introduced legislation to enforce<br />
the principle of equal pay for work of equal value. This<br />
issue is supported by ILO Convention 100 on ‘Equal<br />
Remuneration for Men and Women Workers for Work<br />
of Equal Value’. Equality of remuneration is a factor<br />
in retaining qualified candidates in the workforce.<br />
Where imbalances exist, an organization runs a risk<br />
to its reputation and legal challenges on the basis of<br />
discrimination.<br />
2. Compilation<br />
2.1 Identify the total number of employees in<br />
each employee category across the reporting<br />
organization’s operations, broken down by gender<br />
using the information from LA13. Employee<br />
categories should be defined based on the<br />
reporting organization’s own human resources<br />
system. The total number of employees should<br />
match that reported in LA1.<br />
4. Documentation<br />
Sources of information for this Indicator include<br />
employee and payment records.<br />
5. References<br />
• ILO Convention 100, ‘Equal Remuneration for Men<br />
and Women Workers for Work of Equal Value’, 1951.<br />
• ILO Convention 111, ‘Discrimination in Respect of<br />
Employment and Occupation’, 1958.<br />
• ILO Declaration on Fundamental Principles and<br />
Rights at Work, 1998.<br />
EU<br />
2.2 Identify the basic salary for women and for men in<br />
each employee category.<br />
2.3 Any convenient pay period (e.g., hourly, weekly,<br />
monthly, or annually) may be used for this data.<br />
2.4 Report the ratio of the basic salary of women to the<br />
basic salary of men for each employee category.<br />
3. Definitions<br />
Basic Salary<br />
A fixed, minimum amount paid to an employee for<br />
performing his/her duties. This does not include any<br />
additional remuneration such as that based on years of<br />
service, overtime work, bonuses, benefit payments, or any<br />
additional allowances (e.g., transportation allowances).<br />
26<br />
© 2000-2009 GRI
EU<br />
Indicator Protocols Set<br />
Human Rights (HR)<br />
© 2000-2011 GRI Version 3.0/EUSS Final Version
Human Rights<br />
Performance Indicators<br />
Aspect: Investment and Procurement Practices<br />
Aspect: Forced and Compulsory Labor<br />
Indicator Protocols Set: HR<br />
IP<br />
&<br />
EUSS<br />
Co r e<br />
HR1<br />
Percentage and total number of significant<br />
investment agreements that include human<br />
rights clauses or that have undergone human<br />
rights screening.<br />
Co r e<br />
HR7<br />
Operations identified as having significant<br />
risk for incidents of forced or compulsory<br />
labor, and measures taken to contribute to the<br />
elimination of forced or compulsory labor.<br />
Co r e<br />
A d d<br />
HR2<br />
HR3<br />
Percentage of significant suppliers and<br />
contractors that have undergone screening<br />
on human rights and actions taken.<br />
Total hours of employee training on policies<br />
and procedures concerning aspects of<br />
human rights that are relevant to operations,<br />
including the percentage of employees<br />
trained.<br />
Aspect: Non-discrimination<br />
Aspect: Security Practices<br />
A d d<br />
HR8<br />
Percentage of security personnel trained<br />
in the organization’s policies or procedures<br />
concerning aspects of human rights that are<br />
relevant to operations.<br />
Aspect: Indigenous Rights<br />
A d d<br />
HR9<br />
Total number of incidents of violations<br />
involving rights of indigenous people and<br />
actions taken.<br />
Co r e<br />
HR4<br />
Total number of incidents of discrimination<br />
and actions taken.<br />
Aspect: Freedom of Association and Collective<br />
Bargaining<br />
Co r e<br />
HR5<br />
Operations identified in which the right to<br />
exercise freedom of association and collective<br />
bargaining may be at significant risk, and<br />
actions taken to support these rights.<br />
EU<br />
Co r e<br />
See<br />
<strong>Sector</strong> Specific Commentary in Protocol.<br />
EU<br />
Aspect: Child Labor<br />
Co r e<br />
HR6<br />
Operations identified as having significant<br />
risk for incidents of child labor, and measures<br />
taken to contribute to the elimination of child<br />
labor.<br />
Version 3.0/EUSS Final Version<br />
1
IP<br />
&<br />
EUSS<br />
Indicator Protocols Set: HR<br />
Relevance<br />
Human Rights Performance Indicators elicit disclosures<br />
on the impacts and activities an organization has on the<br />
civil and political human rights of its stakeholders. The<br />
Aspects within these Performance Indicators are based<br />
on internationally recognized standards, primarily the<br />
United Nations Universal Declaration of Human Rights<br />
and the ILO Declaration on the Fundamental Principles<br />
and Rights at Work of 1998 (in particular the eight Core<br />
Conventions of the ILO). Although closely related, the<br />
categories of Human Rights and Labor Practices serve<br />
different purposes. Human Rights Indicators focus<br />
on how the reporting organization maintains and<br />
respects the basic rights of a human being, whereas the<br />
Indicators on Labor Practices reflect the quality of the<br />
work and the working environment.<br />
The Performance Indicators seek to provide comparable<br />
measures of results or outcomes, and therefore focus<br />
primarily on incidents relating to core human rights.<br />
Incidents typically include ‘points of impact’ on<br />
stakeholder groups as well as risks for the organization<br />
where violations have occurred. The Indicator set<br />
addresses three general areas:<br />
4. ILO Declaration on Fundamental Principles and<br />
Rights at Work, 1998 (in particular the eight Core<br />
Conventions of the ILO).<br />
5. Vienna Declaration and Programme of Action, 1993.<br />
General References<br />
• ILO Declaration on Fundamental Principles and<br />
Rights at Work, 1998.<br />
• ILO Tripartite Declaration Concerning<br />
Multinational Enterprises and Social Policy, 2001,<br />
Third Edition.<br />
• <br />
• <br />
OECD Guidelines for Multinational Enterprises,<br />
Revision 2000.<br />
United Nations Universal Declaration of Human<br />
Rights, 1948.<br />
• ILO Convention (169) concerning Indigenous and<br />
Tribal Peoples in Independent Countries, 1989.<br />
EU<br />
• Incidents related to basic aspects of human rights (HR4<br />
and HR9);<br />
• The capacity and knowledge enabling the organization<br />
to effectively address human rights, including training<br />
and internal procedures (HR3, HR5, HR6, HR7, and HR8);<br />
and<br />
• The organization’s integration of human rights into<br />
its external business relationships either through<br />
investments or suppliers (HR1 and HR2).<br />
Definitions<br />
Human rights<br />
Generally recognized human rights are defined by the<br />
following five conventions and declarations:<br />
1. United Nations Universal Declaration of Human<br />
Rights, 1948.<br />
2. United Nations Convention: International Covenant<br />
on Civil and Political Rights, 1966.<br />
3. United Nations Convention: International Covenant<br />
on Economic, Social and Cultural Rights, 1966.<br />
2<br />
© 2000-2009 GRI
HR1 Percentage and total number of<br />
significant investment agreements that<br />
include human rights clauses or that<br />
have undergone human rights screening.<br />
1. Relevance<br />
This measure is one indication of the extent to which<br />
human rights are integrated in an organization’s<br />
economic decisions. This is particularly relevant for<br />
organizations that operate within or are partners in<br />
ventures in regions where the protection of human<br />
rights is of significant concern. Integrating human<br />
rights criteria in screening or including human rights<br />
in performance requirements can be part of a strategy<br />
to reduce the risks of investment. Problems with<br />
an organization’s human rights record can result in<br />
reputational damage for the investing organization and<br />
can affect the stability of investments.<br />
2. Compilation<br />
2.1 Count only the agreements that are significant<br />
in terms of size or strategic importance. The<br />
significance may be determined by the level<br />
of approval required within the organization<br />
for the investment or other criteria that can be<br />
consistently applied to agreements. The reporting<br />
organization should disclose their definition of<br />
“significant agreements”.<br />
3. Definitions<br />
Human rights clauses<br />
Indicator Protocols Set: HR<br />
Specific terms in a written agreement that define<br />
minimum expectations of performance with respect to<br />
human rights as a requirement for investment.<br />
Human rights screening<br />
A formal or documented process that applies a set of<br />
human rights performance criteria as one of the factors<br />
in determining whether to proceed with an investment.<br />
4. Documentation<br />
Potential information sources include the reporting<br />
organization’s legal, investor relations, and financial<br />
departments, as well as documentation collected<br />
through quality management systems.<br />
5. References<br />
None.<br />
IP<br />
&<br />
EUSS<br />
EU<br />
2.2 Identify the total number of significant investment<br />
agreements finalized during the reporting period<br />
that either moved the organization into a position<br />
of ownership in another entity or initiated a capital<br />
investment project that was material to financial<br />
accounts.<br />
2.3 If multiple significant investment agreements are<br />
undertaken with the same partner, the number<br />
of the agreements should reflect the number of<br />
separate projects undertaken or entities created.<br />
2.4 Report the total number and percentage of<br />
significant investment agreements that include<br />
human rights clauses or that underwent human<br />
rights screening.<br />
Version 3.0/EUSS Final Version<br />
3
IP<br />
&<br />
EUSS<br />
Indicator Protocols Set: HR<br />
HR2 Percentage of significant suppliers<br />
and contractors that have undergone<br />
screening on human rights and actions<br />
taken.<br />
1. Relevance<br />
The development of extensive networks of suppliers<br />
and contractors to produce products and services has<br />
generated interest in how reporting organizations apply<br />
their human rights policies to their supply networks. This<br />
is particularly relevant for organizations in sectors that<br />
rely heavily on outsourcing and global networks.<br />
Processes that screen and monitor human rights<br />
performance within the supply chain can provide<br />
evidence of an organization’s positive impact on the<br />
wider business community. Issues with human rights<br />
performance on the part of significant suppliers<br />
and contractors can result in reputational damage<br />
for their business partners and/or create instability<br />
in the suppliers’ operations. Screening is part of risk<br />
management, and the percentage indicated here<br />
indicates how regularly an organization takes this<br />
particular risk into consideration.<br />
• Identified as having the highest risk of incidents<br />
related to human rights.<br />
4. Documentation<br />
Potential information sources include the reporting<br />
organization’s procurement or purchasing and legal<br />
departments.<br />
5. References<br />
None.<br />
EU<br />
2. Compilation<br />
2.1 Identify the total number of the reporting<br />
organization’s significant suppliers and contractors.<br />
2.2 Report the percentage of contracts with significant<br />
suppliers and contractors that included criteria or<br />
screening on human rights. See HR1 for definitions<br />
of ‘criteria’ or ‘screening’.<br />
2.3 Report the percentage of contracts with significant<br />
suppliers and contractors that were either declined<br />
or imposed performance conditions, or were<br />
subject to other actions as a result of human rights<br />
screening.<br />
3. Definitions<br />
Significant suppliers and contractors<br />
External parties from whom products or services are<br />
obtained or with whom contracts are concluded for the<br />
provision of such products and services. In the context<br />
of this Indicator, ‘significant’ refers to suppliers and<br />
contractors who are:<br />
• The primary providers of a given type of good or<br />
service and overall comprise the majority of the<br />
organization’s purchases; or<br />
4<br />
© 2000-2009 GRI
HR3 Total hours of employee training<br />
on policies and procedures concerning<br />
aspects of human rights that are relevant<br />
to operations, including the percentage<br />
of employees trained.<br />
1. Relevance<br />
Information generated from this Indicator offers insight<br />
into an organization’s capacity to implement its human<br />
rights policies and procedures. Human rights have<br />
become well-established in international standards and<br />
laws, and this has obligated organizations to implement<br />
specialized training that equips employees to address<br />
human rights in the course of their regular work. The<br />
number of employees trained and the amount of<br />
training they receive both contribute to an assessment<br />
of an organization’s depth of knowledge about human<br />
rights.<br />
2. Compilation<br />
2.1 Identify the total number of hours devoted to<br />
employee training, using data from LA10.<br />
3. Definitions<br />
None<br />
4. Documentation<br />
Indicator Protocols Set: HR<br />
Potential sources of information include employee<br />
records of training and training schedules.<br />
5. References<br />
None.<br />
IP<br />
&<br />
EUSS<br />
2.2 Identify the total number of employees, using data<br />
from LA1.<br />
2.3 Identify employees who have received formal<br />
training in the organization’s policies and<br />
procedures on human rights issues and their<br />
applicability to the employees’ work. This can<br />
refer either to training dedicated to the topic of<br />
human rights or to a human rights module within<br />
a general training program.<br />
EU<br />
2.4 Report the total number of hours in the reporting<br />
period devoted to training on policies and<br />
procedures concerning aspects of human rights<br />
that are relevant to operations.<br />
2.5 Report the percentage of employees in the<br />
reporting period trained in policies and procedures<br />
concerning aspects of human rights that are<br />
relevant to operations.<br />
Version 3.0/EUSS Final Version<br />
5
IP<br />
&<br />
EUSS<br />
EU<br />
Indicator Protocols Set: HR<br />
HR4 Total number of incidents of<br />
discrimination and actions taken.<br />
1. Relevance<br />
Human rights extend beyond the rights of employees<br />
in the workplace. Anti-discrimination policy is a key<br />
requirement of international conventions and social<br />
legislation and guidelines. The issue of discrimination<br />
is also addressed by ILO Core Conventions 100 & 111.<br />
An effective monitoring system is necessary to ensure<br />
compliance throughout the reporting organization’s<br />
operations. Stakeholders will seek assurance that such<br />
policies and monitoring are effective.<br />
2. Compilation<br />
2.1 Identify incidents of discrimination on grounds of<br />
race, color, sex, religion, political opinion, national<br />
extraction, or social origin as defined by the ILO,<br />
or other relevant forms of discrimination involving<br />
internal and/or external stakeholders across<br />
operations in the reporting period.<br />
‘Incidents’ refer to legal actions, complaints<br />
registered with the organization or competent<br />
authorities through a formal process, or instances<br />
of non-compliance identified by the organization<br />
through established procedures such as<br />
management system audits or formal monitoring<br />
programs.<br />
2.2 Report the total number of incidents of<br />
discrimination during the reporting period.<br />
2.3 Report the status of the incidents and the actions<br />
taken with reference to the following:<br />
• Organization has reviewed the incident;<br />
• Remediation plan is being implemented;<br />
• Remediation plan has been implemented<br />
and results reviewed through routine internal<br />
management review processes; and<br />
• Incident is no longer subject to action (i.e.,<br />
resolved, case completed, no further by action<br />
by company, etc.).<br />
3. Definitions<br />
Discrimination<br />
The act and the result of treating a person unequally by<br />
imposing unequal burdens or denying benefits rather<br />
than treating the person fairly on the basis of individual<br />
merit. Discrimination can also include harassment,<br />
defined as a course of comments or actions that are<br />
unwelcome, or should reasonably be known to be<br />
unwelcome, to the person towards whom they are<br />
addressed.<br />
4. Documentation<br />
Potential information sources include the reporting<br />
organization’s legal and compliance departments.<br />
5. References<br />
• Declaration on the Elimination of All Forms of<br />
Intolerance and of Discrimination based on<br />
Religion or Belief, UN General Assembly Resolution<br />
36/55 of 26 November 1981.<br />
• Declaration on Race and Racial Prejudice: General<br />
Conference UNESCO 20th session on 27 November<br />
1978.<br />
• Declaration on the Rights of Persons Belonging<br />
to National or Ethnic, Religious and Linguistic<br />
Minorities: UN GA Resolution 47/135 of 18<br />
December 1992.<br />
• ILO Convention 100, ‘Equal Remuneration<br />
Convention’, 1951.<br />
• ILO Convention 111, ‘Discrimination in Respect of<br />
Employment and Occupation Convention’, 1958.<br />
• International Convention on Civil and Political<br />
Rights: GA Resolution 2200 A XX1 of 16 December<br />
1966.<br />
• International Convention on the Elimination of All<br />
Forms of Racial Discrimination GA Resolution 1904<br />
(XV111) of 20 November 1963.<br />
• United Nations Convention on the Elimination of<br />
all forms of Discrimination Against Women: UN,<br />
GA: Resolution 34/180 of 18 December 1979.<br />
• United Nations Declaration on the Elimination of<br />
All Forms of Racial Discrimination: GA Resolution<br />
1904 (XVlll) of 20 November 1963.<br />
6<br />
© 2000-2009 GRI
<strong>Electric</strong> Utility <strong>Sector</strong> <strong>Supplement</strong><br />
HR5 Operations identified in which the<br />
right to exercise freedom of association<br />
or collective bargaining may be at<br />
significant risk, and actions taken to<br />
support these rights.<br />
1. Relevance<br />
Inherent in the right to freedom of association and<br />
collective bargaining is the protection of the right of<br />
workers (and employers) to organize collectively in<br />
organizations of their own choice. The Right to Freedom<br />
of Association is a fundamental provision of the UN<br />
Universal Declaration of Human Rights and is defined by<br />
ILO Core Conventions 87 & 98.<br />
This Indicator aims to reveal actions that the<br />
reporting organization has taken to evaluate whether<br />
opportunities exist for workers to exercise their rights<br />
to freedom of association and collective bargaining.<br />
It also aims to reveal actions that have been taken to<br />
support these rights across the organization’s range of<br />
operations. This Indicator does not require the reporting<br />
organization to express a specific opinion on the quality<br />
of national legal systems.<br />
2. Compilation<br />
2.1 Identify operations in which employee rights<br />
to exercise freedom of association or collective<br />
bargaining may be at risk. The process of<br />
identification should reflect the organization’s<br />
approach to risk assessment on this issue and<br />
can draw from recognized international data<br />
sources such as ILO reports (yearly report of ILO<br />
Committee of Experts on the implementation of<br />
ratified conventions and recommendations, as well<br />
as the Governing Body’s reports on freedom of<br />
association).<br />
2.2 Report operations identified in which employee<br />
rights to exercise freedom of association or collective<br />
bargaining may be at risk either in terms of:<br />
• Type of operations (e.g., manufacturing plant);<br />
or<br />
Indicator Protocols Set: HR<br />
2.3 Report on any measures taken by the organization<br />
in the reporting period intended to support rights<br />
to freedom of association and collective<br />
bargaining. See the ILO Tripartite Declaration and<br />
OECD Guidelines for further guidance.<br />
2.4 Report on management mechanisms to address<br />
the right to organize, right to bargain and right to<br />
strike or instances of lock out, given the context of<br />
the industry’s need to ensure continuous provision<br />
of essential services. Where the right to strike does<br />
not exist or is limited, report on remedial measures<br />
such as binding arbitration. Where freedom of<br />
association or expression are limited or prevented<br />
by regulatory regime, report on mechanisms and<br />
processes that exist for getting employee input on<br />
conditions of employment.<br />
3. Definitions<br />
Freedom of association<br />
Workers and employers may establish and join<br />
organizations of their own choosing without the need<br />
for prior authorization.<br />
4. Documentation<br />
Potential information sources include the reporting<br />
organization’s legal, compliance, and human resources<br />
departments.<br />
5. References<br />
• ILO Convention 87, ‘Freedom of Association and<br />
Protection of the Right to Organise Convention’,<br />
1948.<br />
• ILO Convention 98, ‘Right to Organise and<br />
Collective Bargaining Convention’, 1949<br />
• United Nations Universal Declaration of Human<br />
Rights, 1948.<br />
• International Covenant on Economic, Social and<br />
Cultural Rights, 1966.<br />
EU<br />
IP<br />
&<br />
EUSS<br />
EU<br />
• Countries or geographical areas with<br />
operations considered at risk.<br />
Version 3.0/EUSS Final Version<br />
7
IP<br />
&<br />
EUSS<br />
EU<br />
Indicator Protocols Set: HR<br />
HR6 Operations identified as having<br />
significant risk for incidents of child<br />
labor, and measures taken to contribute<br />
to the elimination of child labor.<br />
1. Relevance<br />
The abolition of child labor is a key principle and<br />
objective of major human rights declarations and<br />
legislation, and is subject to ILO Conventions 138 and<br />
182. The presence and effective implementation of<br />
policies on child labor are a basic expectation of socially<br />
responsible conduct.<br />
2. Compilation<br />
2.1 Identify operations considered to have significant<br />
risk for incidents of:<br />
• Child labor; and/or<br />
• Young workers exposed to hazardous work.<br />
The process of identification should reflect the<br />
organization’s approach to risk assessment on this<br />
issue and can draw from recognized international<br />
data sources such as ILO reports.<br />
2.2 Report operations considered to have significant<br />
risk for incidents of child labor either in terms of:<br />
and consultation with representative organizations of<br />
employers and workers.<br />
Note: ILO Convention 138 refers to both child labor and<br />
young workers. See below for the definition of ‘young<br />
worker’.<br />
Young worker<br />
A person who is above the applicable minimum working<br />
age and younger than 18 years of age.<br />
4. Documentation<br />
Potential information sources include the reporting<br />
organization’s legal, compliance, and human resources<br />
departments.<br />
5. References<br />
• ILO Convention 138, ‘Minimum Age Convention’,<br />
1973.<br />
• ILO Convention 182, ‘Worst Forms of Child Labour<br />
Convention’, 1999.<br />
• ILO Declaration on Fundamental Principles and<br />
Rights at Work, 86th Session, 1998.<br />
• Type of operations (e.g., manufacturing plant);<br />
or<br />
• Countries or geographical areas with<br />
operations considered at risk.<br />
2.3 Report on any measures taken by the organization<br />
in the reporting period intended to contribute to<br />
the elimination of child labor. See the ILO Tripartite<br />
Declaration and OECD Guidelines for further<br />
guidance.<br />
3. Definitions<br />
Child<br />
This term applies to all persons under the age of 15 years<br />
or under the age of completion of compulsory schooling<br />
(whichever is higher), except in certain countries where<br />
economies and educational facilities are insufficiently<br />
developed and a minimum age of 14 years might apply.<br />
These countries of exception are specified by the ILO in<br />
response to special application by the country concerned<br />
8<br />
© 2000-2009 GRI
HR7 Operations identified as having<br />
significant risk for incidents of forced or<br />
compulsory labor, and measures taken<br />
to contribute to the elimination of forced<br />
or compulsory labor.<br />
1. Relevance<br />
Not to be subjected to forced or compulsory labor<br />
is considered a fundamental human right and is a<br />
provision of the UN Universal Declaration of Human<br />
Rights and subject to ILO Core Conventions 29 & 105.<br />
This type of labor can exist in a variety of forms and the<br />
data provided will indicate the reporting organization’s<br />
challenges in contributing to the abolition of forced and<br />
compulsory labor.<br />
2. Compilation<br />
2.1 Identify operations considered to have significant<br />
risk for incidents of forced or compulsory labor.<br />
The process of identification should reflect the<br />
organization’s approach to risk assessment on this<br />
issue and can draw from recognized international<br />
data sources such as ILO reports.<br />
2.2 Report operations considered to have significant<br />
risk for incidents of compulsory labor either in<br />
terms of:<br />
• Type of operations (e.g. manufacturing plant);<br />
or<br />
Indicator Protocols Set: HR<br />
deposits, or compelling workers, under threat of firing,<br />
to work extra hours to which they have not previously<br />
agreed, are all examples of forced labor.<br />
4. Documentation<br />
Potential information sources include the reporting<br />
organization’s legal, compliance, and human resources<br />
departments.<br />
5. References<br />
• ILO Conventions 29, ‘Forced Labour Convention’,<br />
1930.<br />
• ILO Convention 105, ‘Abolition of Forced Labour’,<br />
1957.<br />
• League of Nations (later UN) Slavery Convention,<br />
1927.<br />
• United Nations <strong>Supplement</strong>ary Convention on<br />
the Abolition of Slavery, the Slave Trade, and<br />
Institutions and Practices Similar to Slavery, 226<br />
U.N.T.S.3, 1957.<br />
• Universal Declaration of Human Rights (United<br />
Nations General Assembly Resolution 217 A (III) of<br />
10 December 1948), Articles 4 & 5.<br />
• ILO Declaration on Fundamental Principles and<br />
Rights at Work, 86th Session, 1998.<br />
IP<br />
&<br />
EUSS<br />
EU<br />
• Countries or geographical areas with<br />
operations considered at risk.<br />
2.3 Report on any measures taken by the organization<br />
in the reporting period intended to contribute to<br />
the elimination of forced or compulsory labor. See<br />
the ILO Tripartite Declaration and OECD Guidelines<br />
for further guidance.<br />
3. Definitions<br />
Forced or compulsory labor<br />
All work and service which is exacted from any person<br />
under the menace of any penalty and for which the<br />
said person has not offered her/himself voluntarily (ILO<br />
Convention 29, Forced Labour Convention, 1930). The<br />
most extreme examples are slave labor, prison labor,<br />
and bonded labor, but debts can also be used as a<br />
means of maintaining workers in a state of forced labor.<br />
Withholding identity papers, requiring compulsory<br />
Version 3.0/EUSS Final Version<br />
9
IP<br />
&<br />
EUSS<br />
EU<br />
Indicator Protocols Set: HR<br />
HR8 Percentage of security personnel<br />
trained in the organization’s policies<br />
or procedures concerning aspects<br />
of human rights that are relevant to<br />
operations.<br />
1. Relevance<br />
The conduct of security personnel towards third parties<br />
is underpinned by their training in human rights<br />
issues, particularly regarding the use of force. Training<br />
security personnel can help prevent reputational<br />
and litigation risks arising from inappropriate actions<br />
or approaches not condoned by the reporting<br />
organization. Information provided under this Indicator<br />
helps to demonstrate the extent to which management<br />
systems pertaining to human rights are implemented.<br />
This measure indicates the proportion of the security<br />
force that can reasonably be assumed to be aware<br />
of the organization’s expectations of human rights<br />
performance.<br />
2. Compilation<br />
2.1 Identify the total number of security personnel the<br />
reporting organization employs directly.<br />
2.2 Report the percentage of security personnel who<br />
have received formal training in the organization’s<br />
policies on, or specific procedures for, human<br />
rights issues and their application to security.<br />
This can refer either to training dedicated to the<br />
topic or a module within a more general training<br />
program.<br />
5. References<br />
• Commentary on the Norms on the Responsibilities<br />
of Transnational Corporations and Other Business<br />
Enterprises with Regard to Human Rights U.N.<br />
Doc. E/CN.4/ Sub.2/2003/38/Rev.2 (2003) Section C<br />
Right to security of persons para 4.<br />
• ILO Convention 29, ‘Forced Labour Convention’,<br />
1930.<br />
• ILO Convention 105, ‘Abolition of Forced Labour<br />
Convention’, 1957.<br />
2.3 Report whether training requirements also apply<br />
to third party organizations providing security<br />
personnel.<br />
3. Definitions<br />
Security personnel<br />
Individuals employed for the purposes of guarding<br />
property of the organization, crowd control, loss<br />
prevention, and escorting persons, goods, and valuables.<br />
4. Documentation<br />
Potential information sources include the reporting<br />
organization’s human resources department and<br />
training records received by internal security personnel.<br />
Contractors may hold similar information with respect to<br />
their employees.<br />
10<br />
© 2000-2009 GRI
HR9 Total number of incidents of<br />
violations involving rights of indigenous<br />
people and actions taken.<br />
1. Relevance<br />
The number of recorded incidents involving the rights<br />
of indigenous peoples provides information about the<br />
implementation of an organization’s policies relating<br />
to indigenous peoples. This information will help<br />
indicate the state of relations with these stakeholder<br />
communities, particularly in regions where indigenous<br />
people reside or have interests near operations of<br />
the reporting organization. The information also<br />
provides an additional entry point for support groups.<br />
ILO Conventions 107 and 169 address the rights of<br />
indigenous peoples.<br />
2. Compilation<br />
2.1 Identify incidents involving indigenous rights<br />
among the organization’s own employees, and<br />
in communities near existing operations that are<br />
likely to be affected by planned or proposed future<br />
operations of the reporting organization.<br />
‘Incidents’ refer to legal actions, complaints<br />
registered with the organization or competent<br />
authorities through a formal process, or instances<br />
of non-compliance identified by the organization<br />
through established procedures such as<br />
management system audits or formal monitoring<br />
programs.<br />
3. Definitions<br />
Indigenous peoples<br />
Indicator Protocols Set: HR<br />
Indigenous peoples are those whose social, cultural,<br />
political, and economic conditions distinguish<br />
them from other sections of the dominant national<br />
community, or who are regarded as indigenous on<br />
account of their descent from the populations which<br />
inhabited the country, or a geographical region to<br />
which the country belongs, at the time of conquest<br />
or colonization or the establishment of present state<br />
boundaries and who, irrespective of their legal status,<br />
retain some or all of their own social, economic, cultural,<br />
and political institutions.<br />
4. Documentation<br />
Potential information sources include the reporting<br />
organization’s operating procedures and guidelines on<br />
the issue. Other information may be supplied by country<br />
managers and by legal specialists of the reporting<br />
organization. Data on indigenous people within the<br />
workforce may be obtainable from employee records.<br />
5. References<br />
• Charter of the United Nations, Preamble, San<br />
Francisco, 1945.<br />
• ILO Convention (107) Indigenous and Tribal<br />
Populations Convention, 1957.<br />
• ILO Convention (169) Concerning Indigenous and<br />
Tribal Peoples in Independent Countries, 1991.<br />
IP<br />
&<br />
EUSS<br />
EU<br />
2.2 Report the total number of identified incidents<br />
involving indigenous rights during the reporting<br />
period.<br />
2.3 Report the status of the incidents and actions taken<br />
with reference to the following:<br />
• Organization has reviewed the incident;<br />
• Remediation plan is being implemented;<br />
• Remediation plan has been implemented<br />
and results reviewed through routine internal<br />
management review processes; and<br />
• Incident is no longer subject to action (i.e.,<br />
resolved, case completed, no further by action<br />
by company, etc.).<br />
Version 3.0/EUSS Final Version<br />
11
EU<br />
Indicator Protocols Set<br />
Society (SO)<br />
© 2000-2011 GRI Version 3.0/EUSS Final Version
Society<br />
<strong>Electric</strong> <strong>Utilities</strong> <strong>Sector</strong> Specific<br />
Disclosures on Management<br />
Approach<br />
Indicator Protocols Set: SO<br />
IP<br />
&<br />
EUSS<br />
Aspect: Community<br />
Aspect: Public Policy<br />
CORE<br />
EU19.Stakeholder participation in the decision<br />
making process related to energy planning and<br />
infrastructure development.<br />
CORE<br />
SO5 Public policy positions and participation in<br />
public policy development and lobbying.<br />
CORE<br />
EU20. Approach to managing the impacts of<br />
displacement.<br />
Aspect: Disaster/Emergency Planning and<br />
Response<br />
EU<br />
A D D<br />
SO6<br />
contributions to political parties, politicians,<br />
and related institutions by country.<br />
Aspect: Anti-Competitive Behavior<br />
CO R E<br />
EU21.Contingency planning measures, disaster/<br />
emergency management plan and training<br />
programs, and recovery/restoration plans.<br />
A D D<br />
SO7 Total number of legal actions for anticompetitive<br />
behavior, anti-trust, and<br />
monopoly practices and their outcomes.<br />
Performance Indicators<br />
Aspect: Community<br />
CO R E<br />
Aspect: Compliance<br />
SO8<br />
number of non-monetary sanctions for noncompliance<br />
with laws and regulations.<br />
CO R E<br />
SO1 N<br />
programs and practices that assess and manage<br />
the impacts of operations on communities,<br />
including entering, operating, and exiting.<br />
EU<br />
CO R E<br />
See<br />
EU<br />
CO R E<br />
EU22<br />
Number of people physically or<br />
economically displaced and compensation<br />
broken down by type of project.<br />
EU<br />
Aspect: Corruption<br />
CO R E<br />
SO2 Percentage and total number of business<br />
units analyzed for risks related to corruption.<br />
CO R E<br />
SO3 Percentage of employees trained in<br />
organization’s anti-corruption policies and<br />
procedures.<br />
CORE<br />
SO4 Actions taken in response to incidents of<br />
corruption.<br />
Version 3.0/EUSS Final Version<br />
1
IP<br />
&<br />
EUSS<br />
EU<br />
Indicator Protocols Set: SO<br />
Relevance<br />
The categories of Labor, Human Rights, and Product<br />
Responsibility address social impacts associated with<br />
specific stakeholder groups (such as employees or<br />
customers). However, the social impacts of organizations<br />
are also linked to interactions with market structures and<br />
social institutions that establish the social environment<br />
within which stakeholder groups interact. These<br />
interactions, as well as the organization’s approach to<br />
dealing with social groups such as communities, represent<br />
an important component of sustainability performance.<br />
The Society Performance Indicators therefore focus on the<br />
impacts organizations have on the communities in which<br />
they operate, and how the organization’s interactions with<br />
other social institutions are managed and mediated. In<br />
particular, information is sought on bribery and corruption,<br />
involvement in public policy-making, monopoly practices,<br />
and compliance with laws and regulations other than labor<br />
and environmental.<br />
Definitions<br />
Corruption<br />
Corruption is ‘the abuse of entrusted power for private<br />
gain’ 1 and can be instigated by individuals in the public or<br />
private sector. It is interpreted here to include such corrupt<br />
practices as bribery, fraud, extortion, collusion, conflict of<br />
interest, and money laundering. In this context, it includes<br />
an offer or receipt of any gift, loan, fee, reward, or other<br />
advantage to or from any person as an inducement to do<br />
something that is dishonest, illegal, or a breach of trust in<br />
the conduct of the enterprise’s business. 2 This may include<br />
gifts other than money, such as free goods and holidays,<br />
or special personal services provided for the purpose of,<br />
or liable to result in, an improper advantage or that may<br />
result in moral pressure to receive such an advantage.<br />
General References<br />
• OECD Guidelines for Multinational Enterprises,<br />
Revision 2000.<br />
• OECD Convention on Combating Bribery of<br />
Foreign Public Officials in International<br />
Business Transactions, 1997.<br />
• OECD Principles of Corporate Governance, 2004.<br />
• Inter-American Convention Against Corruption, 1996.<br />
• United Nations Convention Against Corruption, 2003.<br />
1<br />
Transparency International<br />
2<br />
These definitions are based on ‘Business Principles for Countering<br />
Bribery’ which have been developed through a project managed<br />
by Transparency International.<br />
2<br />
© 2000-2009 GRI
<strong>Electric</strong> Utility <strong>Sector</strong> <strong>Supplement</strong><br />
EU19: Stakeholder participation in<br />
decision making processes related to<br />
energy planning and infrastructure<br />
development<br />
1. Relevance<br />
Most electric utility markets are made up of a few large<br />
players or monopolies. At the same time, there is more<br />
direct public sector involvement in the management of<br />
supply and demand. Decisions that might be marketdriven<br />
in other sectors, are not always so in the electricity<br />
sector, due to the physical nature of electricity and the<br />
demands of maintaining a stable electricity system for<br />
vital services to the population.<br />
<strong>Electric</strong> utilities actively engage in discussions around<br />
general public policy issues (e.g., public health) and<br />
this is addressed in indicator SO5. <strong>Electric</strong> utilities also<br />
provide a particularly important input into planning<br />
process around energy strategies and infrastructure<br />
development given their role as providers of the<br />
service. The nature of this engagement and the<br />
level transparency afforded to stakeholders varies<br />
significantly.<br />
This indicator addresses the process by which a utility<br />
develops its inputs and proposals regarding energy<br />
planning and infrastructure development and involves<br />
civil society organizations in such a process.<br />
2. Compilation<br />
2.1 Identify the earliest point at which informed<br />
stakeholder inputs are requested and inputs are<br />
obtained including before decisions are taken.<br />
Decisions include, but are not limited to, resource<br />
planning, proposals for the siting of facilities and<br />
transmission lines, and changes to customer<br />
programs.<br />
2.2 Energy planning and infrastructure development<br />
covers a range of policy decisions related to areas<br />
such as:<br />
• Energy demand projections;<br />
• Energy sources and technologies;<br />
• Site planning and displacement;<br />
• Rate and tariff setting;<br />
• Climate change and environmental impacts;<br />
and<br />
• Others.<br />
Indicator Protocols Set: SO<br />
2.3 Identify the range of policy decisions where the<br />
reporting organization is active. This may relate<br />
to international, national or regional policy or<br />
planning or to the development of specific projects<br />
or infrastructure.<br />
2.4 Identify the type of authorities which are engaged.<br />
These may be local regulators, governments, public<br />
agencies or commissions, etc.<br />
2.5 Identify civil society organizations, which are<br />
engaged. These may be community associations,<br />
NGOs, worker organizations, citizen groups, etc.<br />
2.6 Report processes project by project regarding<br />
the involvement of stakeholders in the decision<br />
making process regarding energy planning and<br />
development, in terms of:<br />
• Groups to be informed and consulted;<br />
• Points in the decision-making process for<br />
consultation;<br />
• How early in the decision-making process<br />
stakeholders are engaged;<br />
• Management level within the organization<br />
responsible for the consultation;<br />
• Information and resources provided to support<br />
participation process (including measures to<br />
ensure vulnerable stakeholders are informed,<br />
engaged and empowered); and<br />
• The channels through which stakeholder<br />
participation occurs.<br />
The organization should state how the<br />
consultation process varies depending on factors<br />
such as the type of policy or infrastructure in<br />
question or the regulatory regime.<br />
3. Definitions<br />
Refer to G3 definition of stakeholder.<br />
Participation<br />
Criteria for participation may include: ability to<br />
influence decisions through timely access to relevant<br />
material and mechanisms for systematic input. Degree<br />
of participation will range from information sharing,<br />
through consultation to shared decision making.<br />
EU<br />
IP<br />
&<br />
EUSS<br />
EU<br />
Version 3.0/EUSS Final Version<br />
3
IP<br />
&<br />
EUSS<br />
Indicator Protocols Set: SO<br />
4. Documentation<br />
Potential information sources include organizational<br />
policies and procedures, results of data collection from<br />
environmental and community programs, and analysis<br />
results of external stakeholder forums, joint community<br />
committees, stakeholder reports, and other inputs. Both<br />
internal and external sources and references should be<br />
used.<br />
5. References<br />
Refer to the World Bank definition of vulnerability in the<br />
World Bank Glossary of Key Terms available online at<br />
http://www.worldbank.org/.<br />
<strong>Electric</strong> Utility <strong>Sector</strong> <strong>Supplement</strong><br />
EU<br />
EU<br />
4<br />
© 2000-2009 GRI
Indicator Protocols Set: SO<br />
IP<br />
&<br />
EUSS<br />
EU20: Approach to managing the<br />
impacts of displacement<br />
1. Relevance<br />
The construction or expansion of electricity utility<br />
infrastructure can result in the displacement of local<br />
residents. Affected people can experience loss of<br />
livelihoods, breakdown of social networks, and loss of<br />
access, among other impacts.<br />
It is also recognized that other players (e.g. governments,<br />
banks, etc) are responsible for displacements, in addition<br />
to <strong>Electric</strong> <strong>Utilities</strong>.<br />
2. Compilation<br />
2.1 Report the approach taken by the reporting<br />
organization, including:<br />
• Identification of affected people;<br />
• The legal context and the approach taken to<br />
address involuntary and consensual physical and<br />
economic displacement ;<br />
• Assessment of psychological and social impacts to<br />
individuals and communities affected;<br />
• Discussion of how the organization is looking to<br />
avoid displacement and how alternatives are being<br />
considered;<br />
• Nature of consultation, e.g., formal role of local<br />
people in consultation and participation in<br />
decision-making processes;<br />
• Preparation of resettlement plan and budget<br />
within a specific timeframe, and mechanisms to<br />
evaluate implementation;<br />
• Compensation and other assistance for<br />
resettlement including comparison with priorliving<br />
standards;<br />
• Grievance mechanisms to address concerns about<br />
compensation and relocation or resettlement;<br />
• Programs for communities to ensure their social<br />
and cultural identities are protected, this is<br />
particularly important for indigenous peoples; and<br />
• Describe which players (e.g. governments, banks,<br />
etc) the organization is working with and how<br />
responsibilities relating to displacement are shared.<br />
3. Definitions<br />
Compensation<br />
Compensation could include cash compensation,<br />
replacement housing, land, or commercial sites (e.g.<br />
shops), and additional support such as infrastructure<br />
in new resettlement sites, training, credit and job<br />
opportunities.<br />
Involuntary Displacement<br />
Physical displacement can be defined as relocation or<br />
loss of shelter. Economic displacement means loss of<br />
assets or access to assets which results in loss of means<br />
of livelihood. Involuntary means that the displacement is<br />
against the will of those displaced.<br />
4. Documentation<br />
Legal department, planning department.<br />
5. References<br />
None.<br />
EU<br />
EU<br />
Version 3.0/EUSS Final Version<br />
5
IP<br />
&<br />
EUSS<br />
EU<br />
Indicator Protocols Set: SO<br />
EU21: Contingency planning measures, disaster/<br />
emergency management plan and training programs,<br />
and recovery/restoration plans.<br />
1. Relevance<br />
The infrastructure of most electric utilities presents<br />
potential hazards, which can have serious impacts.<br />
Examples of concerns include major accidents,<br />
natural disasters and terrorist attacks. These require<br />
contingency planning measures, disaster/emergency<br />
management plans and training programs, and<br />
recovery/restoration plans. A major incident can not<br />
only threaten the lives of surrounding communities but<br />
also leave a region without service and the company<br />
with high restoration costs.<br />
This indicator is particularly relevant to nuclear and<br />
large scale hydro power generation, but it is applicable<br />
across the sector. This indicator describes the disaster/<br />
emergency management and recovery/restoration<br />
plans the reporting organization has in place. In many<br />
cases these plans are developed in cooperation with<br />
regional or national government.<br />
2. Compilation<br />
2.1 Report approach to:<br />
• Key event risks and assumptions;<br />
• On-site and off-site emergency planning;<br />
• On-site and off-site communication;<br />
• Emergency plan testing;<br />
• Approval by external parties (e.g. public<br />
authorities or regulators);<br />
• Training and preparedness measures for<br />
employees, contractors, subcontractors; and<br />
• Adherence to specific regulatory<br />
requirements, performance standards, and/or<br />
codes of practice.<br />
<strong>Electric</strong> Utility <strong>Sector</strong> <strong>Supplement</strong><br />
2.3 Report how the community, authorities<br />
and industrial customers are involved in the<br />
development and implementation of these plans.<br />
2.4 Report where this information is publically<br />
available for each facility.<br />
3. Definitions<br />
Major Accidents<br />
Major accidents are exceptional events which occur very<br />
infrequently and have a high significant impact.<br />
4. Documentation<br />
Report to regulatory authorities.<br />
5. References<br />
None.<br />
EU<br />
The organizational approach described should<br />
include short and long-term management<br />
responses. This should include the legal<br />
framework underpinning emergency plans and<br />
describe areas where security issues prevent full<br />
disclosure.<br />
2.2 Report the approach for the restoration of power<br />
and other essential services.<br />
6<br />
© 2000-2009 GRI
SO1 Nature, scope, and effectiveness of<br />
any programs and practices that assess<br />
and manage the impacts of operations<br />
on communities, including entering,<br />
operating, and exiting.<br />
1. Relevance<br />
Organizational operations such as entering, operating,<br />
and exiting have a number of significant impacts on<br />
the sustainability of a specific area. Indicators in the<br />
GRI Framework, such as environmental emissions or<br />
economic data, will offer an overall picture of these<br />
positive and negative impacts, but may not be able to<br />
break them down to the level of individual communities<br />
or geographic areas. As such, it is important to have<br />
a measure that reflects the approach used by the<br />
organization to manage its impacts, both negative and<br />
positive, systematically across the range of communities<br />
in which it operates.<br />
Stakeholders are interested in the robustness of the<br />
approach the organization applies to managing the<br />
impacts it has on a community. Thus, having reliable<br />
management systems in place can enhance the brand<br />
and reputation of the organization as a potential<br />
partner. It also simultaneously strengthens the ability<br />
of organizations to maintain existing operations and to<br />
initiate new ones.<br />
2. Compilation<br />
2.1 Report whether there are programs in place for<br />
assessing the impacts of operations on local<br />
communities:<br />
• Prior to entering the community;<br />
• While operating in the community; and<br />
• While making decisions to exit the community.<br />
2.2 Report whether programs or policies define:<br />
• How data is collected for such programs,<br />
including by whom; and<br />
• How to select community members (individual or<br />
group) from whom information will be gathered.<br />
Indicator Protocols Set: SO<br />
2.4 Report whether the organization’s programs for<br />
managing community impacts have been effective<br />
in mitigating negative impacts and maximizing<br />
positive impacts, including the scale of persons<br />
affected.<br />
Include discussions of programs related to:<br />
• Ways in which information is exchanged and<br />
local population is involved, prior, during and<br />
after the event and the provision for intervener<br />
funding for the local population;<br />
• Influx of workers and impacts on neighboring<br />
communities (including changes to local social<br />
structures and culture);<br />
• Changes to land-use including loss of<br />
global commons (e.g. access to land, natural<br />
resources, and heritage);<br />
• Impacts on infrastructure (e.g. roads, housing),<br />
and access to services (e.g. education, utilities,<br />
healthcare); and<br />
• Changes to the aesthetics and quality of the<br />
landscape.<br />
2.5 Report examples of how feedback and analysis of<br />
data on community impacts have informed steps<br />
toward further community engagement on the<br />
part of the reporting organization.<br />
3. Definitions<br />
Impacts of operations<br />
This refers primarily to social impacts, such as:<br />
• Community health and safety regarding<br />
infrastructure, hazardous materials, emissions and<br />
discharges, and health and disease;<br />
• Involuntary resettlement, physical and economic<br />
displacement and livelihood restoration; and<br />
• Local culture, gender, indigenous peoples, and<br />
cultural heritage.<br />
This definition excludes impacts covered by other<br />
Indicators, such as EN10 (water sources/habitats affected<br />
by water use), EN12 (areas with high biodiversity value),<br />
and LA8 (serious diseases). It also excludes voluntary<br />
contributions (in-kind and cash) to communities.<br />
EU<br />
IP<br />
&<br />
EUSS<br />
EU<br />
2.3 Report the number and percentage of operations<br />
to which the programs apply.<br />
Version 3.0/EUSS Final Version<br />
7
IP<br />
&<br />
EUSS<br />
Indicator Protocols Set: SO<br />
Intervener funding<br />
This refers to the funding of stakeholders who provide<br />
input in to the regulatory process. The funding is<br />
provided by the regulatory body, the electric utility or<br />
the state.<br />
EU<br />
4. Documentation<br />
Potential information sources include organizational<br />
policies and procedures, results of data collection from<br />
community programs, and analysis results of external<br />
stakeholder forums, joint community committees,<br />
stakeholder reports, and other inputs.<br />
Both internal and external sources and references should<br />
be used.<br />
5. References<br />
None.<br />
EU<br />
8<br />
© 2000-2009 GRI
<strong>Electric</strong> Utility <strong>Sector</strong> <strong>Supplement</strong><br />
EU22: Number of people physically<br />
or economically displaced and<br />
compensation, broken down by type of<br />
project<br />
1. Relevance<br />
<strong>Electric</strong> utility sites invariably have an impact on the<br />
local population and new or expansion projects can<br />
result in their displacement. Both physical and economic<br />
displacement can result in a deterioration of quality<br />
of life. This indicator will report the number of people<br />
displaced by new or expansion projects and it will<br />
highlight the impact the reporting organization has<br />
had on the local community. The indicator will help to<br />
ensure transparency surrounding the impacts of the<br />
electric utility on the community. EU 21 aims to address<br />
displacements related to large scale projects.<br />
Indicator Protocols Set: SO<br />
IP<br />
&<br />
EUSS<br />
2. Compilation<br />
2.1 Identify number of people physically and<br />
economically displaced by large projects broken<br />
down by type of project (e.g. plant expansion, new<br />
plant, new transmission lines).<br />
2.2<br />
Report on the number of people compensated<br />
(e.g. access to electricity, new job opportunities).<br />
EU<br />
EU<br />
2.3 Report the number of people physically or economically<br />
displaced, broken down by type of project.<br />
Displacement<br />
loss of shelter. Economic displacement means loss of<br />
assets or access to assets, which results in loss of means<br />
of livelihood.<br />
4. Documentation<br />
Legal department, planning department.<br />
5. References<br />
None.<br />
Version 3.0/EUSS Final Version<br />
9
IP<br />
&<br />
EUSS<br />
Indicator Protocols Set: SO<br />
SO2 Percentage and total number of<br />
business units analyzed for risks related<br />
to corruption.<br />
1. Relevance<br />
Efforts to manage reputational risks arising from corrupt<br />
practices by employees or business partners require a<br />
system that has supporting procedures in place. This<br />
measure identifies two specific actions for ensuring the<br />
effective deployment of the reporting organization’s<br />
policies and procedures by its own employees and its<br />
intermediaries or business partners. Risk analysis is an<br />
important and necessary management approach that<br />
helps to assess the potential for incidents of corruption<br />
within the organization.<br />
2. Compilation<br />
2.1 Identify business units analyzed for organizational<br />
risks related to corruption during the reporting<br />
period. This refers to either a formal risk<br />
assessment focused on corruption or the inclusion<br />
of corruption as a risk factor in overall risk<br />
assessments.<br />
EU<br />
2.2 Report the total number and percentage of<br />
business units analyzed for risks related to<br />
corruption.<br />
3. Definitions<br />
None.<br />
4. Documentation<br />
Potential information sources include monitoring<br />
reports.<br />
5. References<br />
• OECD Convention on Combating Bribery of<br />
Foreign Public Officials in International Business<br />
Transactions, 1997.<br />
• OECD Guidelines for Multinational Enterprises,<br />
Revision 2000.<br />
• Inter-American Convention Against Corruption,<br />
1996.<br />
• United Nations Convention Against Corruption,<br />
2003.<br />
• Business Principles for Countering Bribery, 2003.<br />
10<br />
© 2000-2009 GRI
SO3 Percentage of employees trained in<br />
organization’s anti-corruption policies<br />
and procedures.<br />
1. Relevance<br />
Efforts to manage reputational risks arising from corrupt<br />
practices by employees or business partners require<br />
a system that has supporting procedures in place.<br />
Training is an important element of such a system as<br />
it builds internal awareness and capacity necessary to<br />
prevent incidents of corruption. This measure reveals<br />
the proportion of the organization’s employees that<br />
can reasonably be assumed to be aware of the anticorruption<br />
issues.<br />
Indicator Protocols Set: SO<br />
IP<br />
&<br />
EUSS<br />
2. Compilation<br />
2.1 Identify the total number of employees,<br />
distinguishing between management and nonmanagement<br />
employees, using the data from LA1.<br />
2.2 Report separately the percentage of total number<br />
of management and non-management employees<br />
who have received anti-corruption training during<br />
the reporting period.<br />
3. Definitions<br />
None.<br />
4. Documentation<br />
Potential information sources include training records.<br />
EU<br />
5. References<br />
• OECD Convention on Combating Bribery of<br />
Foreign Public Officials in International Business<br />
Transactions, 1997.<br />
• OECD Guidelines for Multinational Enterprises,<br />
Revision 2000.<br />
• Inter-American Convention Against Corruption,<br />
1996.<br />
• United Nations Convention Against Corruption,<br />
2003.<br />
• Business Principles for Countering Bribery, 2003.<br />
Version 3.0/EUSS Final Version<br />
11
IP<br />
&<br />
EUSS<br />
Indicator Protocols Set: SO<br />
SO4 Actions taken in response to<br />
incidents of corruption.<br />
1. Relevance<br />
Corruption can be a significant risk to an organization’s<br />
reputation and business. It is broadly linked to<br />
contributing to poverty in transition economies,<br />
damage to the environment, abuse of human rights,<br />
abuse of democracy, misallocation of investments,<br />
and undermining the rule of law. Organizations are<br />
increasingly expected by the marketplace, international<br />
norms, and stakeholders to demonstrate their adherence<br />
to integrity, governance, and good business practices.<br />
This Indicator demonstrates specific actions taken to<br />
limit exposure to sources of corruption and reduce the<br />
risk of new instances of corruption. For stakeholders,<br />
there is an interest in both the occurrence of incidents,<br />
but also how the organization chooses to respond.<br />
2. Compilation<br />
2.1 Report actions taken in response to incidents of<br />
corruption, including:<br />
5. References<br />
• United Nations Convention Against Corruption,<br />
2003.<br />
• OECD Convention on Combating Bribery of<br />
Foreign Public Officials in International Business<br />
Transactions, 1997.<br />
• Inter-American Convention Against Corruption,<br />
1996.<br />
• OECD Guidelines for Multinational Enterprises,<br />
Revision 2000.<br />
• Anti-Corruption Instruments and the OECD<br />
Guidelines for Multinational Enterprises, 2003.<br />
• Business Principles for Countering Bribery, 2003.<br />
EU<br />
• The total number of incidents in which<br />
employees were dismissed or disciplined for<br />
corruption; and<br />
• The total number of incidents when contracts<br />
with business partners were not renewed due<br />
to violations related to corruption.<br />
2.2 Report any concluded legal cases regarding<br />
corrupt practices brought against the reporting<br />
organization or its employees during the reporting<br />
period and the outcomes of such cases.<br />
3. Definitions<br />
None.<br />
4. Documentation<br />
Potential information sources include legal department<br />
records of cases brought against the reporting<br />
organization, its employees, business partners, or<br />
contractors; minutes of the proceedings of internal<br />
disciplinary hearings; and contracts with business partners.<br />
12<br />
© 2000-2009 GRI
SO5 Public policy positions and<br />
participation in public policy<br />
development and lobbying.<br />
1. Relevance<br />
This Indicator provides information that allows<br />
organizations to compare public policy positions<br />
with formal sustainability policies and objectives. This<br />
information provides insight into the extent to which<br />
publicly-expressed positions on sustainability are<br />
consistently embedded across the organization and<br />
aligned across different units. This allows a comparison<br />
of organizational priorities (particularly when making<br />
comparisons within the same sector) at the same time as<br />
the particular policy positions help to clarify the strategic<br />
relevance of sustainability issues for the organization. It<br />
also helps to provide transparency for lobbying activities<br />
for those concerned with the integrity of the practices<br />
and potential impacts on stakeholders.<br />
2. Compilation<br />
2.1 Participation refers to efforts where the<br />
organization has taken a formal position or<br />
activities where participation has been formally<br />
recognized. While this could include activities<br />
through trade associations, roundtables, task<br />
forces, and other forms of lobbying with public<br />
policymakers, the disclosure relates to the position<br />
of the organization and not that of the bodies in<br />
which it is involved.<br />
3. Definitions<br />
Public policy development<br />
Indicator Protocols Set: SO<br />
Organized or coordinated activities to effect government<br />
policy formulation.<br />
Lobbying<br />
Refers to efforts to persuade or influence persons<br />
holding political office, or candidates for such office, to<br />
sponsor policies, and/or to influence the development<br />
of legislation or political decisions. In this Indicator,<br />
this can relate to lobbying governments at any level or<br />
international institutions.<br />
4. Documentation<br />
Potential information sources include the public policy<br />
statements of the reporting organization; internal<br />
minutes of government relations committees or<br />
departments; statements of positions adopted by the<br />
reporting organization in relevant trade associations;<br />
and records of interactions with public policy-makers.<br />
5. References<br />
• OECD Guidelines for Multinational Enterprises,<br />
Revision 2000.<br />
• OECD Principles of Corporate Governance, 2004.<br />
IP<br />
&<br />
EUSS<br />
EU<br />
2.2 Report the significant issues that are the focus of<br />
the reporting organization’s participation in public<br />
policy development and lobbying. This refers to<br />
participation at the level of the organization rather<br />
than individual operations.<br />
2.3 Report the core positions held on each of the<br />
reported issues above and explain any significant<br />
differences between lobbying positions and<br />
stated policies, sustainability goals, or other public<br />
positions.<br />
Version 3.0/EUSS Final Version<br />
13
IP<br />
&<br />
EUSS<br />
Indicator Protocols Set: SO<br />
SO6 Total value of financial and inkind<br />
contributions to political parties,<br />
politicians, and related institutions by<br />
country.<br />
1. Relevance<br />
The purpose of this Indicator is to reflect the scale of<br />
the reporters’ engagement in political funding and to<br />
ensure transparency in political dealings and relationships<br />
with the reporting organization. Many countries have<br />
legislation that sets limits on official expenditure by<br />
parties and political candidates for campaigning purposes.<br />
2. Compilation<br />
2.1 Identify the total monetary value of financial and<br />
in-kind contributions committed by the reporting<br />
organization during the reporting period to<br />
political parties, politicians, and related institutions.<br />
The value of in-kind contributions should be<br />
estimated.<br />
2.2 Calculate contributions in accordance with national<br />
accounting rules (where these exist).<br />
Related institutions<br />
Any bodies established with the primary purpose of<br />
arranging official or unofficial funding support for<br />
political parties, their elected representatives, or persons<br />
seeking political office. This definition also includes<br />
think-tanks, policy organs, trade associations, and other<br />
support organizations that are linked to the creation<br />
of support for political parties, their representatives, or<br />
candidates for office.<br />
4. Documentation<br />
Potential information sources include the accounting<br />
records of external payments and public disclosure<br />
statements.<br />
5. References<br />
• OECD Guidelines for Multinational Enterprises,<br />
Revision 2000.<br />
EU<br />
2.3 Report the total monetary value broken down by<br />
country for those countries where:<br />
• The organization has major operations and/or<br />
sales;<br />
• The organization holds a significant share<br />
of the market in comparison to other<br />
organizations; or<br />
• The sums contributed are significant compared<br />
to the total amount contributed globally.<br />
3. Definitions<br />
Contributions<br />
Contributions can include donations, loans,<br />
sponsorships, purchase of tickets for fundraising<br />
events, advertising, use of facilities, design and printing,<br />
donation of equipment, retainers or jobs for elected<br />
politicians or candidates for office, etc.<br />
14<br />
© 2000-2009 GRI
SO7 Total number of legal actions for<br />
anti-competitive behavior, anti-trust, and<br />
monopoly practices and their outcomes.<br />
1. Relevance<br />
Mergers and acquisitions can affect consumer choice,<br />
pricing, and other factors that are essential to efficient<br />
markets. Legislation has been introduced in many<br />
countries that seeks to control or prevent monopolies,<br />
with the underlying assumption that competition<br />
between enterprises also promotes economic efficiency<br />
and sustainable growth. Legal action indicates a<br />
situation in which the market actions or status of<br />
the organization have reached a sufficient scale to<br />
merit concern by a third party. Legal decisions arising<br />
from these situations can carry the risk of significant<br />
disruption of market activities for the organization and/<br />
or punitive measures.<br />
2. Compilation<br />
2.1 This Indicator pertains to legal actions initiated<br />
under national or international laws designed<br />
primarily for the purpose of regulating anticompetitive<br />
behavior, anti-trust, or monopoly<br />
practices.<br />
2.2 Identify legal actions pending or completed during<br />
the reporting period regarding anti-competitive<br />
behavior and violations of anti-trust and monopoly<br />
legislation in which the reporting organization has<br />
been identified as a participant.<br />
Anti-trust and monopoly practices<br />
Indicator Protocols Set: SO<br />
Actions of the reporting organization that may result in<br />
collusion to erect barriers to entry to the sector, unfair<br />
business practices, abuse of market position, cartels,<br />
anti-competitive mergers, price-fixing, and other<br />
collusive actions which prevent competition.<br />
4. Documentation<br />
Potential information sources include the legal<br />
department records and public records.<br />
5. References<br />
• OECD Guidelines for Multinational Enterprises,<br />
Revision 2000.<br />
IP<br />
&<br />
EUSS<br />
EU<br />
2.3 Report the total number of legal actions for anticompetitive<br />
behavior, anti-trust, and monopoly<br />
practices.<br />
2.4 Report the main outcomes of such actions,<br />
including any decisions or judgements.<br />
3. Definitions<br />
Anti-competitive behavior<br />
Actions of the reporting organization and/or employees<br />
that may result in collusion with potential competitors<br />
to fix prices, coordinate bids, create market or output<br />
restrictions, impose geographic quotas, or allocate<br />
customers, suppliers, geographic areas, and product<br />
lines with the purpose of limiting the effects of market<br />
competition.<br />
Version 3.0/EUSS Final Version<br />
15
IP<br />
&<br />
EUSS<br />
EU<br />
Indicator Protocols Set: SO<br />
SO8 Monetary value of significant fines<br />
and total number of non-monetary<br />
sanctions for non-compliance with laws<br />
and regulations.<br />
1. Relevance<br />
The level of non-compliance within the organization<br />
helps to indicate the ability of management to ensure<br />
that operations conform to certain performance<br />
parameters. From an economic perspective, ensuring<br />
compliance helps to reduce financial risks that occur<br />
either directly through fines or indirectly through<br />
impacts on reputation. The strength of an organization’s<br />
compliance record can also affect its ability to expand<br />
operations or gain permits.<br />
Indicators EN28 and PR9 address compliance with<br />
specific aspects of law. An organization’s overall record of<br />
compliance with the range of laws under which it must<br />
operate is equally of interest. This Indicator is intended<br />
to reflect significant fines and non-monetary sanctions<br />
under laws or regulations not covered by EN28 and PR9,<br />
such as laws and regulations related to accounting fraud,<br />
workplace discrimination, corruption, etc.<br />
2. Compilation<br />
2.1 Identify administrative or judicial sanctions levied<br />
against the organization for failure to comply with<br />
laws or regulations, including:<br />
2.3 Where the reporting organization has not<br />
identified any non-compliance with laws or<br />
regulations, a brief statement to this fact is<br />
sufficient.<br />
2.4 Organizations are encouraged to report fines and<br />
non-monetary sanctions in terms of the focus of<br />
laws.<br />
3. Definitions<br />
None.<br />
4. Documentation<br />
Data sources include audit results or regulatory tracking<br />
systems operated by the legal department. Information<br />
regarding monetary fines can be found in accounting<br />
departments.<br />
5. References<br />
None.<br />
• International declarations/conventions/<br />
treaties, and national, sub-national, regional,<br />
and local regulations, and.<br />
• Cases brought against the organization<br />
through the use of international dispute<br />
mechanisms or national dispute mechanisms<br />
supervised by government authorities.<br />
2.2 Report significant fines and non-monetary<br />
sanctions in terms of:<br />
• Total monetary value of significant fines;<br />
• Number of non-monetary sanctions; and<br />
• Cases brought through dispute resolution<br />
mechanisms.<br />
16<br />
© 2000-2009 GRI
EU<br />
Indicator Protocols Set<br />
Product Responsibility (PR)<br />
© 2000-2011 GRI Version 3.0/EUSS Final Version
Product Responsibility<br />
<strong>Electric</strong> <strong>Utilities</strong> <strong>Sector</strong> Specific<br />
Disclosures on Management<br />
Approach<br />
Indicator Protocols Set: PR<br />
IP<br />
&<br />
EUSS<br />
Aspect: Access<br />
Co r e<br />
EU23. Programs, including those in partnership with<br />
government, to improve or maintain access to<br />
electricity and customer support services.<br />
Aspect: Provision of Information<br />
Co r e<br />
EU24. Practices to address language, cultural, low<br />
literacy and disability related barriers to<br />
accessing and safely using electricity and<br />
customer support services.<br />
Performance Indicators<br />
Aspect: Customer Health and Safety<br />
EU<br />
A d d<br />
PR2<br />
Total number of incidents of non-compliance<br />
with regulations and voluntary codes<br />
concerning health and safety impacts of<br />
products and services, by type of outcomes.<br />
Aspect: Product and Service Labeling<br />
Co r e<br />
A d d<br />
PR3<br />
PR4<br />
Type of product and service information<br />
required by procedures, and percentage of<br />
significant products and services subject to<br />
such information requirements.<br />
Total number of incidents of non-compliance<br />
with regulations and voluntary codes<br />
concerning product and service information<br />
and labeling, by type of outcomes.<br />
Co r e<br />
Co r e<br />
PR1 Life cycle stages in which health and safety<br />
impacts of products and services are assessed<br />
for improvement, and percentage of significant<br />
products and services categories subject to such<br />
procedures.<br />
See<br />
sector specific commentary in protocol<br />
A d d<br />
PR5<br />
Practices related to customer satisfaction,<br />
including results of surveys measuring<br />
customer satisfaction.<br />
Aspect: Marketing Communications<br />
Co r e<br />
PR6<br />
Programs for adherence to laws, standards,<br />
and voluntary codes related to marketing<br />
communications, including advertising,<br />
promotion, and sponsorship.<br />
EU<br />
EU25. Number of injuries and fatalities to the public<br />
involving company assets, including legal<br />
judgments, settlements and pending legal cases<br />
of diseases.<br />
Aspect: Access<br />
Co r e<br />
A d d<br />
PR7<br />
Total number of incidents of non-compliance<br />
with regulations and voluntary codes<br />
concerning marketing communications,<br />
including advertising, promotion, and<br />
sponsorship, by type of outcomes.<br />
Co r e<br />
Co r e<br />
EU26. Percentage of population unserved in licensed<br />
distribution or service areas.<br />
EU27. Number of residential disconnections for<br />
non-payment, broken down by duration of<br />
disconnection and by regulatory regime.<br />
EU<br />
Aspect: Customer Privacy<br />
A d d<br />
PR8<br />
Total number of substantiated complaints<br />
regarding breaches of customer privacy and<br />
losses of customer data.<br />
Aspect: Compliance<br />
Co r e<br />
Co r e<br />
EU28. Power outage frequency.<br />
EU29. Average power outage duration.<br />
Co r e<br />
PR9<br />
Monetary value of significant fines for<br />
non-compliance with laws and regulations<br />
concerning the provision and use of products<br />
and services.<br />
Co r e<br />
EU30. Average plant availability factor by energy<br />
source and by regulatory regime.<br />
Version 3.0/EUSS Final Version<br />
1
IP<br />
&<br />
EUSS<br />
Indicator Protocols Set: PR<br />
Relevance<br />
The Product Responsibility Indicator set addresses<br />
the effects of products and services management on<br />
customers and users. Organizations are expected to<br />
exercise due care in the design of their products and<br />
services to ensure they are fit for their intended use and<br />
do not pose unintended hazards to health and safety.<br />
In addition, communications related to both products<br />
and services and users need to take into consideration<br />
the information needs of customers and their rights to<br />
privacy. The Indicators are primarily structured in pairs,<br />
with a Core Indicator seeking disclosure on the processes<br />
in place to address the aspect, and an additional<br />
Indicator to report on degree of compliance.<br />
Definitions<br />
Type of non-compliance<br />
Court judgment on failure to act in accordance with<br />
regulations or laws, categorized by the nature of the laws<br />
or regulations breached.<br />
Product and service information/labeling<br />
EU<br />
Information and labeling are used synonymously and<br />
describe communication delivered with the product or<br />
service describing its characteristics.<br />
Customer privacy<br />
The right of the customer to privacy and personal refuge,<br />
including matters such as the protection of data, the<br />
use of information/data only for its original intended<br />
purpose (unless specifically agreed otherwise), the<br />
obligation to observe confidentiality, and protection<br />
from misuse or theft. A customer is understood to<br />
include end-customers (consumer) as well as businessto-business<br />
customers.<br />
Marketing communication<br />
The combination of strategies, systems, methods,<br />
and activities used by an organization to promote<br />
its reputation, brands, products, and services to<br />
target audiences. Marketing communications can<br />
include activities such as advertising, personal selling,<br />
promotion, public relations, and sponsorship.<br />
General References<br />
• OECD Guidelines for Multinational Enterprises,<br />
Revision 2000.<br />
2<br />
©2000-2009 GRI
<strong>Electric</strong> Utility <strong>Sector</strong> <strong>Supplement</strong><br />
EU23: Programs, including those in<br />
partnership with government, to<br />
improve or maintain access to electricity<br />
and customer support services<br />
1. Relevance<br />
<strong>Electric</strong>ity supply is a basic necessity whether supplied<br />
on- or off-grid. It is key for enabling access to many other<br />
technologies and services. Programs to improve access<br />
to electricity can deliver significant improvements to the<br />
standard of living for individuals and communities.<br />
2. Compilation<br />
2.1 The purpose of this indicator is to report the<br />
programs which provide and improve access to<br />
electricity and which help to avoid disconnections<br />
for residential customers.<br />
3. Definitions<br />
Access<br />
Indicator Protocols Set: PR<br />
Access is defined as the ability to use an affordable,<br />
reliable and unrestricted electricity supply. People can<br />
be denied access to electricity for a number of reasons,<br />
including but not limited to geographic isolation and/or<br />
financial poverty.<br />
4. Documentation<br />
Commercial, Customer Services, and Billing/Marketing<br />
departments.<br />
5. References<br />
None.<br />
IP<br />
&<br />
EUSS<br />
2.2 Report programs specifically targeting low<br />
income or vulnerable customers and communities<br />
which aim to improve access to electricity. The<br />
reporting organization should explain how it<br />
defines ‘low income’ or ‘vulnerable’ customers and<br />
how it identifies which of its customers are in this<br />
category.<br />
Programs to be reported will aim to prevent<br />
disconnections and debt for low income or<br />
vulnerable customers. It should be clear which<br />
programs are supported by public funds. Examples<br />
of the sort of programs to report are:<br />
• Subsidized payment of bills;<br />
• Special rates;<br />
• Helping with payment arrangements;<br />
• Energy saving to lower payments;<br />
• Programs for remote off-grid populations;<br />
• Programs to ensure universal access to<br />
electricity within licensed distribution or<br />
service areas;<br />
• Formalizing unauthorized connections;<br />
• Helping people who have been disconnected<br />
to get reconnected; and<br />
• Intermediary help by local health services.<br />
This disclosure should not include programs<br />
covered by EU24 or by more general maintenance<br />
and expansion programs of electrical systems.<br />
EU<br />
EU<br />
Version 3.0/EUSS Final Version<br />
3
IP<br />
&<br />
EUSS<br />
Indicator Protocols Set: PR<br />
EU24: Practices to address language,<br />
cultural, low literacy and disability<br />
related barriers to access and safely use<br />
electricity and customer support services<br />
1. Relevance<br />
Provision of information is essential to ensure consumers<br />
have access to electricity delivering significant<br />
improvements to their standard of living.<br />
4. Documentation<br />
Communications, Commercial, Customer Operations/<br />
Customer Services, and Marketing Departments.<br />
5. References<br />
None.<br />
<strong>Electric</strong> Utility <strong>Sector</strong> <strong>Supplement</strong><br />
<strong>Electric</strong>ity and electric power generation can be lethal if<br />
not handled/generated/used in a safe manner. <strong>Electric</strong><br />
utilities need to communicate the dangers associated<br />
with their operations and the measures in place to<br />
prevent customers being harmed.<br />
EU<br />
In some areas where the primary national language<br />
may not be the dominant language, organizations<br />
should ensure that all literature, signage, labeling<br />
and communication are in a language which can be<br />
understood by all. Similarly people with disabilities<br />
should be considered when the organization<br />
communicates important customer related or health and<br />
safety information.<br />
2. Compilation<br />
2.1 Report programs in place to ensure that language<br />
barriers and/or disabilities do not impede the<br />
effective communication of important customerrelated<br />
or health and safety information.<br />
EU<br />
These may include:<br />
• Multi-lingual billing information;<br />
• Billing information available in Braille or audio<br />
versions;<br />
• Multi-lingual customer support; and<br />
• Multi-lingual signage, labeling, safety warnings.<br />
2.2 Report any programs or specific practices<br />
which help to warn people about the dangers<br />
of electricity and educate people about safe<br />
electricity use.<br />
3. Definitions<br />
None.<br />
4<br />
©2000-2009 GRI
PR1 Life cycle stages in which health<br />
and safety impacts of products and<br />
services are assessed for improvement,<br />
and percentage of significant products<br />
and services categories subject to such<br />
procedures.<br />
1. Relevance<br />
This measure helps to identify the existence and scope<br />
of systematic efforts to address health and safety across<br />
the life cycle of a product and/or service. Customers<br />
expect products and services to perform their intended<br />
functions satisfactorily, and not pose a risk to health<br />
and safety. This responsibility is not only subject to<br />
laws and regulations, but is also addressed in voluntary<br />
codes such as the OECD Guidelines for Multinational<br />
Enterprises.<br />
Efforts made to protect the health and safety of<br />
those who use or deliver the product/service have<br />
direct impacts on an organization’s reputation, the<br />
organization’s legal and financial risk due to recall,<br />
market differentiation in relation to quality, and<br />
employee motivation.<br />
2. Compilation<br />
2.1 In each of the following life cycle stages, report<br />
whether the health and safety impacts of products<br />
and services are assessed for improvement:<br />
Development of product<br />
concept<br />
R & D<br />
Certification<br />
Manufacturing and<br />
production<br />
Marketing and promotion<br />
Storage distribution and<br />
supply<br />
Use and service<br />
Disposal, reuse, or recycling<br />
yes<br />
no<br />
Indicator Protocols Set: PR<br />
2.2 For electric utilities the following categories should<br />
also be assessed:<br />
• Resource planning<br />
• Generation<br />
• Transmission<br />
• Distribution<br />
• Use<br />
2.3 State the processes for assessing community<br />
health risks including monitoring, prevention<br />
measures and, if applicable, long term healthrelated<br />
studies.<br />
2.4 Report the percentage of significant product<br />
or service categories that are covered by and<br />
assessed for compliance with such procedures.<br />
2.5 Identify community health risks that are assessed<br />
such as:<br />
• Compliance with exposure limit(s) to electric<br />
fields (in kV per m) and magnetic fields (in μT)<br />
where available, for members of the public<br />
and employees in the areas in which the<br />
reporting organization operates.<br />
3. Definitions<br />
Community health risks<br />
Community health risks can include issues such as<br />
exposure to electric and magnetic fields, emissions,<br />
noise, diseases, etc. Long-term health related studies<br />
may include epidemiological studies.<br />
<strong>Electric</strong> Fields<br />
An electric field is an invisible force field created by the<br />
attraction and repulsion of electrical charges (the cause<br />
of electric flow), and is measured in Volts per meter<br />
(V/m). The intensity of the electric field decreases with<br />
distance from the field source.<br />
Magnetic Fields<br />
A magnetic field is an invisible force field created as a<br />
consequence of the movement of electric charges (flow<br />
of electricity). The magnitude (intensity) of a magnetic<br />
field is measured Tesla (T or in mT).The intensity of the<br />
field decreases with distance from the field source.<br />
4. Documentation<br />
Potential information sources include the reporting<br />
organization’s legal and sales departments as well as the<br />
documentation collected through quality management<br />
systems.<br />
5. References<br />
• OECD Guidelines for Multinational Enterprises,<br />
Revision 2000.<br />
EU<br />
EU<br />
EU<br />
Version 3.0/EUSS Final Version<br />
IP<br />
&<br />
EUSS<br />
EU<br />
5
IP<br />
&<br />
EUSS<br />
Indicator Protocols Set: PR<br />
EU25: Number of injuries and fatalities<br />
to the public involving company assets<br />
including legal judgments, settlements<br />
and pending legal cases of diseases.<br />
1. Relevance<br />
Activities of electric utilities and electricity itself<br />
can sometimes be associated with public injuries,<br />
diseases or fatalities. This indicator helps the reporting<br />
organization to be transparent around the health<br />
impact it has on the society and indicates the reporting<br />
organization’s commitment to health and safety of the<br />
public.<br />
2. Compilation<br />
2.1 Report the number of individuals affected by<br />
injuries and fatalities involving company assets.<br />
<strong>Electric</strong> Utility <strong>Sector</strong> <strong>Supplement</strong><br />
EU<br />
2.2 Report the annual number of health and safety<br />
related legal cases (resolved and pending),<br />
including diseases and judgments affecting<br />
members of the public and the potential risks<br />
associated with these cases.<br />
3. Definitions<br />
Resolved and pending cases<br />
Resolved and legally pending cases of diseases refer to<br />
cases that have been taken to court and have been filed<br />
publicly.<br />
4. Documentation<br />
Legal and Health and Safety Departments.<br />
5. References<br />
None.<br />
EU<br />
6<br />
©2000-2009 GRI
EU26: Percentage of population<br />
unserved in licensed distribution or<br />
service areas.<br />
1. Relevance<br />
It is universally accepted that electricity improves quality<br />
of life. This indicator provides a measure of the extent<br />
of electricification. There are cases when a percentage<br />
of the population is not provided with electricity<br />
even though they are in a distribution area. Reasons<br />
for this can include poor transmission or distribution<br />
infrastructure and widely distributed and/or isolated<br />
populations.<br />
Indicator Protocols Set: PR<br />
IP<br />
&<br />
EUSS<br />
This indicator is intended to be reported by<br />
organizations with distribution operations.<br />
2. Compilation<br />
2.1 Identify areas and population within licensed<br />
distribution area where a distribution network or<br />
off-grid alternatives are absent, by rural and urban<br />
areas. Provide assumptions for estimating overall<br />
and unserved population.<br />
2.2 Report estimated percentage of population<br />
unserved based on total population within<br />
licensed distribution or service area.<br />
EU<br />
EU<br />
3. Definitions<br />
Licensed Distribution Areas<br />
Licensed distribution areas contain networks, owned/<br />
operated by licensed operators, which carry electricity to<br />
the customer in which the operator has the concession<br />
or monopoly.<br />
Unserved population<br />
Those who live in an area where electricity infrastructure<br />
is not available.<br />
4. Documentation<br />
Census documentation, number of residential accounts,<br />
grid coverage data.<br />
5. References<br />
None.<br />
Version 3.0/EUSS Final Version<br />
7
IP<br />
&<br />
EUSS<br />
Indicator Protocols Set: PR<br />
EU27: Number of residential<br />
disconnections for non-payment, broken<br />
down by duration of disconnection and<br />
by regulatory regime.<br />
1. Relevance<br />
There are cases when people do not pay for their<br />
residential electricity for a variety of different reasons. In<br />
such cases electricity companies may disconnect those<br />
customers from the grid until the arrangements for the<br />
payment have been made.<br />
<strong>Electric</strong> Utility <strong>Sector</strong> <strong>Supplement</strong><br />
EU<br />
The length of time a household is without electricity,<br />
as well as the speed at which electric utilities reconnect<br />
following payment arrangements, can have a significant<br />
impact on health, safety and/or standards of living.<br />
2. Compilation<br />
2.1 Report number of customers broken down by<br />
total length of time between disconnection<br />
and arrangement of payment following five<br />
categories: 1year.<br />
2.2 Report number of customers broken down by<br />
total length of time between arrangement of<br />
payment and reconnection following three<br />
categories: week.<br />
EU<br />
3. Definitions<br />
None.<br />
4. Documentation<br />
None.<br />
5. References<br />
Regulatory Regime<br />
A regulatory regime is defined as a local, sub-national,<br />
national or regional area where there is a common<br />
regulatory framework.<br />
8<br />
©2000-2009 GRI
EU28: Power outage frequency.<br />
1. Relevance<br />
An electric utility should provide quality service with<br />
uninterrupted power supply and consistent voltage. In<br />
some cases, electricity cannot be provided continuously<br />
and power outages can occur.<br />
2. Compilation<br />
2.1 Refer to IEEE Standard 1366-2003 for compilation<br />
details.<br />
Indicator Protocols Set: PR<br />
IP<br />
&<br />
EUSS<br />
2.2 Report System Average Interruption Frequency<br />
Index (SAIFI) over the course of the year.<br />
3. Definitions<br />
System Average Interruption Frequency Index<br />
(SAIFI)<br />
SAIFI is the average number of interruptions that a<br />
customer would experience and is measured in units<br />
of interruptions per customer. It demonstrates the<br />
reliability of the reporting organization’s supply. SAIFI =<br />
(total number of customer interruptions) / (total number<br />
of customers served).<br />
It is usually measured over the course of a year.<br />
Power Outage<br />
A power outage (also known as a power cut, power<br />
failure, power loss, blackout or interruption) is the loss of<br />
electricity supply to an area.<br />
4. Documentation<br />
None.<br />
5. References<br />
• IEEE Standard 1366-2003.<br />
EU<br />
EU<br />
Version 3.0/EUSS Final Version<br />
9
IP<br />
&<br />
EUSS<br />
Indicator Protocols Set: PR<br />
EU29: Average power outage duration.<br />
1. Relevance<br />
This indicator is linked to EU28. An electric utility should<br />
provide quality service with uninterrupted power<br />
supply and consistent voltage. In some cases, electricity<br />
cannot be provided continuously and power outages<br />
can occur. Duration demonstrates the ability of a utility<br />
to restore power in a timely manner.<br />
2. Compilation<br />
2.1 Refer to IEEE Standard 1366-2003 for compilation<br />
details.<br />
<strong>Electric</strong> Utility <strong>Sector</strong> <strong>Supplement</strong><br />
2.2 Report System Average Interruption Duration<br />
Index (SAIDI) over the course of the year.<br />
3. Definitions<br />
System Average Interruption Duration Index<br />
(SAIDI)<br />
SAIDI is the average outage duration for each customer<br />
served, and is measured in units of time, often minutes<br />
or hours.<br />
EU<br />
SAIDI = (sum of all customer interruption duration) /<br />
(total number of customers served).<br />
It is usually measured over the course of a year.<br />
EU<br />
Power Outage<br />
A power outage (also known as a power cut, power<br />
failure, power loss, blackout or interruption) is the loss<br />
of the electricity supply to an area.<br />
Duration<br />
Duration refers to the period of time between the<br />
beginning of the interruption and the return of the<br />
electricity supply.<br />
4. Documentation<br />
None.<br />
5. References<br />
• IEEE Standard 1366-2003.<br />
10<br />
©2000-2009 GRI
Indicator Protocols Set: PR<br />
IP<br />
&<br />
EUSS<br />
EU30: Average plant availability factor by<br />
energy source and by regulatory regime<br />
1. Relevance<br />
Generation plants do not operate all the time because<br />
planned and unplanned outages occur. These outages<br />
can result from maintenance and operational issues.<br />
Unplanned outages have financial implications since<br />
preferred generation capacity is often replaced by less<br />
efficient and more expensive plant.<br />
2. Compilation<br />
2.1 Identify the number of hours of planned outage<br />
(An outage scheduled well in advance (at least two<br />
weeks) of the actual outage).<br />
2.2 Identify number of hours of forced outage<br />
(Unplanned outage that requires the plant to be<br />
taken out of service immediately or before the next<br />
planned outage).<br />
2.3 Report the average availability factor by energy<br />
source and by regulatory regime.<br />
3. Definitions<br />
Availability Factor<br />
The availability factor of a power plant is the amount of<br />
time that it is able to produce electricity over a certain<br />
period, divided by the amount of the time in the period.<br />
Occasions where only partial capacity is available may or<br />
may not be deducted. The availability factor should not<br />
be confused with the capacity factor. Availability factor<br />
(%) = (Total hours of plant in operation during the period<br />
x 100) / Total length of period (hours).<br />
4. Documentation<br />
Operations department.<br />
5. References<br />
International Geothermal Association.<br />
EU<br />
EU<br />
Version 3.0/EUSS Final Version<br />
11
IP<br />
&<br />
EUSS<br />
EU<br />
Indicator Protocols Set: PR<br />
PR2 Total number of incidents of<br />
non-compliance with regulations and<br />
voluntary codes concerning the health<br />
and safety impacts of products and<br />
services during their life cycle, by type of<br />
outcomes.<br />
1. Relevance<br />
Protection of health and safety is a recognized goal<br />
of many national and international regulations.<br />
Failing to comply with legal requirements indicates<br />
either inadequate internal management systems and<br />
procedures, or lack of implementation. In addition to<br />
direct financial consequences, ongoing compliance<br />
failure poses increased financial risk due to damage<br />
to both reputation and employee motivation. For<br />
an organization, the number of incidents of noncompliance<br />
should remain as low as possible. The trends<br />
revealed by this Indicator will indicate improvements or<br />
deterioration in the effectiveness of internal controls.<br />
2. Compilation<br />
2.1 This Indicator addresses the life cycle of the<br />
product or service once it is available for use and<br />
therefore subject to regulations concerning the<br />
health and safety of products and services.<br />
2.2 Where the reporting organization has not<br />
identified any non-compliance with regulations<br />
and voluntary codes, a brief statement to this fact<br />
is sufficient.<br />
2.6 Report the total number of incidents of noncompliance<br />
with the health and safety of products<br />
and services, broken down by:<br />
• Incidents of non-compliance with regulations<br />
resulting in a fine or penalty;<br />
• Incidents of non-compliance with regulations<br />
resulting in a warning; and<br />
• Incidents of non-compliance with voluntary<br />
codes.<br />
3. Definitions<br />
None.<br />
4. Documentation<br />
Potential information sources include the reporting<br />
organization’s legal and R&D departments as well as<br />
documentation collected through quality management<br />
systems.<br />
5. References<br />
None.<br />
2.3 Identify the total number of incidents of noncompliance<br />
with regulations and voluntary codes<br />
concerning the health and safety of products and<br />
services during the reporting period.<br />
2.4 This Indicator refers to incidents of non-compliance<br />
within the reporting period. If a substantial number<br />
of incidents relate to events in preceding years, this<br />
should be indicated.<br />
2.5 Incidents of non-compliance in which the<br />
organization was determined not to be at fault are<br />
not counted in this Indicator.<br />
12<br />
©2000-2009 GRI
PR3 Type of product and service<br />
information required by procedures,<br />
and percentage of significant products<br />
and services subject to such information<br />
requirements.<br />
1. Relevance<br />
Accessible and adequate information on the<br />
sustainability impacts of products and services (positive<br />
and negative) is necessary for customers and end users<br />
to make informed purchasing choices, and for these<br />
preferences to be reflected in the market. Providing<br />
appropriate information and labeling with respect to<br />
sustainability impacts is directly linked to compliance<br />
with certain types of regulations and codes (such as<br />
national laws or the OECD Guidelines for Multinational<br />
Enterprises) and, potentially, with strategies for brand<br />
and market differentiation. This measure provides an<br />
indication of the degree to which information and<br />
labeling addresses a product’s or a service’s impact on<br />
sustainability.<br />
2. Compilation<br />
2.1 Report whether the following product and service<br />
information is required by the organization’s<br />
procedures for product and service information<br />
and labeling:<br />
3. Definitions<br />
None.<br />
4. Documentation<br />
Indicator Protocols Set: PR<br />
Potential information sources include legal and sales<br />
departments and the documentation collected through<br />
quality management systems.<br />
5. References<br />
• OECD Guidelines for Multinational Enterprises,<br />
Revision 2000.<br />
IP<br />
&<br />
EUSS<br />
EU<br />
yes<br />
no<br />
The sourcing of components<br />
of the product or service<br />
Content, particularly with<br />
regard to substances that<br />
might produce an environmental<br />
or social impact<br />
Safe use of the product or<br />
service<br />
Disposal of the product and<br />
environmental/social impacts<br />
Other (explain)<br />
2.2 Report the percentage of significant product or<br />
service categories covered by and assessed for<br />
compliance with such procedures.<br />
Version 3.0/EUSS Final Version<br />
13
IP<br />
&<br />
EUSS<br />
EU<br />
Indicator Protocols Set: PR<br />
PR4 Total number of incidents of<br />
non-compliance with regulations and<br />
voluntary codes concerning product and<br />
service information and labeling, by type<br />
of outcomes.<br />
1. Relevance<br />
The display and provision of information and labeling for<br />
products and services are subject to many regulations<br />
and laws. Non-compliance indicates either inadequate<br />
internal management systems and procedures or<br />
ineffective implementation. In addition to direct<br />
financial consequences, such as penalties and fines,<br />
non-compliance poses a risk to reputation and customer<br />
loyalty and satisfaction. An organization’s incidents<br />
of non-compliance should remain as low as possible.<br />
The trends revealed by this Indicator can indicate<br />
improvements or deterioration in the effectiveness of<br />
internal controls.<br />
2. Compilation<br />
2.1 This Indicator refers to incidents of noncompliance<br />
decided within the reporting period. If<br />
a substantial number of incidents relate to events<br />
in preceding years, this should be indicated.<br />
2.2 Where the reporting organization has not<br />
identified any non-compliance with regulations<br />
and voluntary codes, a brief statement to this fact<br />
is sufficient.<br />
2.5 Report the total number of incidents of noncompliance<br />
with regulations concerning product<br />
and service information and labeling, broken down<br />
by:<br />
• Incidents of non-compliance with regulations<br />
resulting in a fine or penalty;<br />
• Incidents of non-compliance with regulations<br />
resulting in a warning; and<br />
• Incidents of non-compliance with voluntary<br />
codes.<br />
3. Definitions<br />
None.<br />
4. Documentation<br />
Potential information sources include the reporting<br />
organization’s legal and technical departments as well as<br />
documentation collected through quality management<br />
systems.<br />
5. References<br />
None.<br />
2.3 Identify the total number of incidents of noncompliance<br />
with regulations and voluntary codes<br />
concerning product and service information and<br />
labeling during the reporting period.<br />
2.4 Incidents of non-compliance in which the<br />
organization was determined not to be at fault are<br />
not counted in this Indicator.<br />
14<br />
©2000-2009 GRI
PR5 Practices related to customer<br />
satisfaction, including results of surveys<br />
measuring customer satisfaction.<br />
1. Relevance<br />
Customer satisfaction is one measure of an organization’s<br />
sensitivity to its customers’ needs and, from an<br />
organizational perspective, is essential for long-term<br />
success. In the context of sustainability, customer<br />
satisfaction provides insight into how the organization<br />
approaches its relationship with one stakeholder group<br />
(customers). It can also be used in combination with other<br />
sustainability measures. Used in combination, customer<br />
satisfaction can provide insights into the degree to which<br />
an organization considers the needs of other stakeholders.<br />
2. Compilation<br />
2.1 Report on organization-wide practices in place to<br />
assess and maintain customer satisfaction, such as:<br />
3. Definitions<br />
None.<br />
4. Documentation<br />
Indicator Protocols Set: PR<br />
Potential information sources include the reporting<br />
organization’s customer relations and R&D departments.<br />
5. References<br />
None.<br />
IP<br />
&<br />
EUSS<br />
• Frequency of measuring customer satisfaction;<br />
• Standard requirements regarding<br />
methodologies of surveys; and<br />
• Mechanisms for customers to provide<br />
feedback.<br />
EU<br />
2.2 Report the results or key conclusions of surveys<br />
(based on statistically relevant sample sizes)<br />
conducted in the reporting period that were<br />
related to information about:<br />
• The organization as a whole;<br />
• A major product/service category; or<br />
• Significant locations of operation.<br />
2.3 For any survey results reported, identify the<br />
product/service category or locations of operations<br />
to which they apply.<br />
Version 3.0/EUSS Final Version<br />
15
IP<br />
&<br />
EUSS<br />
Indicator Protocols Set: PR<br />
PR6 Programs for adherence to laws,<br />
standards, and voluntary codes related<br />
to marketing communications, including<br />
advertising, promotion, and sponsorship.<br />
1. Relevance<br />
Marketing communications are designed to influence<br />
opinions and purchasing decisions. Marketing<br />
communications that do not conform to generally<br />
accepted ethical or cultural standards, privacy intrusion,<br />
dual standards, or attempts to influence vulnerable<br />
audiences such as children, can be a significant issue<br />
for stakeholders, as shown by the growth of consumer<br />
activism. Marketing approaches that are seen as<br />
inappropriate can incur risks for organizations, including<br />
alienation of customers and other stakeholders, damage<br />
to reputation, financial costs, and legislative action.<br />
3. Definitions<br />
None.<br />
4. Documentation<br />
Potential information sources include the reporting<br />
organization’s legal, sales, and marketing departments.<br />
5. References<br />
• International Chamber of Commerce<br />
recommendations (i.e., the ICC International Code of<br />
Advertising Practice) and related codes of conduct.<br />
• OECD Guidelines for Multinational Enterprises,<br />
Revision 2000.<br />
EU<br />
In addition to frameworks of national or international<br />
law, voluntary and self-regulatory codes (such as the ICC<br />
International Code of Advertising Practice or the OECD<br />
Guidelines for Multinational Enterprises) seek to express<br />
concepts of responsibility in marketing communications.<br />
The adoption of such self-disciplinary codes or rules can<br />
assist organizations in ensuring that their marketing<br />
communications practices conform to generally<br />
accepted standards.<br />
2. Compilation<br />
2.1 Report any codes or voluntary standards relating<br />
to marketing communications applied across the<br />
organization.<br />
2.2 Report the frequency with which the organization<br />
reviews its compliance with these standards or codes.<br />
2.3 Report whether the organization sells products<br />
that are:<br />
• Banned in certain markets; or<br />
• The subject of stakeholder questions or public<br />
debate.<br />
2.4 Report how the organization has responded to<br />
questions or concerns regarding these products.<br />
16<br />
©2000-2009 GRI
PR7 Total number of incidents of<br />
non-compliance with regulations and<br />
voluntary codes concerning marketing<br />
communications, including advertising,<br />
promotion, and sponsorship, by type of<br />
outcomes.<br />
1. Relevance<br />
Non-compliance indicates either inadequate internal<br />
management systems and procedures or ineffective<br />
implementation. In addition to direct financial<br />
consequences such as penalties and fines, noncompliance<br />
poses a risk to reputation and customer<br />
loyalty and satisfaction. An organization’s incidents<br />
of non-compliance should remain as low as possible.<br />
The trends revealed by this Indicator can indicate<br />
improvements or deterioration in the effectiveness of<br />
internal controls.<br />
2. Compilation<br />
2.1 This Indicator refers to incidents of non-compliance<br />
within the reporting period. If a substantial number<br />
of incidents relate to events in preceding years, this<br />
should be indicated.<br />
2.2 Where the reporting organization has not identified<br />
any non-compliance with regulations and voluntary<br />
codes, a brief statement to this fact is sufficient.<br />
3. Definitions<br />
None.<br />
Indicator Protocols Set: PR<br />
4. Documentation<br />
Potential information sources include the reporting<br />
organization’s legal, sales, and marketing departments.<br />
5. References<br />
None.<br />
IP<br />
&<br />
EUSS<br />
EU<br />
2.3 Identify the total number of incidents of noncompliance<br />
with regulations concerning marketing<br />
communications during the reporting period.<br />
2.4 Incidents of non-compliance in which the<br />
organization was determined not to be at fault are<br />
not counted in this Indicator.<br />
2.5 Report the total number of incidents of noncompliance<br />
with regulations concerning marketing<br />
communications, broken down by:<br />
• Incidents of non-compliance with regulations<br />
resulting in a fine or penalty;<br />
• Incidents of non-compliance with regulations<br />
resulting in a warning; and<br />
• Incidents of non-compliance with voluntary<br />
codes.<br />
Version 3.0/EUSS Final Version<br />
17
IP<br />
&<br />
EUSS<br />
EU<br />
Indicator Protocols Set: PR<br />
PR8 Total number of substantiated<br />
complaints regarding breaches of<br />
customer privacy and losses of customer<br />
data.<br />
1. Relevance<br />
Protection of customer privacy is a generally recognized<br />
goal in national regulations and organizational policies.<br />
Non-compliance indicates either inadequate internal<br />
management systems and procedures or ineffective<br />
implementation. This Indicator provides an evaluation<br />
of the success of management systems and procedures<br />
relating to customer privacy protection. In addition to<br />
direct financial consequences such as penalties and fines,<br />
non-compliance poses a risk to reputation and customer<br />
loyalty and satisfaction. An organization’s incidents<br />
of non-compliance should remain as low as possible.<br />
The trends revealed by this Indicator can indicate<br />
improvements or deterioration in the effectiveness of<br />
internal controls.<br />
2. Compilation<br />
2.1 Identify the total number of complaints regarding<br />
breaches of customer privacy during the reporting<br />
period.<br />
2.2 If a substantial number of these breaches relate to<br />
events in preceding years, this should be indicated.<br />
2.3 Report the total number of substantiated<br />
complaints received concerning breaches of<br />
customer privacy, categorized by:<br />
3. Definitions<br />
Breach of customer privacy<br />
Covers any non-compliance with existing legal<br />
regulations and (voluntary) standards of which the<br />
reporting organization is a member regarding the<br />
protection of customer privacy.<br />
Substantiated complaint<br />
Written statement by regulatory or similar official body<br />
addressed to the reporting organization that identifies<br />
breaches of customer privacy, or a complaint lodged<br />
with the organization that has been recognized as<br />
legitimate by the organization.<br />
4. Documentation<br />
Information can be drawn from departments responsible<br />
for customer service, public relations, and/or legal<br />
concerns.<br />
5. References<br />
None.<br />
• Complaints received from outside parties and<br />
substantiated by the organization; and<br />
• Complaints from regulatory bodies.<br />
2.4 Report the total number of identified leaks, thefts,<br />
or losses of customer data.<br />
2.5 Where the reporting organization has not<br />
identified any substantiated complaints, a brief<br />
statement to this fact is sufficient.<br />
18<br />
©2000-2009 GRI
PR9 Monetary value of significant<br />
fines for non-compliance with laws and<br />
regulations concerning the provision and<br />
use of products and services.<br />
1. Relevance<br />
The level of non-compliance within an organization is<br />
an indicator of the ability of management to ensure that<br />
operations conform to certain performance parameters.<br />
From an economic perspective, ensuring compliance<br />
helps to reduce financial risks that occur either<br />
directly through fines or indirectly through impacts on<br />
reputation. The strength of an organization’s compliance<br />
record can also affect its ability to expand operations or<br />
gain permits.<br />
2. Compilation<br />
2.1 Identify administrative or judicial sanctions levied<br />
against the organization for failure to comply<br />
with laws or regulations, including international<br />
declarations/conventions/ treaties, and national,<br />
sub-national, regional, and local regulations<br />
concerning the provision and use of the reporting<br />
organization’s products and services. Relevant<br />
information for this Indicator includes but is not<br />
limited to data from PR2, PR4, and PR7.<br />
2.2 Report total monetary value of significant fines.<br />
Indicator Protocols Set: PR<br />
IP<br />
&<br />
EUSS<br />
EU<br />
2.3 Where the reporting organization has not<br />
identified any non-compliance with laws or<br />
regulations, a brief statement to this fact is<br />
sufficient.<br />
3. Definitions<br />
None.<br />
4. Documentation<br />
Data sources include audit results or regulatory tracking<br />
systems operated by the legal department. Information<br />
regarding monetary fines can be found in accounting<br />
departments.<br />
5. References<br />
None.<br />
Version 3.0/EUSS Final Version<br />
19