CRANFIELD UNIVERSITY Eleni Anthippi Chatzimichali ...
CRANFIELD UNIVERSITY Eleni Anthippi Chatzimichali ...
CRANFIELD UNIVERSITY Eleni Anthippi Chatzimichali ...
You also want an ePaper? Increase the reach of your titles
YUMPU automatically turns print PDFs into web optimized ePapers that Google loves.
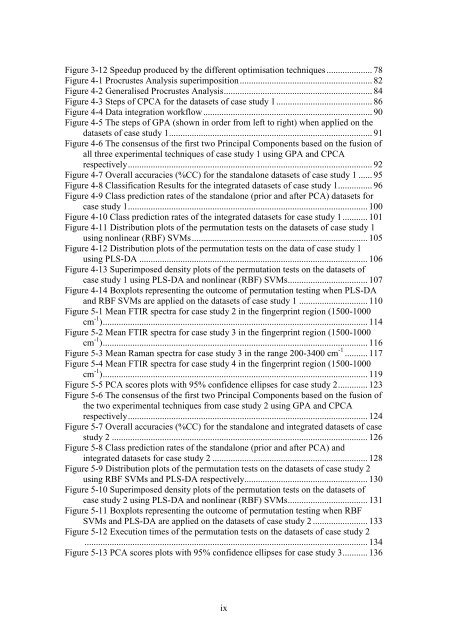
Figure 3-12 Speedup produced by the different optimisation techniques .................... 78<br />
Figure 4-1 Procrustes Analysis superimposition .......................................................... 82<br />
Figure 4-2 Generalised Procrustes Analysis ................................................................. 84<br />
Figure 4-3 Steps of CPCA for the datasets of case study 1 .......................................... 86<br />
Figure 4-4 Data integration workflow .......................................................................... 90<br />
Figure 4-5 The steps of GPA (shown in order from left to right) when applied on the<br />
datasets of case study 1 ......................................................................................... 91<br />
Figure 4-6 The consensus of the first two Principal Components based on the fusion of<br />
all three experimental techniques of case study 1 using GPA and CPCA<br />
respectively ........................................................................................................... 92<br />
Figure 4-7 Overall accuracies (%CC) for the standalone datasets of case study 1 ...... 95<br />
Figure 4-8 Classification Results for the integrated datasets of case study 1............... 96<br />
Figure 4-9 Class prediction rates of the standalone (prior and after PCA) datasets for<br />
case study 1 ......................................................................................................... 100<br />
Figure 4-10 Class prediction rates of the integrated datasets for case study 1 ........... 101<br />
Figure 4-11 Distribution plots of the permutation tests on the datasets of case study 1<br />
using nonlinear (RBF) SVMs ............................................................................. 105<br />
Figure 4-12 Distribution plots of the permutation tests on the data of case study 1<br />
using PLS-DA .................................................................................................... 106<br />
Figure 4-13 Superimposed density plots of the permutation tests on the datasets of<br />
case study 1 using PLS-DA and nonlinear (RBF) SVMs ................................... 107<br />
Figure 4-14 Boxplots representing the outcome of permutation testing when PLS-DA<br />
and RBF SVMs are applied on the datasets of case study 1 .............................. 110<br />
Figure 5-1 Mean FTIR spectra for case study 2 in the fingerprint region (1500-1000<br />
cm -1 ) .................................................................................................................... 114<br />
Figure 5-2 Mean FTIR spectra for case study 3 in the fingerprint region (1500-1000<br />
cm -1 ) .................................................................................................................... 116<br />
Figure 5-3 Mean Raman spectra for case study 3 in the range 200-3400 cm -1 .......... 117<br />
Figure 5-4 Mean FTIR spectra for case study 4 in the fingerprint region (1500-1000<br />
cm -1 ) .................................................................................................................... 119<br />
Figure 5-5 PCA scores plots with 95% confidence ellipses for case study 2 ............. 123<br />
Figure 5-6 The consensus of the first two Principal Components based on the fusion of<br />
the two experimental techniques from case study 2 using GPA and CPCA<br />
respectively ......................................................................................................... 124<br />
Figure 5-7 Overall accuracies (%CC) for the standalone and integrated datasets of case<br />
study 2 ................................................................................................................ 126<br />
Figure 5-8 Class prediction rates of the standalone (prior and after PCA) and<br />
integrated datasets for case study 2 .................................................................... 128<br />
Figure 5-9 Distribution plots of the permutation tests on the datasets of case study 2<br />
using RBF SVMs and PLS-DA respectively ...................................................... 130<br />
Figure 5-10 Superimposed density plots of the permutation tests on the datasets of<br />
case study 2 using PLS-DA and nonlinear (RBF) SVMs ................................... 131<br />
Figure 5-11 Boxplots representing the outcome of permutation testing when RBF<br />
SVMs and PLS-DA are applied on the datasets of case study 2 ........................ 133<br />
Figure 5-12 Execution times of the permutation tests on the datasets of case study 2<br />
............................................................................................................................ 134<br />
Figure 5-13 PCA scores plots with 95% confidence ellipses for case study 3 ........... 136<br />
ix


