Spectral characteristics of ultrashort pulses in Kerr-lens - TU Wien
Spectral characteristics of ultrashort pulses in Kerr-lens - TU Wien
Spectral characteristics of ultrashort pulses in Kerr-lens - TU Wien

You also want an ePaper? Increase the reach of your titles
YUMPU automatically turns print PDFs into web optimized ePapers that Google loves.
a<br />
group-delay 2<br />
dispersion, fs<br />
0<br />
-100<br />
-200<br />
-300<br />
spectral power, a.u.<br />
1<br />
800 850<br />
b<br />
nm<br />
0.5<br />
0<br />
800 850<br />
nm<br />
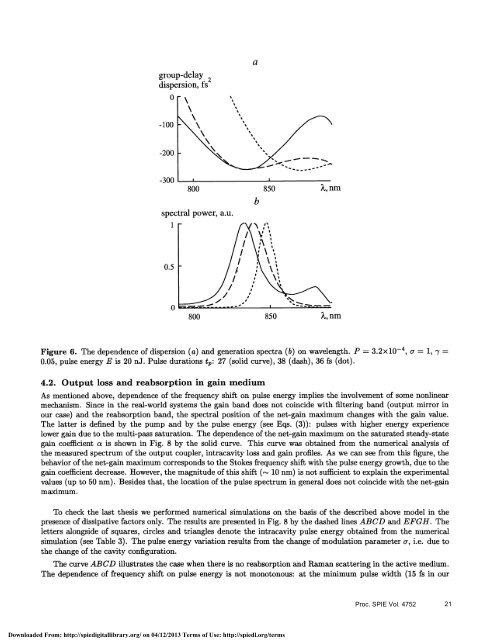
Figure 6. The dependence <strong>of</strong> dispersion (a) and generation spectra (b) on wavelength. P = 3.2x10⁴, a = 1, 'y =<br />
0.05, pulse energy E is 20 nJ. Pulse durations t: 27 (solid curve), 38 (dash), 36 fs (dot).<br />
4.2. Output loss and reabsorption <strong>in</strong> ga<strong>in</strong> medium<br />
As mentioned above, dependence <strong>of</strong> the frequency shift on pulse energy implies the <strong>in</strong>volvement <strong>of</strong> some nonl<strong>in</strong>ear<br />
mechanism. S<strong>in</strong>ce <strong>in</strong> the real-world systems the ga<strong>in</strong> band does not co<strong>in</strong>cide with filter<strong>in</strong>g band (output mirror <strong>in</strong><br />
our case) and the reabsorption band, the spectral position <strong>of</strong> the net-ga<strong>in</strong> maximum changes with the ga<strong>in</strong> value.<br />
The latter is def<strong>in</strong>ed by the pump and by the pulse energy (see Eqs. (3)): <strong>pulses</strong> with higher energy experience<br />
lower ga<strong>in</strong> due to the multi-pass saturation. The dependence <strong>of</strong> the net-ga<strong>in</strong> maximum on the saturated steady-state<br />
ga<strong>in</strong> coefficient a is shown <strong>in</strong> Fig. 8 by the solid curve. This curve was obta<strong>in</strong>ed from the numerical analysis <strong>of</strong><br />
the measured spectrum <strong>of</strong> the output coupler, <strong>in</strong>tracavity loss and ga<strong>in</strong> pr<strong>of</strong>iles. As we can see from this figure, the<br />
behavior <strong>of</strong> the net-ga<strong>in</strong> maximum corresponds to the Stokes frequency shift with the pulse energy growth, due to the<br />
ga<strong>in</strong> coefficient decrease. However, the magnitude <strong>of</strong> this shift (rs 10 nm) is not sufficient to expla<strong>in</strong> the experimental<br />
values (up to 50 nm). Besides that, the location <strong>of</strong> the pulse spectrum <strong>in</strong> general does not co<strong>in</strong>cide with the net-ga<strong>in</strong><br />
maximum.<br />
To check the last thesis we performed numerical simulations on the basis <strong>of</strong> the described above model <strong>in</strong> the<br />
presence <strong>of</strong> dissipative factors only. The results are presented <strong>in</strong> Fig. 8 by the dashed l<strong>in</strong>es ABCD and EFGH. The<br />
letters alongside <strong>of</strong> squares, circles and triangles denote the <strong>in</strong>tracavity pulse energy obta<strong>in</strong>ed from the numerical<br />
simulation (see Table 3). The pulse energy variation results from the change <strong>of</strong> modulation parameter a, i.e. due to<br />
the change <strong>of</strong> the cavity configuration.<br />
The curve ABCD illustrates the case when there is no reabsorption and Raman scatter<strong>in</strong>g <strong>in</strong> the active medium.<br />
The dependence <strong>of</strong> frequency shift on pulse energy is not monotonous: at the m<strong>in</strong>imum pulse width (15 fs <strong>in</strong> our<br />
Proc. SPIE Vol. 4752 21<br />
Downloaded From: http://spiedigitallibrary.org/ on 04/12/2013 Terms <strong>of</strong> Use: http://spiedl.org/terms