

Etudes et évaluation de processus océaniques par des hiérarchies ...
Etudes et évaluation de processus océaniques par des hiérarchies ...
Etudes et évaluation de processus océaniques par des hiérarchies ...

You also want an ePaper? Increase the reach of your titles
YUMPU automatically turns print PDFs into web optimized ePapers that Google loves.
66 CHAPITRE 4. ETUDES DE PROCESSUS OCÉANOGRAPHIQUES<br />
2000] Wirth: Param<strong>et</strong>erization of baroclinic instability<br />
577<br />
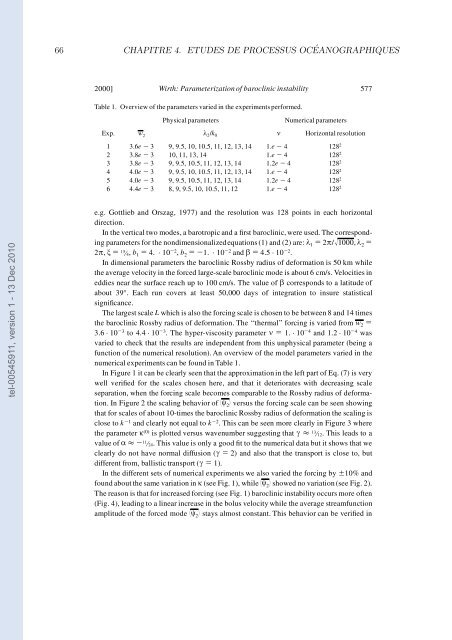
Table 1. Overview of the <strong>par</strong>am<strong>et</strong>ers varied in the experimentsperformed.<br />
Exp.<br />
Physical <strong>par</strong>am<strong>et</strong>ers<br />
Numerical <strong>par</strong>am<strong>et</strong>ers<br />
w 2 l 2 /k 0 n Horizontal resolution<br />
1 3.6e 2 3 9, 9.5, 10, 10.5, 11, 12, 13, 14 1.e 2 4 128 2<br />
2 3.8e 2 3 10, 11, 13, 14 1.e 2 4 128 2<br />
3 3.8e 2 3 9, 9.5, 10.5, 11, 12, 13, 14 1.2e 2 4 128 2<br />
4 4.0e 2 3 9, 9.5, 10, 10.5, 11, 12, 13, 14 1.e 2 4 128 2<br />
5 4.0e 2 3 9, 9.5, 10.5, 11, 12, 13, 14 1.2e 2 4 128 2<br />
6 4.4e 2 3 8, 9, 9.5, 10, 10.5, 11, 12 1.e 2 4 128 2<br />
tel-00545911, version 1 - 13 Dec 2010<br />
e.g. Gottlieb and Orszag, 1977) and the resolution was 128 points in each horizontal<br />
direction.<br />
In the vertical two mo<strong>de</strong>s, a barotropic and a rst baroclinic, were used. The corresponding<br />
<strong>par</strong>am<strong>et</strong>ers for the nondimensionalize<strong>de</strong>quations (1) and (2) are: l 1 5 2p/Î1000, l 2 5<br />
2p, j 5 15 4, b 1 5 4. · 10 22 , b 2 5 21. · 10 22 and b 5 4.5 · 10 22 .<br />
In dimensional <strong>par</strong>am<strong>et</strong>ers the baroclinic Rossby radius of <strong>de</strong>formation is 50 km while<br />
the average velocity in the forced large-scale baroclinic mo<strong>de</strong> is about 6 cm/s. Velocities in<br />
eddies near the surface reach up to 100 cm/s. The value of b corresponds to a latitu<strong>de</strong> of<br />
about 39°. Each run covers at least 50,000 days of integration to insure statistical<br />
signicance.<br />
The largest scale L which is also the forcing scale is chosen to be b<strong>et</strong>ween 8 and 14 times<br />
the baroclinic Rossby radius of <strong>de</strong>formation. The ‘‘thermal’’ forcing is varied from w 2 5<br />
3.6 · 10 23 to 4.4 · 10 23 . The hyper-viscosity <strong>par</strong>am<strong>et</strong>er n 5 1. · 10 24 and 1.2 · 10 24 was<br />
varied to check that the results are in<strong>de</strong>pen<strong>de</strong>nt from this unphysical <strong>par</strong>am<strong>et</strong>er (being a<br />
function of the numerical resolution). An overview of the mo<strong>de</strong>l <strong>par</strong>am<strong>et</strong>ers varied in the<br />
numerical experiments can be found in Table 1.<br />
In Figure 1 it can be clearly seen that the approximation in the left <strong>par</strong>t of Eq. (7) is very<br />
well veried for the scales chosen here, and that it d<strong>et</strong>eriorates with <strong>de</strong>creasing scale<br />
se<strong>par</strong>ation, when the forcing scale becomes com<strong>par</strong>able to the Rossby radius of <strong>de</strong>formation.<br />
In Figure 2 the scaling behavior of 7c 2 8 versus the forcing scale can be seen showing<br />
that for scales of about 10-times the baroclinic Rossby radius of <strong>de</strong>formation the scaling is<br />
close to k 21 and clearly not equal to k 22 . This can be seen more clearly in Figure 3 where<br />
the <strong>par</strong>am<strong>et</strong>er k (0) is plotted versus wavenumber suggesting that g < 13 12. This leads to a<br />
value of a < 2 11 24. This value is only a good t to the numerical data but it shows that we<br />
clearly do not have normal diffusion (g 5 2) and also that the transport is close to, but<br />
different from, ballistic transport (g 5 1).<br />
In the different s<strong>et</strong>s of numerical experiments we also varied the forcing by 610% and<br />
found about the same variation in k (see Fig. 1), while 7c 2 8 showed no variation (see Fig. 2).<br />
The reason is that for increased forcing (see Fig. 1) baroclinic instability occurs more often<br />
(Fig. 4), leading to a linear increase in the bolus velocity while the average streamfunction<br />
amplitu<strong>de</strong> of the forced mo<strong>de</strong> 7c 2 8 stays almost constant. This behavior can be veried in


