Ensaios Econômicos - Sistema de Bibliotecas da FGV - Fundação ...
Ensaios Econômicos - Sistema de Bibliotecas da FGV - Fundação ...
Ensaios Econômicos - Sistema de Bibliotecas da FGV - Fundação ...

You also want an ePaper? Increase the reach of your titles
YUMPU automatically turns print PDFs into web optimized ePapers that Google loves.
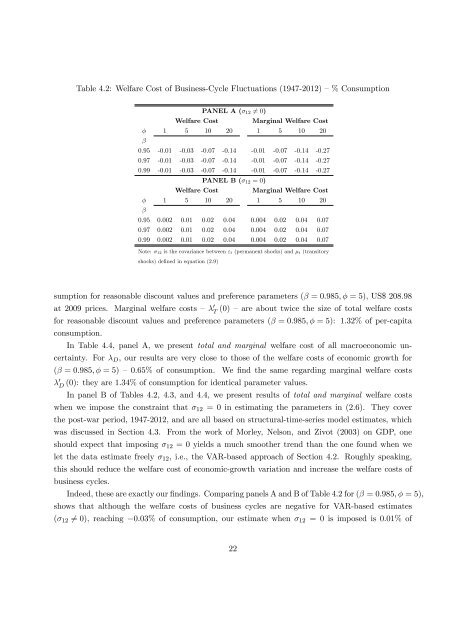
Table 4.2: Welfare Cost of Business-Cycle Fluctuations (1947-2012) –% Consumption<br />
PANEL A ( 12 6= 0)<br />
Welfare Cost<br />
Marginal Welfare Cost<br />
1 5 10 20 1 5 10 20<br />
<br />
0.95 -0.01 -0.03 -0.07 -0.14 -0.01 -0.07 -0.14 -0.27<br />
0.97 -0.01 -0.03 -0.07 -0.14 -0.01 -0.07 -0.14 -0.27<br />
0.99 -0.01 -0.03 -0.07 -0.14 -0.01 -0.07 -0.14 -0.27<br />
PANEL B ( 12 = 0)<br />
Welfare Cost<br />
Marginal Welfare Cost<br />
1 5 10 20 1 5 10 20<br />
<br />
0.95 0.002 0.01 0.02 0.04 0.004 0.02 0.04 0.07<br />
0.97 0.002 0.01 0.02 0.04 0.004 0.02 0.04 0.07<br />
0.99 0.002 0.01 0.02 0.04 0.004 0.02 0.04 0.07<br />
Note: 12 is the covariance between " t (permanent shocks) and t (transitory<br />
shocks) <strong>de</strong>…ned in equation (2.9)<br />
sumption for reasonable discount values and preference parameters ( = 0:985; = 5), US$ 208:98<br />
at 2009 prices. Marginal welfare costs – 0 T<br />
(0) – are about twice the size of total welfare costs<br />
for reasonable discount values and preference parameters ( = 0:985; = 5): 1:32% of per-capita<br />
consumption.<br />
In Table 4.4, panel A, we present total and marginal welfare cost of all macroeconomic uncertainty.<br />
For D , our results are very close to those of the welfare costs of economic growth for<br />
( = 0:985; = 5) – 0:65% of consumption. We …nd the same regarding marginal welfare costs<br />
0 D<br />
(0): they are 1:34% of consumption for i<strong>de</strong>ntical parameter values.<br />
In panel B of Tables 4.2, 4.3, and 4.4, we present results of total and marginal welfare costs<br />
when we impose the constraint that 12 = 0 in estimating the parameters in (2.6). They cover<br />
the post-war period, 1947-2012, and are all based on structural-time-series mo<strong>de</strong>l estimates, which<br />
was discussed in Section 4.3. From the work of Morley, Nelson, and Zivot (2003) on GDP, one<br />
should expect that imposing 12 = 0 yields a much smoother trend than the one found when we<br />
let the <strong>da</strong>ta estimate freely 12 , i.e., the VAR-based approach of Section 4.2. Roughly speaking,<br />
this should reduce the welfare cost of economic-growth variation and increase the welfare costs of<br />
business cycles.<br />
In<strong>de</strong>ed, these are exactly our …ndings. Comparing panels A and B of Table 4.2 for ( = 0:985; = 5),<br />
shows that although the welfare costs of business cycles are negative for VAR-based estimates<br />
( 12 6= 0), reaching 0:03% of consumption, our estimate when 12 = 0 is imposed is 0:01% of<br />
22