Download - ASLO
Download - ASLO
Download - ASLO

You also want an ePaper? Increase the reach of your titles
YUMPU automatically turns print PDFs into web optimized ePapers that Google loves.
1778 Notes<br />
Sample Points<br />
Along center Lines<br />
- 6.0<br />
- 5.0<br />
-4.0 h<br />
b<br />
E<br />
.2<br />
-3.0 .z<br />
2<br />
zi<br />
-2.0 z<br />
- 1.0<br />
ABCD<br />
0<br />
ABCD ABCD ABCD<br />
0.056 0.072 0.095<br />
Flow Rate (liters se’)<br />
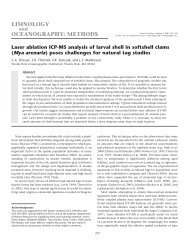
Fig. 12. Water motion vs. flow rate in culture tanks. Clod cards were attached to metal bars inserted into tanks<br />
holding the cards in positions A-D indicated on insert drawing. Water source was freshwater at 30°C and weight loss<br />
of the cards was converted to water motion using the temperature-corrected curve for freshwater in Table 2. Line<br />
connects the mean value of water motion in each tank at each flow rate.<br />
ABCD<br />
0.160<br />
_- 0<br />
( )<br />
l/3<br />
l- 1-k:<br />
= o.74$-J(yf)<br />
x [ lv&;J$JACl~e. (12)<br />
The following is a numerical example: if<br />
speed varied linearly from 16 to 4 cm s-l<br />
(mean, 10 cm s-l) over a 24-h period in 25°C<br />
seawater with a salinity of 35Y&, then for a clod<br />
card with AJ Wi = 1.38 cm* g- l, the predicted<br />
fraction dissolved from Eq. 12 is A W/ Wi =<br />
0.328. From the steady flow Eq. 8, this dissolution<br />
fraction would be expected for a constant<br />
speed of 9.87 cm s- l, a value differing<br />
from the average flow in this example by<br />
- 1.3%. As previously explained, significant<br />
errors can be expected for low rates of water<br />
motion because the cards cannot differentiate<br />
between dissolution caused by free or forced<br />
convection under such conditions.<br />
The usefulness of clod cards in measuring<br />
natural and induced water motion was tested.<br />
In addition to the reef water motion experiments<br />
cited by Glenn and Doty (1992), the<br />
cards were used to investigate the amount of<br />
water motion induced by the flow of water into<br />
culture tanks (Fig. 12). Four cards were placed<br />
in the positions shown in each tank in order<br />
to measure water motion near the top and the<br />
bottom of the water column and at the outer<br />
circumference and near the center standpipe<br />
of the tanks (Fig. 12, insert). Increased flow<br />
into the tank mainly increased the amount of<br />
water motion near the periphery of the tank,<br />
whereas water motion near the center remained<br />
low. The results point up the inefficiency<br />
of using volumetric water exchange as<br />
a means of inducing water motion even though<br />
it is a common practice in culture studies.<br />
In conclusion, contrary to Muus (1968) and<br />
Doty (197 l), we have not found problems of<br />
erratic variability in fractional weight loss under<br />
seemingly uniform conditions by CaSO,<br />
blocks from the same lots. The still-water calibration<br />
method recommended by Doty (197 1)<br />
and Doty et al. (1986) should not be used. As<br />
pointed out by Howerton and Boyd (1992) as