Download - ASLO
Download - ASLO
Download - ASLO

Create successful ePaper yourself
Turn your PDF publications into a flip-book with our unique Google optimized e-Paper software.
Notes<br />
1773<br />
0.022<br />
30<br />
0.020<br />
i b 0.019<br />
c -<br />
5 0.016<br />
E<br />
- 0.017<br />
2<br />
0.016<br />
I<br />
0.015<br />
25<br />
I<br />
2 20<br />
0<br />
c g 15<br />
8<br />
2<br />
10<br />
5<br />
Corrected Velocity _<br />
0.014<br />
u 5 10 15 20 25 30 35 40<br />
Salinity, 20<br />
0 A<br />
0<br />
30 40 50 60<br />
Rodius. cm<br />
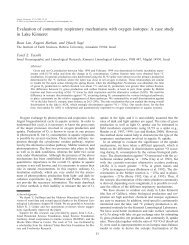
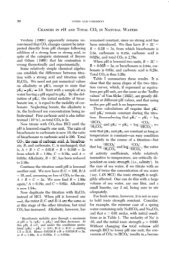
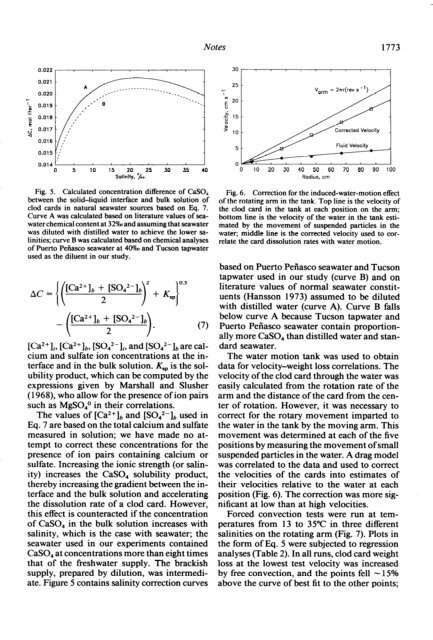
Fig. 5. Calculated concentration difference of CaSO,<br />
between the solid-liquid interface and bulk solution of<br />
clod cards in natural seawater sources based on Eq. 7.<br />
Curve A was calculated based on literature values of seawater<br />
chemical content at 32%1 and assuming that seawater<br />
was diluted with distilled water to achieve the lower salinities;<br />
curve B was calculated based on chemical analyses<br />
of Puerto Peiiasco seawater at 40?&0 and Tucson tapwater<br />
used as the diluent in our study.<br />
Ac =<br />
1(<br />
_<br />
[Ca2+lb + W42% 2 + K Oo5<br />
2 1<br />
SP<br />
I<br />
Ka2+lb + W42- lb<br />
2 ) . (7)<br />
[Ca2+]i, [Ca2+lb, [S042-]i, and [S042-]b are calcium<br />
and sulfate ion concentrations at the interface<br />
and in the bulk solution. Ksp is the solubility<br />
product, which can be computed by the<br />
expressions given by Marshall and Slusher<br />
(1968), who allow for the presence of ion pairs<br />
such as MgS040 in their correlations.<br />
The values of [Ca2+16 and [S042-]b used in<br />
Eq. 7 are based on the total calcium and sulfate<br />
measured in solution; we have made no attempt<br />
to correct these concentrations for the<br />
presence of ion pairs containing calcium or<br />
sulfate. Increasing the ionic strength (or salinity)<br />
increases the CaSO, solubility product,<br />
thereby increasing the gradient between the interface<br />
and the bulk solution and accelerating<br />
the dissolution rate of a clod card. However,<br />
this effect is counteracted if the concentration<br />
of CaSO, in the bulk solution increases with<br />
salinity, which is the case with seawater; the<br />
seawater used in our experiments contained<br />
CaSO, at concentrations more than eight times<br />
that of the freshwater supply. The brackish<br />
supply, prepared by dilution, was intermediate.<br />
Figure 5 contains salinity correction curves<br />
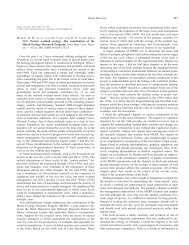
Fig. 6. Correction for the induced-water-motion effect<br />
of the rotating arm in the tank. Top line is the velocity of<br />
the clod card in the tank at each position on the arm;<br />
bottom line is the velocity of the water in the tank estimated<br />
by the movement of suspended particles in the<br />
water; middle line is the corrected velocity used to correlate<br />
the card dissolution rates with water motion.<br />
based on Puerto Peiiasco seawater and Tucson<br />
tapwater used in our study (curve B) and on<br />
literature values of normal seawater constituents<br />
(Hansson 1973) assumed to be diluted<br />
with distilled water (curve A). Curve B falls<br />
below curve A because Tucson tapwater and<br />
Puerto Pefiasco seawater contain proportionally<br />
more CaSO, than distilled water and standard<br />
seawater.<br />
The water motion tank was used to obtain<br />
data for velocity-weight loss correlations. The<br />
velocity of the clod card through the water was<br />
easily calculated from the rotation rate of the<br />
arm and the distance of the card from the center<br />
of rotation. However, it was necessary to<br />
correct for the rotary movement imparted to<br />
the water in the tank by the moving arm. This<br />
movement was determined at each of the five<br />
positions by measuring the movement of small<br />
suspended particles in the water. A drag model<br />
was correlated to the data and used to correct<br />
the velocities of the cards into estimates of<br />
their velocities relative to the water at each<br />
position (Fig. 6). The correction was more significant<br />
at low than at high velocities.<br />
Forced convection tests were run at temperatures<br />
from 13 to 35°C in three different<br />
salinities on the rotating arm (Fig. 7). Plots in<br />
the form of Eq. 5 were subjected to regression<br />
analyses (Table 2). In all runs, clod card weight<br />
loss at the lowest test velocity was increased<br />
by free convection, and the points fell - 15%<br />
above the curve of best fit to the other points;