Download - ASLO
Download - ASLO
Download - ASLO

You also want an ePaper? Increase the reach of your titles
YUMPU automatically turns print PDFs into web optimized ePapers that Google loves.
1774 Notes<br />
0.6<br />
A 25.5’<br />
A 30.5.<br />
0 33.5.<br />
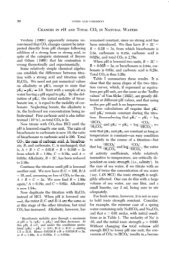
Table 2. Regression analyses of clod card runs at various<br />
salinities and temperatures. The model equation was<br />
in the form [ 1 - (WI W,)]” = a I/‘“; both sides of the equation<br />
were converted to natural logarithms to reduce the<br />
equation to a linear function for analysis.<br />
a<br />
0 2 4 6 6<br />
Velocity. cm a-l<br />
14 16<br />
20<br />
0 13.0 8 0.0146 0.653 0.992 3.16<br />
0 19.5 8 0.0126 0.749 0.992 3.67<br />
0 25.5 8 0.0157 0.772 0.997 2.49<br />
0 30.5 8 0.0178 0.750 0.984 5.33<br />
0 33.5 8 0.0187 0.799 0.996 2.81<br />
20 12.0 8 0.0141 0.765 0.988 4.73<br />
20 19.0 8 0.0136 0.823 0.991 4.43<br />
20 25.5 8 0.0164 0.867 0.990 4.75<br />
20 30.7 8 0.0180 0.868 0.997 2.95<br />
40 13.0 8 0.0130 0.768 0.994 3.24<br />
40 24.5 8 0.0183 0.793 0.998 2.53<br />
40 28.3 8 0.0307 0.757 0.987 4.84<br />
Temperature compensated<br />
0 40 0.0162<br />
20 32 0.0176<br />
40 24 0.0204<br />
0.745 0.965 6.94<br />
0.83 1 0.976 6.41<br />
0.773 0.984 4.93<br />
0.6<br />
V.”<br />
0 2 4 6 6 10 12 14 16 16 20<br />
Velocity, cm *-l<br />
0 13% (4O.h.) C<br />
0 2 4 6 6 10 12 14 16 16 20<br />
Velocity, cm se1<br />
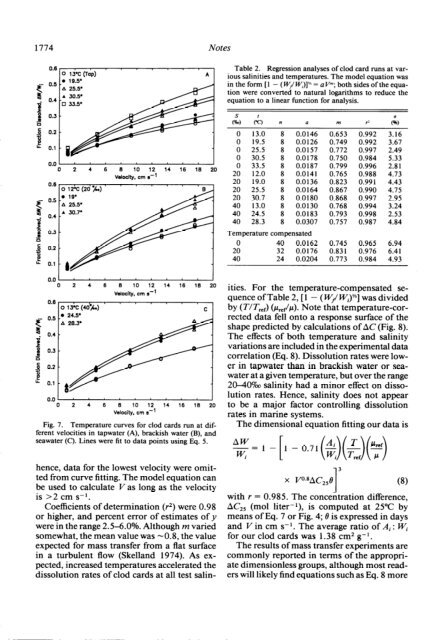
Fig. 7. Temperature curves for clod cards run at different<br />
velocities in tapwater (A), brackish water (B), and<br />
seawater (C). Lines were fit to data points using Eq. 5.<br />
hence, data for the lowest velocity were omitted<br />
from curve fitting. The model equation can<br />
be used to calculate V as long as the velocity<br />
is >2 cm s-l.<br />
Coefficients of determination (r2) were 0.98<br />
or higher, and percent error of estimates of y<br />
were in the range 2.5-6.0%. Although m varied<br />
somewhat, the mean value was -0.8, the value<br />
expected for mass transfer from a flat surface<br />
in a turbulent flow (Skelland 1974). As expected,<br />
increased temperatures accelerated the<br />
dissolution rates of clod cards at all test salin-<br />
ities. For the temperature-compensated sequence<br />
of Table 2, [ 1 - ( Wr/ Wi)“] was divided<br />
by (T/T,,,) (P,&). Note that temperature-corrected<br />
data fell onto a response surface of the<br />
shape predicted by calculations of AC (Fig. 8).<br />
The effects of both temperature and salinity<br />
variations are included in the experimental data<br />
correlation (Eq. 8). Dissolution rates were lower<br />
in tapwater than in brackish water or seawater<br />
at a given temperature, but over the range<br />
20-40?& salinity had a minor effect on dissolution<br />
rates. Hence, salinity does not appear<br />
to be a major factor controlling dissolution<br />
rates in marine systems.<br />
The dimensional equation fitting our data is<br />
%=I -[I -0.71(~)($-Jy)<br />
(8)<br />
with Y = 0.985. The concemration difference,<br />
AC,, (mol liter-‘), is computed at 25°C by<br />
means of Eq. 7 or Fig. 4; 8 is expressed in days<br />
and V in cm s-l. The average ratio of Ai : Wi<br />
for our clod cards was 1.38 cm2 g- l.<br />
The results of mass transfer experiments are<br />
commonly reported in terms of the appropriate<br />
dimensionless groups, although most readers<br />
will likely find equations such as Eq. 8 more