Download - ASLO
Download - ASLO
Download - ASLO

Create successful ePaper yourself
Turn your PDF publications into a flip-book with our unique Google optimized e-Paper software.
Notes 1775<br />
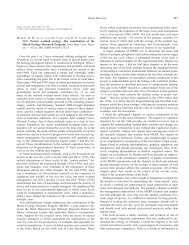
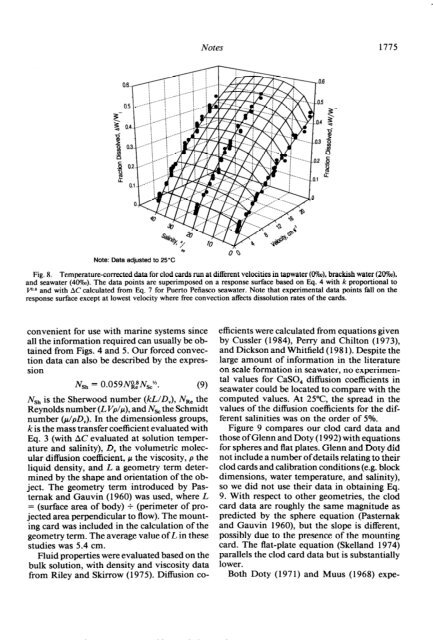
Note: Data adjusted to 25%<br />
Fig. 8. Temperature-corrected data for clod cards run at different velocities in tapwater (O?%O), brackish water (20%0),<br />
and seawater (40%0). The data points are superimposed on a response surface based on Eq. 4 with k proportional to<br />
W.s and with AC calculated from Eq. 7 for Puerto Peiiasco seawater. Note that experimental data points fall on the<br />
response surface except at lowest velocity where free convection affects dissolution rates of the cards.<br />
convenient for use with marine systems since<br />
all the information required can usually be obtained<br />
from Figs. 4 and 5. Our forced convection<br />
data can also be described by the expression<br />
NSh = 0 . 059NgtN SC N - (9)<br />
Ns,, is the Sherwood number (kLID,), NRe the<br />
Reynolds number (L VP/~), and Nsc the Schmidt<br />
number (p/pDJ In the dimensionless groups,<br />
k is the mass transfer coefficient evaluated with<br />
Eq. 3 (with AC evaluated at solution temperature<br />
and salinity), D, the volumetric molecular<br />
difhtsion coefficient, p the viscosity, p the<br />
liquid density, and L a geometry term determined<br />
by the shape and orientation of the object.<br />
The geometry term introduced by Pasternak<br />
and Gauvin (1960) was used, where L<br />
= (surface area of body) + (perimeter of projected<br />
area perpendicular to flow). The mounting<br />
card was included in the calculation of the<br />
geometry term. The average value of L in these<br />
studies was 5.4 cm.<br />
Fluid properties were evaluated based on the<br />
bulk solution, with density and viscosity data<br />
from Riley and Skirrow ( 197 5). Diffusion co-<br />
efficients were calculated from equations given<br />
by Cussler (1984), Perry and Chilton (1973),<br />
and Dickson and Whitfield (198 1). Despite the<br />
large amount of information in the literature<br />
on scale formation in seawater, no experimental<br />
values for CaSO, diffusion coefficients in<br />
seawater could be located to compare with the<br />
computed values. At 25”C, the spread in the<br />
values of the difhtsion coefficients for the different<br />
salinities was on the order of 5%.<br />
Figure 9 compares our clod card data and<br />
those of Glenn and Doty (1992) with equations<br />
for spheres and flat plates. Glenn and Doty did<br />
not include a number of details relating to their<br />
clod cards and calibration conditions (e.g. block<br />
dimensions, water temperature, and salinity),<br />
so we did not use their data in obtaining Eq.<br />
9. With respect to other geometries, the clod<br />
card data are roughly the same magnitude as<br />
predicted by the sphere equation (Pasternak<br />
and Gauvin 1960), but the slope is different,<br />
possibly due to the presence of the mounting<br />
card. The flat-plate equation (Skelland 1974)<br />
parallels the clod card data but is substantially<br />
lower.<br />
Both Doty (197 1) and Muus (1968) expe-