- Page 1 and 2: March 1, 2013 VIA HAND DELIVERY Mr.
- Page 3 and 4: Table of Contents 2012 PEF Customer
- Page 5 and 6: I. OVERALL RELIABILITY PERFORMANCE-
- Page 7: 1. Generation events - see pages 13
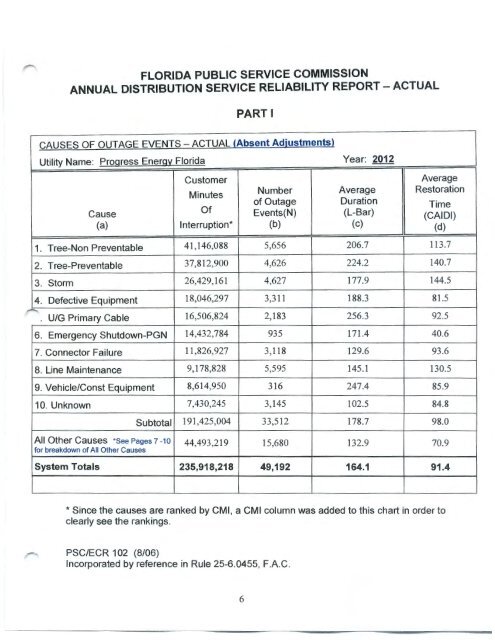
- Page 11 and 12: CAUSES OF OUTAGE EVENTS - {Absent A
- Page 13 and 14: THREE PERCENT FEEDER LIST - ACTU~ {
- Page 15 and 16: GENERATION EVENTS- ADJUSTMENTS (Rul
- Page 17 and 18: TRANSMISSION EVENTS- ADJUSTMENTS (R
- Page 19 and 20: d. Provide the 2012 service reliabi
- Page 21 and 22: 2012 ADJUSTED RELIABILITY (Rule 25-
- Page 23 and 24: n. The process used to identify and
- Page 25 and 26: ' CAUSES OF OUTAGE EVENTS- ADJUSTED
- Page 27 and 28: PART Ill SYSTEM RELIABILITY INDICES
- Page 29 and 30: DISTRIBUTION SUBSTATION (Rule 25-6.
- Page 31 and 32: PEF KPis Trending (2008-2012) ..._
- Page 33 and 34: SUPPLEMENTAL DISTRIBUTION INFORMATI
- Page 35 and 36: w w Progress Energy INTERRUPTI NORT
- Page 37 and 38: ~ Progress Energy MAIFie - Unadjust
- Page 39 and 40: ~ Progress Energy l,lYI,lTEM R!;;~I
- Page 41 and 42: . Describe Company efforts to corre
- Page 43 and 44: Transmission In addition to the act
- Page 45 and 46: percentage of new primary distribut
- Page 47 and 48: .tV. WOOD POLE INSPECTION PROGRAM a
- Page 49 and 50: "ORDERED that, consistent with the
- Page 51 and 52: 1. Describe Company practices regar
- Page 53 and 54: MANAGEMENT REGION (SOUTH CENTRAL) V
- Page 55 and 56: of a storm; etc. To quantify or est
- Page 57 and 58: State whether pole rents are jurisd
- Page 59 and 60:
Transmission Pole Inspections 2012
- Page 61 and 62:
STORM HARDENING ACTIVITIES FOR TRAN
- Page 63 and 64:
Distribution UG Data Input Next Yea
- Page 65 and 66:
POST-STORM DATA C OLLECTION AN D F
- Page 67 and 68:
f) Describe/provide any forensics d
- Page 69 and 70:
OVERHEAD/UNDERGROUND RELIABILITY (O
- Page 71 and 72:
P EF also collects available perfor
- Page 73 and 74:
during storm events. P EF works ext
- Page 75 and 76:
2013 Activities The following activ
- Page 77 and 78:
COLLABORATIVE RESEARCH (Initiative
- Page 79 and 80:
VI. OTHER STORM HARDENING INITIATIV
- Page 81 and 82:
INDEX for Reliability Re ort {6) Po
- Page 83 and 84:
ATTACHEMENT A
- Page 85 and 86:
Date/Time Location Retail CMI Grid
- Page 87 and 88:
Date/Time Location Retail CMI Grid
- Page 89 and 90:
Date/Time Location Retail CMI Grid
- Page 91 and 92:
Date/Time Location Retail CMI Grid
- Page 93 and 94:
Florida PSC Report - Exceptions Onl
- Page 95 and 96:
Summary of Severe Weather Dates 201
- Page 97 and 98:
ATTACHEMENT D
- Page 99 and 100:
ATTACHEMENT E
- Page 101 and 102:
ATTACHEMENT F
- Page 103 and 104:
ATTACHEMENT G
- Page 105 and 106:
SOUTH COASTAL BELLEAIR 1 C1004 2.09
- Page 107 and 108:
SOUTH COASTAL EAST CLEARWATER 2 C09
- Page 109 and 110:
SOUTH COASTAL NORTHEAST 1 X0282 5.9
- Page 111 and 112:
SOUTH COASTAL STARKEY ROAD 1 J0113
- Page 113 and 114:
SOUTH CENTRAL BABSON PARK 1 K1195 3
- Page 115 and 116:
SOUTH CENTRAL CYPRESSWOOD 1 K0317 3
- Page 117 and 118:
SOUTH CENTRAL LAKE LUNTZ 1 K3284 7.
- Page 119 and 120:
SOUTH CENTRAL PINECASTLE 2 W0395 10
- Page 121 and 122:
SOUTH CENTRAL WINDERMERE 3 K302 8.6
- Page 123 and 124:
NORTH COASTAL HOMOSASSA 3 A0271 7.6
- Page 125 and 126:
NORTH COASTAL TRENTON 1 A0090 6.00
- Page 127 and 128:
NORTH CENTRAL DELAND EAST 3 W1104 6
- Page 129 and 130:
NORTH CENTRAL LOCKHART 1 M0412 9.80
- Page 131 and 132:
NORTH CENTRAL UCF NORTH 2 W0988 10.
- Page 133 and 134:
ATTACHEMENT H
- Page 135 and 136:
Pending 10/15/2012 1085510E Tree Tr
- Page 137 and 138:
8/24/2012 1077234E Tree Trimming GI
- Page 139 and 140:
8/1/2012 1074261E Revenue Protectio
- Page 141 and 142:
Storm Hardening Projects - 2010 - 2
- Page 143 and 144:
ATTACHEMENT J
- Page 145 and 146:
Storm Hardening Plan May 3, 2010 Di
- Page 147 and 148:
Storm Hardening Plan May 3, 2010 25
- Page 149 and 150:
Storm Hardening Plan May 3, 2010 Cr
- Page 151 and 152:
Storm Hardening Plan May 3, 2010 St
- Page 153 and 154:
Storm Hardening Plan May 3, 2010 Us
- Page 155 and 156:
Storm Hardening Plan May 3, 2010 fr
- Page 157 and 158:
Storm Hardening Plan May 3, 2010 PE
- Page 159 and 160:
Storm Hardening Plan May 3, 2010 SE
- Page 161 and 162:
Storm Hardening Plan May 3, 2010 Re
- Page 163 and 164:
Storm Hardening Plan May 3, 2010 ad
- Page 165 and 166:
Storm Hardening Plan May 3, 2010 So
- Page 167 and 168:
Storm Hardening Plan May 3, 2010 No
- Page 169 and 170:
Storm Hardening Plan May 3, 2010 No
- Page 171 and 172:
Storm Hardening Plan May 3, 2010 25
- Page 173 and 174:
ATTACHEMENT K
- Page 175 and 176:
Comprehensive Wood Pole Inspection
- Page 177 and 178:
Comprehensive Wood Pole Inspection
- Page 179 and 180:
Comprehensive Wood Pole Inspection
- Page 181 and 182:
Comprehensive Wood Pole Inspection
- Page 183 and 184:
Comprehensive Wood Pole Inspection
- Page 185 and 186:
Comprehensive Wood Pole Inspection
- Page 187 and 188:
ATTACHEMENT L
- Page 189 and 190:
ATTACHEMENT M
- Page 191 and 192:
3.3 High Risk Areas: These are defi
- Page 193 and 194:
8.0 Simplified Component Assessment
- Page 195 and 196:
State 4 Woodpecker Holes Note: Crit
- Page 197 and 198:
9.3 Transmission Line Lattice Tower
- Page 199 and 200:
9.5 Transmission Line Polymer Insul
- Page 201 and 202:
9.8.2 State 3 is described as meeti
- Page 203 and 204:
10.0 References 9.10.12 ROW Conditi
- Page 205 and 206:
Hurricane Preparedness (Slide #2) P
- Page 207 and 208:
Transmission System Readiness (Slid
- Page 209 and 210:
Coordination w/Local Government (Sl
- Page 211 and 212:
Progress Energy Florida 2012 Hurric
- Page 213 and 214:
Distribution System Readiness ● P
- Page 215 and 216:
Storm Restoration Organization Read
- Page 217 and 218:
Hurricane Season Preparedness Concl
- Page 225 and 226:
Attachment P - 2012 Distribution Po
- Page 227 and 228:
Ongoing Storm Preparedness Plan Pur
- Page 229 and 230:
Ongoing Storm Preparedness Plan est
- Page 231 and 232:
Ongoing Storm Preparedness Plan d.
- Page 233 and 234:
Ongoing Storm Preparedness Plan 3)
- Page 235 and 236:
Ongoing Storm Preparedness Plan sys
- Page 237 and 238:
Ongoing Storm Preparedness Plan For
- Page 239 and 240:
Ongoing Storm Preparedness Plan sys
- Page 241 and 242:
Ongoing Storm Preparedness Plan PEF
- Page 243 and 244:
Ongoing Storm Preparedness Plan Ove
- Page 245 and 246:
Ongoing Storm Preparedness Plan •
- Page 247 and 248:
Ongoing Storm Preparedness Plan •
- Page 249 and 250:
ATTACHEMENT S
- Page 251 and 252:
2.3 Program Scope AUTHORIZED COPY T
- Page 253 and 254:
2.4.1 Program Component Frequency T
- Page 255 and 256:
4.1.1.2 Vegetation Clearance: Side
- Page 257 and 258:
AUTHORIZED COPY Reactive Work - veg
- Page 259 and 260:
Attachment B Category 1 Vegetation
- Page 261:
Attachment D Category 3 Vegetation
- Page 297 and 298:
Vegetation Management - Customer De
- Page 299 and 300:
ATTACHEMENT U
- Page 301 and 302:
Post Storm Requirements Data Collec
- Page 303 and 304:
Comparison of Historical Trends Ove
- Page 305 and 306:
OVERHEAD/UNDERGROUND RELIABILITY (O
- Page 307 and 308:
Report on Collaborative Research fo
- Page 309 and 310:
epresentatives of regulatory and co
- Page 311 and 312:
Document title AUTHORIZED COPY Dist
- Page 313 and 314:
) ) AUTHORIZF .... fOPY Distributio
- Page 315 and 316:
Storm Room Standards AUTHORIZED COP
- Page 317 and 318:
AUTHORIZED COPY 3. All road closing
- Page 319 and 320:
Distribution System Storm Center Ma
- Page 321 and 322:
During Major Storm AUTHORIZED COPY
- Page 323 and 324:
Document title AUTHORIZED COPY Stag
- Page 325 and 326:
- AUTHORIZED COPY Staging Site Mobi
- Page 327 and 328:
Daily Staging Site Management AUTHO
- Page 329 and 330:
·-"'"' SL 1A: Svstem Administratio
- Page 331 and 332:
---- ~------- SL3: System Site Coor
- Page 333 and 334:
1 Days (24 HRS) Prior to Storm AUTH
- Page 335 and 336:
1 Day (24 HRS) Prior to Storm AUTHO
- Page 337 and 338:
SL5A 1 : Acquisition Coordinator AU
- Page 339 and 340:
- • Participate in pre-storm Syst
- Page 341 and 342:
SL7A: Site Support Job Function AUT
- Page 343 and 344:
SL7C: Site Hotel Representative AUT
- Page 345 and 346:
AFTER MAJOR STORM AUTHORIZED COPY
- Page 347 and 348:
Job Descriptions AUTHORIZED COPY CC
- Page 349 and 350:
AUTHORIZED COPY Document ti~e Corpo
- Page 351 and 352:
AUTHORIZED COPY Providing Security
- Page 353 and 354:
Tools and Information Needed • Gu
- Page 355 and 356:
Engaged In the Following Sub-proces
- Page 357 and 358:
AUTHORIZED COPY 1. Take inventory o
- Page 359 and 360:
Attachment 5 Workplace Violence Pre
- Page 361 and 362:
AUTHORIZED COPY Business Operations
- Page 363 and 364:
- AUTHORIZED COPY 801: Manager of E
- Page 365 and 366:
AUTHORIZED COPY 8011: Storm Cards A
- Page 367 and 368:
AUTHORIZED COPY The Damage Assessme
- Page 369 and 370:
Pole to Pole Damage Assessment AUTH
- Page 371 and 372:
AUTHORIZED COPY Tree Sweep Sub -pro
- Page 373 and 374:
AUTHORIZED COPY ' )Forensic Assessm
- Page 375 and 376:
Training Requirements AUTHORIZED CO
- Page 377 and 378:
AUTHORIZED COPY After completion of
- Page 379 and 380:
During Major Storm AUTHORIZED COPY
- Page 381 and 382:
Document title IT&T Crisis Response
- Page 383 and 384:
AUTHORIZED COPY All significant inc
- Page 385 and 386:
Ongoing notification AUTHORIZED COP
- Page 387 and 388:
AUTHORIZED COPY • Initiate and le
- Page 389 and 390:
. . AUTHORIZED COPY • Coordinate
- Page 391 and 392:
AUTHORIZED COPY 15.8 IT&T Liaison (
- Page 393 and 394:
AUTHORIZED COPY 15.12 Applications
- Page 395 and 396:
AUTHORIZED COPY • Release employe
- Page 397 and 398:
Document litie AUTHORIZED COPY Exte
- Page 399 and 400:
AUTHORIZED COPY EOC Crew Management
- Page 401 and 402:
AUTHORIZED COPY EOC Communication (
- Page 403 and 404:
Engaged in the Following Sub-proces
- Page 405 and 406:
Key Interface Points • Regional V
- Page 407 and 408:
After Major Storm • • Responsib
- Page 409 and 410:
AUTHORIZED COPY The flowchart below
- Page 411 and 412:
Evacuation of the DCC Facility- Tra
- Page 413 and 414:
Job Descriptions AUTHORIZED COPY DC
- Page 415 and 416:
DCC2A: Dispatch Shift Supervisor AU
- Page 417 and 418:
DCC2A4: Associate Distribution Disp
- Page 419 and 420:
DCC4: Data Management Manager AUTHO
- Page 421 and 422:
OCC4B: Data Coordinator AUTHORIZED
- Page 423 and 424:
Document title AUTHORIZED COPY Reso
- Page 425 and 426:
AUTHORIZED COPY - Line/Tree Acquisi
- Page 427 and 428:
Contractor Demobilization Plan AUTH
- Page 429 and 430:
- 96 HR & 72 HR Procedure for PEF R
- Page 431 and 432:
- AUTHORIZED COPY Resource Link Pro
- Page 433 and 434:
AUTHORIZED COPY During Major Storm
- Page 435 and 436:
RM2B: Tree Account Manager AUTHORIZ
- Page 437 and 438:
Documents/forms needed to perform f
- Page 439 and 440:
Checklist of Actions AUTHORIZED COP
- Page 441 and 442:
Checklist of Actions AUTHORIZED COP
- Page 443 and 444:
- Document titie Performance Suppor
- Page 445 and 446:
AUTHORIZED COPY Job Descriptions (P
- Page 447 and 448:
PS5: Outage Management System Suppo
- Page 449 and 450:
AUTHORIZED COPY 48 Hour Preparation
- Page 451 and 452:
Document title AUTHORIZED COPY Regi
- Page 453 and 454:
REG4: Regional Tactical Management
- Page 455 and 456:
The following flowchart offers a de
- Page 457 and 458:
RSVP Checklist of Actions AUTHORIZE
- Page 459 and 460:
Key Interface Points • • •
- Page 461 and 462:
Key Interface Points • • •
- Page 463 and 464:
Document title AUTHORIZED COPY Cust
- Page 465 and 466:
AUTHORIZED COPY Training Requiremen
- Page 467 and 468:
AUTHORIZED COPY Job Description Dev
- Page 469 and 470:
AUTHORIZED COPY Tools and Informati
- Page 471 and 472:
During Major Storm • Participate
- Page 473 and 474:
CMS3K: Corporate Volunteer/Retiree
- Page 475 and 476:
Document titie AUTHORIZED COPY Supp
- Page 477 and 478:
Supply Chain M&S FL Storm Organizat
- Page 479 and 480:
SC- 2 Warehouse Coordinator (Attach
- Page 481 and 482:
- SC- 20 Stock-out Coordinator Job
- Page 483 and 484:
SC- 38 Staging Site Storekeeper
- Page 485 and 486:
Before Storm Landfall AUTHORIZED CO
- Page 487 and 488:
For the following Supplementarv Inf
- Page 489 and 490:
AUTHORIZED COPY Job Description Res
- Page 491 and 492:
Job Description AUTHORIZED COPY Res
- Page 493 and 494:
Human Resources AUTHORIZED COPY Doc
- Page 495 and 496:
Communication Plan AUTHORIZED COPY
- Page 497 and 498:
Job Descriptions AUTHORIZED COPY HR
- Page 499 and 500:
-· Job Descriptions HR4A: Compensa
- Page 501 and 502:
Job Descriptions AUTHORIZED COPY HR
- Page 503 and 504:
Job Descriptions AUTHORIZED COPY HR
- Page 505 and 506:
Key Performance Indicators for Dama
- Page 507 and 508:
~ Document title ) ) AUTHORIZED \i1
- Page 509 and 510:
ATTACHEMENT Z
- Page 511 and 512:
AUTHORIZED COPY Transmission Planni
- Page 513 and 514:
AUTHORIZED COPY TRANSMISSION PLANNI
- Page 515 and 516:
AUTHORIZED COPY • Wholesale Cente
- Page 517 and 518:
AUTHORIZED COPY Setup Team configur
- Page 519 and 520:
AUTHORIZED COPY DURING THE EVENT
- Page 521 and 522:
AUTHORIZED COPY Pre- Storm 96 hours
- Page 523 and 524:
Coordinators and the Transmission S
- Page 525 and 526:
elease as directed by Transmission
- Page 527 and 528:
AUTHORIZED COPY 7.0 WHOLESALE CUSTO
- Page 529 and 530:
AUTHORIZED COPY • Will assign a m
- Page 531 and 532:
AUTHORIZED COPY Verify area staff h
- Page 533 and 534:
AUTHORIZED COPY 9.3 Maintenance Sup
- Page 535 and 536:
AUTHORIZED COPY Check availability
- Page 537 and 538:
AUTHORIZED COPY Make follow-up cont
- Page 539 and 540:
AUTHORIZED COPY Contact District Co
- Page 541 and 542:
AUTHORIZED COPY • The Area Storm
- Page 543 and 544:
AUTHORIZED COPY restaurant, town, d
- Page 545 and 546:
AUTHORIZED COPY storm/emergency cos
- Page 547 and 548:
AUTHORIZED COPY 22.0 Neighboring Ut
- Page 549 and 550:
27.0 TOPD -FL Coordinator Organizat
- Page 551:
AUTHORIZED COPY Dist. Op. Center Be