2011 Annual School Report - Gordon West Public School
2011 Annual School Report - Gordon West Public School
2011 Annual School Report - Gordon West Public School

You also want an ePaper? Increase the reach of your titles
YUMPU automatically turns print PDFs into web optimized ePapers that Google loves.
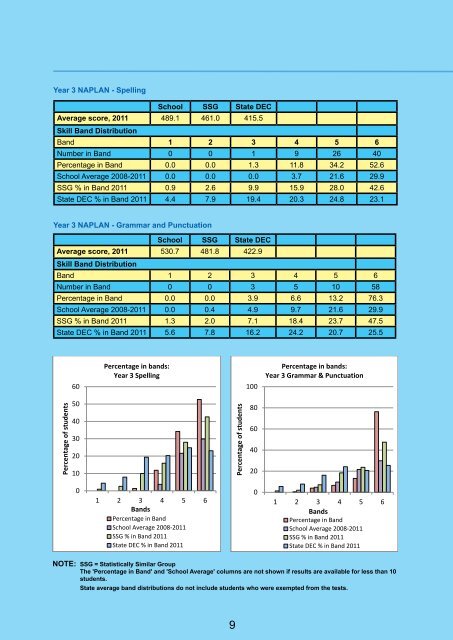
Year 3 NAPLAN - Spelling<br />
<strong>School</strong> SSG State DEC<br />
Average score, <strong>2011</strong> 489.1 461.0 415.5<br />
Skill Band Distribution<br />
Band 1 2 3 4 5 6<br />
Number in Band 0 0 1 9 26 40<br />
Percentage in Band 0.0 0.0 1.3 11.8 34.2 52.6<br />
<strong>School</strong> Average 2008-<strong>2011</strong> 0.0 0.0 0.0 3.7 21.6 29.9<br />
SSG % in Band <strong>2011</strong> 0.9 2.6 9.9 15.9 28.0 42.6<br />
State DEC % in Band <strong>2011</strong> 4.4 7.9 19.4 20.3 24.8 23.1<br />
Year 3 NAPLAN - Grammar and Punctuation<br />
<strong>School</strong> SSG State DEC<br />
Average score, <strong>2011</strong> 530.7 481.8 422.9<br />
Skill Band Distribution<br />
Band 1 2 3 4 5 6<br />
Number in Band 0 0 3 5 10 58<br />
Percentage in Band 0.0 0.0 3.9 6.6 13.2 76.3<br />
<strong>School</strong> Average 2008-<strong>2011</strong> 0.0 0.4 4.9 9.7 21.6 29.9<br />
SSG % in Band <strong>2011</strong> 1.3 2.0 7.1 18.4 23.7 47.5<br />
State DEC % in Band <strong>2011</strong> 5.6 7.8 16.2 24.2 20.7 25.5<br />
60<br />
Percentage in bands:<br />
Year 3 Spelling<br />
100<br />
Percentage in bands:<br />
Year 3 Grammar & Punctuation<br />
Percentage of students<br />
50<br />
40<br />
30<br />
20<br />
10<br />
Percentage of students<br />
80<br />
60<br />
40<br />
20<br />
0<br />
1 2 3 4 5 6<br />
Bands<br />
Percentage in Band<br />
<strong>School</strong> Average 2008-<strong>2011</strong><br />
SSG % in Band <strong>2011</strong><br />
State DEC % in Band <strong>2011</strong><br />
0<br />
1 2 3 4 5 6<br />
Bands<br />
Percentage in Band<br />
<strong>School</strong> Average 2008-<strong>2011</strong><br />
SSG % in Band <strong>2011</strong><br />
State DEC % in Band <strong>2011</strong><br />
NOTE: SSG = Statistically Similar Group<br />
The 'Percentage in Band' and '<strong>School</strong> Average' columns are not shown if results are available for less than 10<br />
students.<br />
State average band distributions do not include students who were exempted from the tests.<br />
9