does teacher preparation matter for beginning teachers in
does teacher preparation matter for beginning teachers in
does teacher preparation matter for beginning teachers in

You also want an ePaper? Increase the reach of your titles
YUMPU automatically turns print PDFs into web optimized ePapers that Google loves.
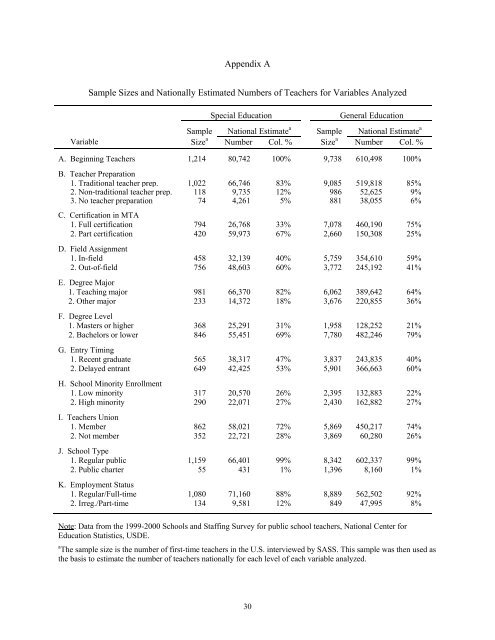
Appendix A<br />
Sample Sizes and Nationally Estimated Numbers of Teachers <strong>for</strong> Variables Analyzed<br />
Special Education<br />
General Education<br />
Sample National Estimate a Sample National Estimate a<br />
Variable Size a Number Col. % Size a Number Col. %<br />
A. Beg<strong>in</strong>n<strong>in</strong>g Teachers 1,214 80,742 100% 9,738 610,498 100%<br />
B. Teacher Preparation<br />
1. Traditional <strong>teacher</strong> prep. 1,022 66,746 83% 9,085 519,818 85%<br />
2. Non-traditional <strong>teacher</strong> prep. 118 9,735 12% 986 52,625 9%<br />
3. No <strong>teacher</strong> <strong>preparation</strong> 74 4,261 5% 881 38,055 6%<br />
C. Certification <strong>in</strong> MTA<br />
1. Full certification 794 26,768 33% 7,078 460,190 75%<br />
2. Part certification 420 59,973 67% 2,660 150,308 25%<br />
D. Field Assignment<br />
1. In-field 458 32,139 40% 5,759 354,610 59%<br />
2. Out-of-field 756 48,603 60% 3,772 245,192 41%<br />
E. Degree Major<br />
1. Teach<strong>in</strong>g major 981 66,370 82% 6,062 389,642 64%<br />
2. Other major 233 14,372 18% 3,676 220,855 36%<br />
F. Degree Level<br />
1. Masters or higher 368 25,291 31% 1,958 128,252 21%<br />
2. Bachelors or lower 846 55,451 69% 7,780 482,246 79%<br />
G. Entry Tim<strong>in</strong>g<br />
1. Recent graduate 565 38,317 47% 3,837 243,835 40%<br />
2. Delayed entrant 649 42,425 53% 5,901 366,663 60%<br />
H. School M<strong>in</strong>ority Enrollment<br />
1. Low m<strong>in</strong>ority 317 20,570 26% 2,395 132,883 22%<br />
2. High m<strong>in</strong>ority 290 22,071 27% 2,430 162,882 27%<br />
I. Teachers Union<br />
1. Member 862 58,021 72% 5,869 450,217 74%<br />
2. Not member 352 22,721 28% 3,869 60,280 26%<br />
J. School Type<br />
1. Regular public 1,159 66,401 99% 8,342 602,337 99%<br />
2. Public charter 55 431 1% 1,396 8,160 1%<br />
K. Employment Status<br />
1. Regular/Full-time 1,080 71,160 88% 8,889 562,502 92%<br />
2. Irreg./Part-time 134 9,581 12% 849 47,995 8%<br />
Note: Data from the 1999-2000 Schools and Staff<strong>in</strong>g Survey <strong>for</strong> public school <strong>teacher</strong>s, National Center <strong>for</strong><br />
Education Statistics, USDE.<br />
a The sample size is the number of first-time <strong>teacher</strong>s <strong>in</strong> the U.S. <strong>in</strong>terviewed by SASS. This sample was then used as<br />
the basis to estimate the number of <strong>teacher</strong>s nationally <strong>for</strong> each level of each variable analyzed.<br />
30